|
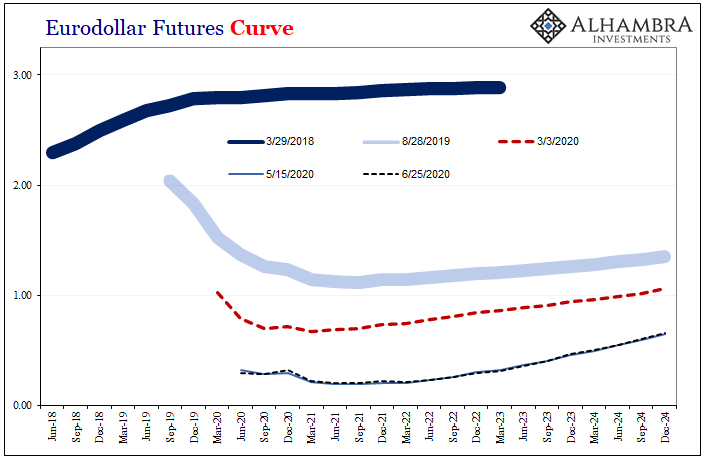
Back in the middle of 2018, this kind of thing was at least straight forward and intuitive. If there was any confusion, it wasn’t related to the mechanics, rather most people just couldn’t handle the possibility this was real. Jay Powell said inflation, rate hikes, and accelerating growth. Absolutely hawkish across-the-board. And yet, all the way back in the middle of June 2018 the eurodollar curve started to say, hold on a minute. That’s the part which caused so much apprehension since we are all taught, and the vast majority still, somehow, believe, central bankers are infallible. A key money market, one of the most sophisticated and deep in world history, blatantly disagreeing with the scenario no one is supposed to challenge (don’t fight the Fed!) It didn’t seem real. Exactly what it was, again, very straightforward. The eurodollar futures curve began to predict the possibility of rate cuts, not hikes, would begin at some unknown point in the future. As the summer dragged on, more and more like a whole string of them. Preposterous at the time, Jay should’ve listened. As I wrote in early July 2018, only a few weeks into the inversion:
|
Eurodollar Futures Curve, 2018-2024 |
| Yep, that’s just what ended up happening to the chagrin of policymakers, bond bears, and pretty much everyone in the financial mainstream cheering on this rather poor attempt at a technocracy. To be a real technocracy would at the very least require technical competence that in this arena would mean absorbing, instead of ignoring, the vital information these things provide gleaned from those who are technically proficient.
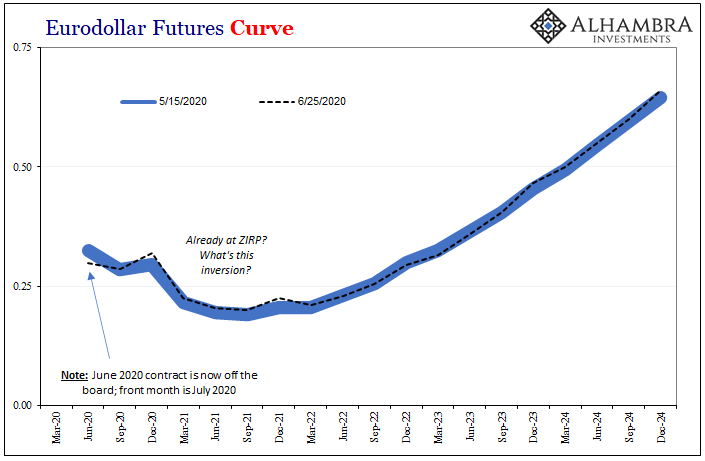
Fast forward to June 2020. The eurodollar futures curve is still inverted. Unlike in June 2018, however, this one takes an extra step or two to untangle. But like June of 2018, most of the confusion will remain centered on how this market could possibly be disagreeing with Jay Powell yet again – if in a different sort of way. To begin with, ZIRP. Having run down to the zero lower bound, there are now no rate cuts left for the FOMC. Thus, what can inversion at this stage possibly mean? Unlike two years ago, it can’t mean that. No, inversion here post-March is about the stuff of Jay Powell’s nightmares. If he thought getting 2019 wholly backward was embarrassing, in this renewed ZIRP, huge QE “flood” of “liquidity” environment what this inversion represents is the market saying, what flood? Since there are no more rate cuts left in the toolkit, it isn’t potential monetary policy that can drive LIBOR lower next year, carving out a curve shape from 2020 to 2021 where the market expects something like that. Instead, it’s elevated LIBOR (TED) this year independent of monetary policy. While it may not seem like much, 10 – 12 bps in this kind of world is a statement. |
Eurodollar Futures Curve, 2020-2024 |
| The market is telling you that the risks of renewed illiquidity (which could result in another possible LIBOR spike) remain significant right at this moment. It’s not like March or even April, things have settled down as they tend to do across these interims, but it’s still there in the background nonetheless; worries that persist hidden in the shadows (to me, and likely the entire monetary system, collateral first and foremost).
This curve shape reflects a palpably nervous environment that hopefully, if everything does go just right, maybe next year, if we make it that far, we can then finally look at moving forward positively. And even then, not a whiff of inflation. Тhese curves are the epitome of deflation risk, not inflation risk. Does anyone really need more evidence as to why the “flood” hasn’t reached the shadows? For one thing, happy thoughts are immaterial to conditions in the real economy, conditions that eurodollar futures participants are intimately familiar with as opposed to Federal Reserve staff and policymakers banging out simulations from academic models that haven’t performed well in decades. The eurodollar market isn’t buying Powell’s story, much like in 2018 even though his story in 2020 is much different (still inflation, as always, but starting from a much worse place). The curve isn’t the only one; Corporate America isn’t buying it, either. |
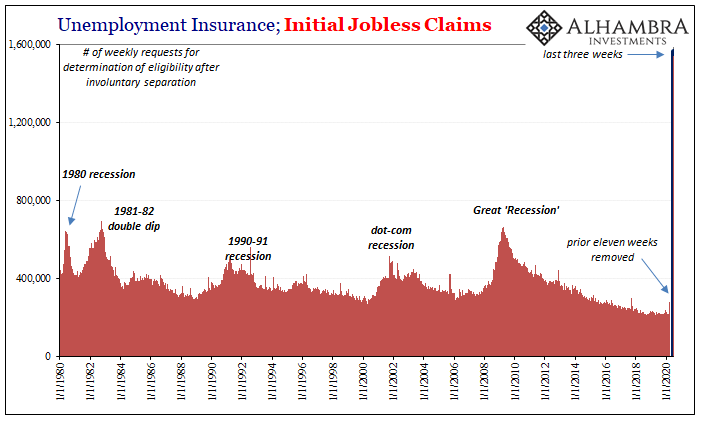
Unemployment Insurance; Initial Jobless Claims, 1980-2020 |
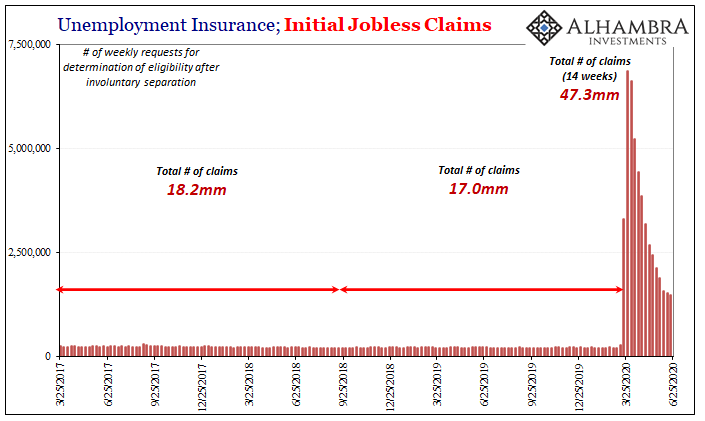
| Good god, the level of jobless claims continues to be enormous; historically high. For the week of June 20, initial claims were only slightly below 1.5 million. That makes three weeks in a row around that same level, hardly much improvement, none that could be reasonably classified as meaningful.
Near or above 1.5 million, if these three weeks had taken place at some other time it would be treated as an epic economic collapse. |
Unemployment Insurance; Initial Jobless Claims, 2017-2020 |
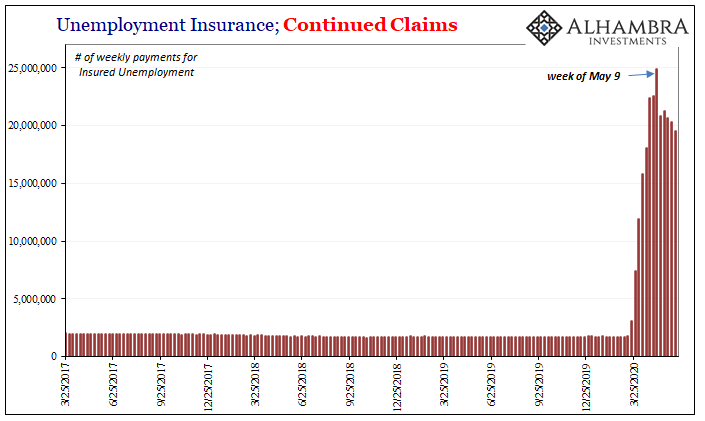
| And while continued claims dropped below 20 million, that wasn’t much of an improvement, either, and certainly does not follow along into that “V” shape so many are assuming is a foregone conclusion.
You know where that kind of result is not being assumed? In the same place that during 2018 it had correctly identified substantial monetary and economic risks that were laughed off as impossible by pretty much everyone. Only to turn out dead-on accurate. Though inversion means something different this time, in both cases it is and was generally the same message: stop listening to Jay Powell. |
Unemployment Insurance; Continued Claims, 2017-2020 |
Full story here Are you the author? Previous post See more for Next post
Tags: Bonds,currencies,Deflation,economy,eurodollar futures,eurodollar futures curve,Federal Reserve/Monetary Policy,FOMC,inflation,Initial Jobless Claims,jay powell,jobless claims,Labor Market,Liquidity,Markets,Monetary Policy,newsletter,QE,rate cuts,Unemployment Claims,ZIRP


