


Jeffrey P. Snider
My articles My offerMy siteAbout meMy videosMy books
Follow on:LinkedINTwitterSeeking Alpha
On April 2, the benchmark 10-year US Treasury yield traded below 2.75%. It had been as high as 2.94% in later February at the tail end of last year’s inflation hysteria. But after the shock of global liquidations in late January and early February, liquidity concerns would override again at least for a short while.
After April 2, the BOND ROUT!!!! was re-energized and away went interest rates. Between that date and May 17, the 10-year yield would jump to as much as 3.11% – the highest yield in a very long time.
While that was going on, policymakers and Economists steadied themselves from the giddiness of prospective normalcy at long last. Underneath, however, there was a much different version brewing. Among many, the euro had turned the wrong way.
Europe’s currency had been rising steadily against the dollar during most of 2017. Apart from a slipup in September and October last year, it was all “weak dollar” stuff; the kind of market action consistent with prevailing perceptions of normalcy. If there is to be a global recovery, the dollar is going down.
| But from April 18 forward, the euro started falling as the dollar started rising. EUR would obviously be joined by a whole range of others, pretty much all of them, in this rising dollar. The BOND ROUT!!! would end, again, on May 17 but the euro’s did not. It would press even further in the wrong direction until the big break on May 29 – which coincided with a massive collateral call pushing UST yields almost all the way back to April 2. |
Benchmark 10-year UST 2017-2018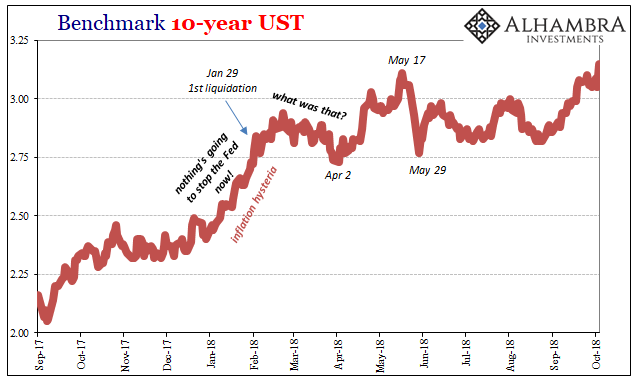 - Click to enlarge |
| Here we are again. UST yields suddenly burst higher today. Today’s action, however, doesn’t suggest reflation so much as liquidation. A 10 bps move in the 10s is a volatile one. Are UST holders afraid of Jay Powell’s view, or did something else happen? |
Dollar Correlations, 2017-2018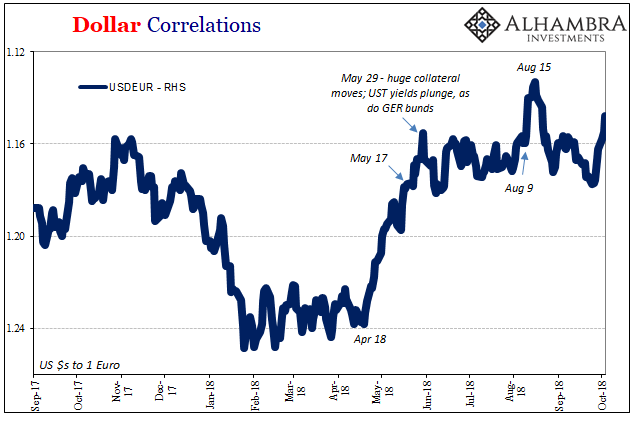 - Click to enlarge |
| It is interesting that this takes place while China is closed. And EUR is getting hit, too. Like April, bond yields are up as is the dollar where it really counts. We don’t know what CNY would be at today, but there are pretty consistent indications that it wouldn’t be in the direction of reflation. |
Dollar Correlations 2018(see more posts on gold price, USD/CNY, )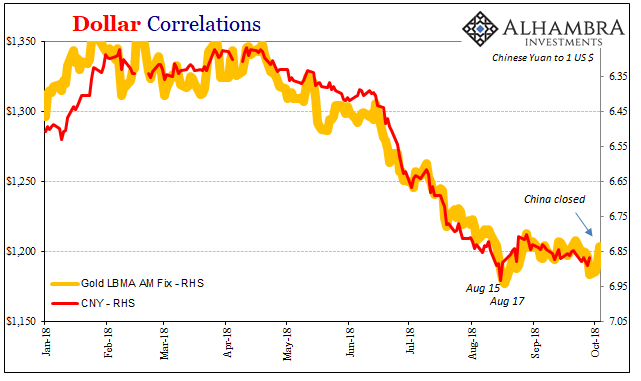 - Click to enlarge |
| This may be the market trading the “decoupling” thesis. Whatever monetary and liquidity problems there are in the world today, the US (but curiously not Europe) is well positioned to easily handle them in a way others are not. This is the Powell scenario.
The stock market agrees, as does, it might at first appear, JPY. Of all the dollar exchanges it is the Japanese yen that lines up with the view from US shares. |
Dollar Correlations, 2017-2018(see more posts on S&P 500, USD/JPY, )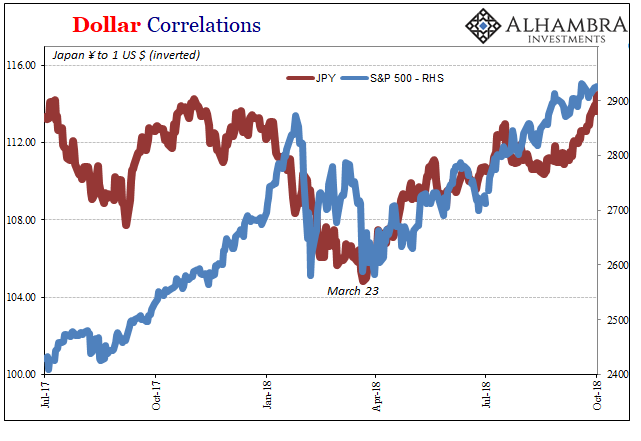 - Click to enlarge |
| Again, going back to that same late March/early April time period, the backwards yen (JPY rising) consistent with illiquidity and deflation turned around the same time the S&P 500 registered its bottom. Today as the BOND ROUT!!! strikes again, JPY reached 114 for the first time since last November – and was the lowest against the dollar since March 2017.
It would seem to suggest something like US/Japan decoupling against Europe and everyone else. This would be a very strange pairing, especially given another possible convergence with gold. Gold and JPY have been linked (in some periods even on an intraday basis) since all the way back in late 2011. The only notable departure was during that “transitory” reflationary retracing of the then-rising dollar in the first few months of 2015. The recoupling of yen and gold around August 2015 wasn’t a good thing for the world. A lot of the difference at that time had to do with Europe, particularly the Swiss trying to avoid the burgeoning dollar storm by decoupling with the euro on its way down. Gold seemed to have acted as a buffer while markets digested what would turn out to be a massively deflationary force – gold’s safety bid outweighed its deflation-faring sellers at certain times. We don’t have the same specific events to compare except to note the timing of China and Hong Kong late last year in gold’s decoupling from JPY. |
Dollar Correlations, 2014-2018(see more posts on gold price, USD/JPY, )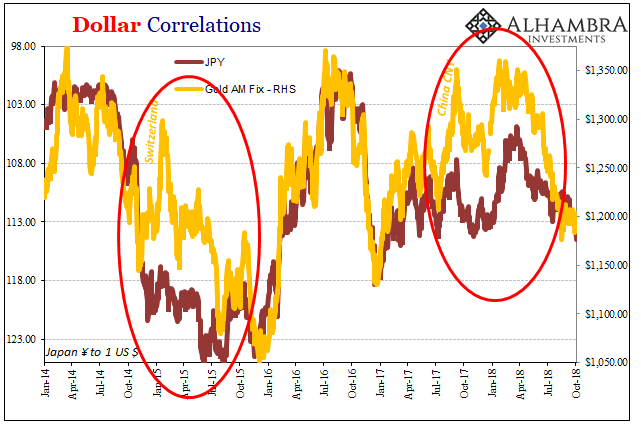 - Click to enlarge |
| In other words, the yen’s falling isn’t necessarily inconsistent with the deflationary rising dollar. It seems to indicate how Japanese banks might be managing tightness on eurodollar markets as either a normal course of redistributing dollars throughout Asia (before 2014) and now retreating from it – selling gold as either a hedge against tightness, or as a way to manage their own eurodollar funding issues (collateral, too).
Gold does seem to be one way out for Japanese banks. JPY falls until it gets to be too much for either, and that exit narrows too much too quickly. This would explain why gold isn’t being reflationary like the BOND ROUT!!!! or JPY would make it seem, more consistent with CNY and all the bad things that follow its downward track. |
Dollar Correlations, 2000-2018(see more posts on gold price, USD/JPY, )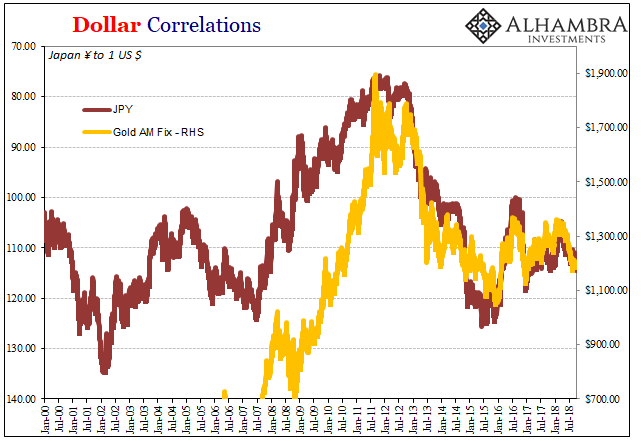 - Click to enlarge |
This view might instead propose that the correlation with the S&P 500 this year is somehow random, or something entirely new. The worst is when JPY reverses – like the summer of 2015. That was what falling yen proposed back then, too. That Japan and/or the US could decouple from the global eurodollar storm at that time still unfolding – using gold as a vehicle to accomplish a partial exit from the tightening which at the time seemed only to be “overseas turmoil” (from both the US and Japanese perspective).
The UST market briefly subscribed to that view. While EUR was falling, as well as practically all the EM currencies including CNY, for four months starting at the beginning of February 2015 it was the same BOND ROUT!!!! The yield on the 10s, as JPY was rejoining with gold, went from 1.68% to 2.50%.
And then it got bad as that previous decoupling try died a disorderly death.
Are we merely repeating the same theme again? Or, going back to August’s payroll report released in early September, is this time actually different? Will it take months to find out, or will China’s reopening over the weekend clarify a few things?
Tags: $CNY,$EUR,$JPY,Bonds,currencies,economy,Federal Reserve/Monetary Policy,Gold,gold price,Markets,newsletter,S&P 500,stocks,U.S. Treasuries,USD-CNY,usd-jpy


