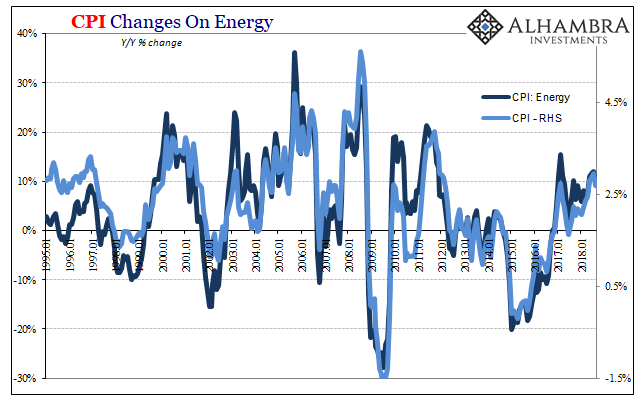
| Cushing, OK, delivered what it could for the CPI. The contribution to the inflation rate from oil prices was again substantial in August 2018. The energy component of the index gained 10.3% year-over-year, compared to 11.9% in July. It was the fourth straight month of double digit gains.
Yet, the CPI headline retreated a little further than expected. After reaching the highest since December 2011 the month before, 2.95%, in August overall consumer prices were up 2.70%. Most of the deceleration was in the so-called core components. |
CPI Changes On Energy 1995-2018 |
| The big problem for Jay Powell as he attempts to make his “rate hike” case is not that the CPI has reached this high after years upon years of undershooting. It’s really whether or not the economy is as he says it is to keep it there. If for the second time in as many years consumer prices trace little more than WTI, then it undercuts his whole argument at a very crucial moment (eurodollar futures inversion, rising downside risks).
This is really two problems rolled into a single concept – the Phillips Curve. By betting on the CPI (as the PCE Deflator’s more buoyant sibling), the FOMC is likewise gambling on the unemployment rate. At 4% or less for several months now in a row, something other than crude oil had better start showing up in consumer prices. The wage pressures that the Phillips Curve demands of an accurate unemployment rate this low cannot remain absent for long. If they don’t happen soon, it can only be that the unemployment rate is wrong and therefore the whole economic narrative falls apart. Again. |
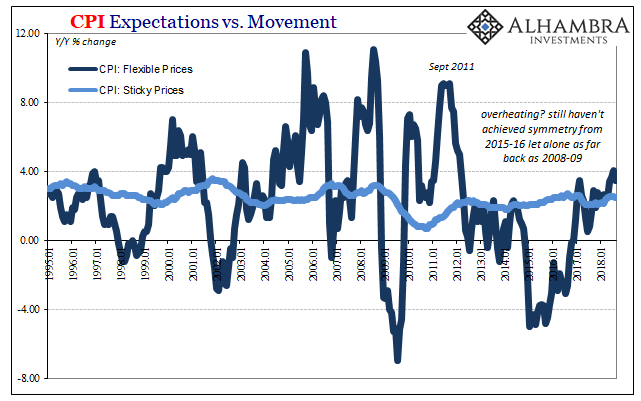
CPI Expectations vs. Movement 1995-2018 |
| Even where it should be right now, there isn’t any hint of accelerating prices outside of energy. The CPI’s most flexible basket items were up by a little more than 4% in July, like the headline the fastest rate since 2011. But, as you can plainly see above, 4% in flexible prices is still way, way below conditions consistent with an inflationary tailwind (for Economists; it’s actually a headwind for consumers).
Last month the flexible prices decelerated, too, rising only 3.5% and mostly from what crude oil is found within them. Along with sticky prices and the so-called core CPI rate, August was yet another month where the Phillips Curve failed to emerge. |
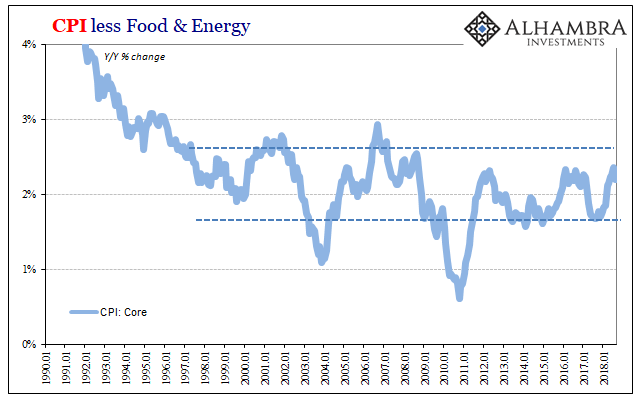
CPI less Food & Energy, 1990-2018 |
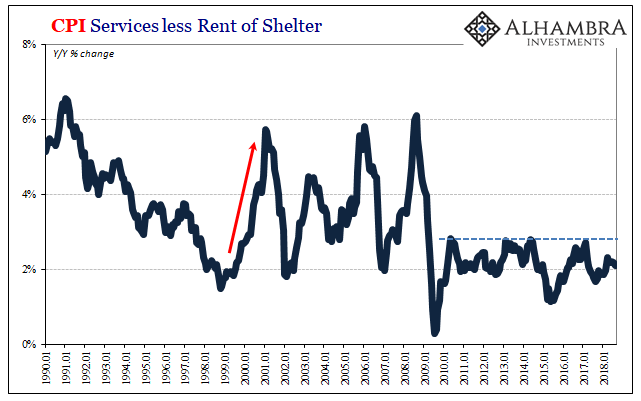
| The core rate at 2.20% in August was the lowest since April. In the services part of the consumer basket, there remains very clearly only the usual dragging or negative pressures with not even the smallest indication of the wage-driven inflationary recovery. This segment would be, as in the past, right where Powell’s narrative would begin first. |
CPI Services less Rent of Shelter, 1990-2018 |
| What that means over the coming months is base effects, lots of them. As we move into the later months of the year, that will put WTI in comparison with the later months of 2017. Prices were on the move higher during those, so in the absence of a similar rise in oil prices over the last few of this year the energy contribution to the CPI, as PCE Deflator, will mathematically diminish.
Either the rest of the economy starts living up to the unemployment rate, or the FOMC’s inflation story will further unravel as the energy piece will no longer be able to contribute double digit gains. August would therefore be the just first month of deceleration all over again. |
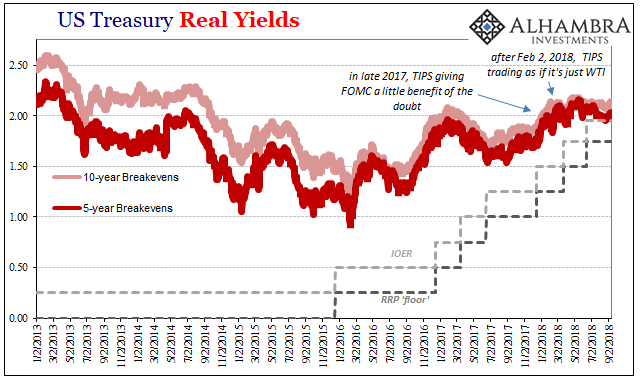
US Treasury Real Yields 2013-2018(see more posts on US Treasury, ) |
| That’s the difference the dollar makes. In late 2017, even though it was only oil prices moving headline inflation rates higher, bond markets still sold off mildly (it was nothing like the BOND ROUT!!!! that was made of it) on them on the small chance oil backwardation was possibly the first step in the inflationary scenario. In other words, a whole year has passed since the bond market was willing to make good on Yellen/Powell’s projections.
Not anymore. In between, there were the stock market liquidations (that marked the top of the rise in the 10-year breakeven), the EM massacre, May 29 (that made for the top of the rise in the 5-year breakeven), and nothing but increasingly uncertain rhetoric that’s all that is left of last year’s inflation hysteria. |
US Treasury Real Yields 2007-2018(see more posts on US Treasury, ) |
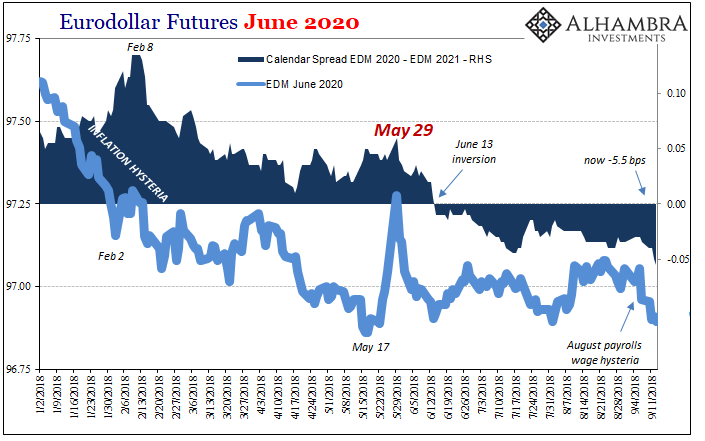
| Bond and funding markets were willing to give the FOMC a chance in 2017, but not in 2018. They can talk the unemployment rate all they want, it has yet to materialize in the CPI and PCE Deflator and markets are now betting that it won’t – at the same time they are betting Powell won’t care that it won’t. |
Eurodollar Futures June 2020(see more posts on EUR/USD, ) |
Tags: Bonds,Core Inflation,CPI,currencies,dollar,economy,EUR/USD,EuroDollar,eurodollar futures,Federal Reserve/Monetary Policy,FOMC,inflation,inflation expectations,Jerome Powell,Markets,newsletter,oil prices,TIPS,US Treasury,WTI


