Joseph Y. Calhoun
My articles My siteAbout meMy videosMy books
Follow on:LinkedINTwitterSeeking AlphaAmazon
The risk budget is unchanged again this month. For the moderate risk investor, the allocation between bonds and risk assets is evenly split. The only change to the portfolio is the one I wrote about last week, an exchange of TIP for SHY.
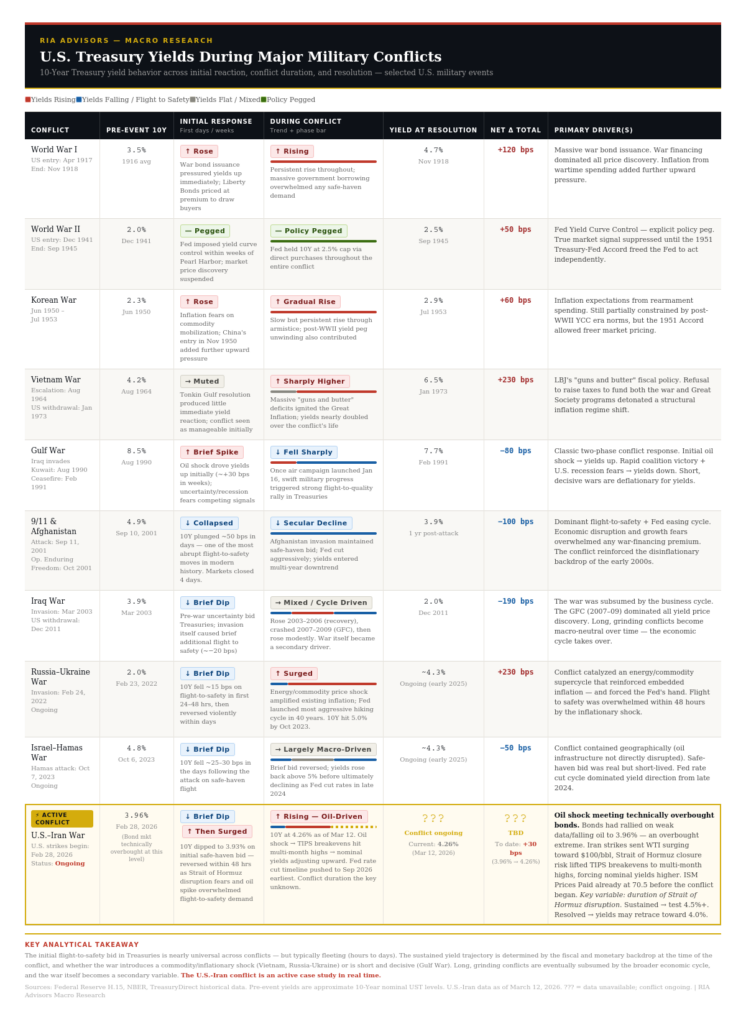
| Interest rates are on the rise again, the 10 year Treasury yield punching through 3% again this morning. That is an indication that growth and/or inflation expectations have risen somewhat recently, but really not a lot has changed. Yes, Q2 GDP did indeed grow by 4.1% according to the BEA but the market is saying pretty clearly that it doesn’t mean much. If the market thought that level of growth was sustainable the 10 year note would not be struggling to get over 3%. The fact is that there were a lot of caveats to that number and when you get to the underlying growth rate it is still sporting a 2 handle.
The surge in Q2 growth was really driven by the change in net exports which was nothing more than a distortion driven by a desire to avoid expected tariffs. Net exports are usually a drag on growth of about 0.5% but for this report provided a boost of 1.1%. That 1.6% net positive change accounts for all the growth in excess of the underlying trend of about 2.5%. Inventories subtracted 1% from GDP and that could be a potential positive in future quarters but that assumes companies have the sales and confidence to build inventories. The uncertainty of the outcome of the trade negotiations makes that unlikely in my opinion but I’d be happy to be proven wrong. As I expected we have seen some positive movement in the trade negotiations recently. The meeting with the EU didn’t yield anything tangible except an agreement to negotiate in good faith which should have never been necessary. But the lessening of tensions between the US and Europe is certainly a positive. There have also been multiple hints from the administration that we will see some positive movement on NAFTA soon as well. That’s also good and maybe some of these talks will actually yield something positive for the US. But any gains we make at the negotiating table will probably not show up as a reduced trade deficit but rather just expanded trade more generally. Our trade deficit isn’t something we can negotiate away. It is a function of our lack of savings – mostly the US government budget deficit. Also, as I expected, we have seen nothing positive between the US and China. The administration is currently looking at imposing 25% tariffs on $200 billion of Chinese goods, more than double what they initially indicated. China has indicated that they will respond in some way although they haven’t been specific yet. China has, in my opinion, the tougher path in this tit for tat. China is still, despite being large, a developing economy. They need foreign expertise – if they didn’t why would they engage in the activity they’re accused of? – so they have to be careful to respond but in a way that doesn’t just send foreign companies packing. The last thing they need is for foreign capital to start fleeing. I do think it is important not to overstate the negatives of this trade spat though. Even if the Trump administration imposes the 25% tariffs we are talking about fairly small numbers. Yes, there are other ways a trade standoff can be – and is – damaging. But the US economy is on fairly solid ground. If the US can bring the EU and NAFTA negotiations to a successful close that reduces trade barriers on all sides, that would seem to be a bigger positive than the stalemate with China. |
Moderate Allocation 50-50 risk budget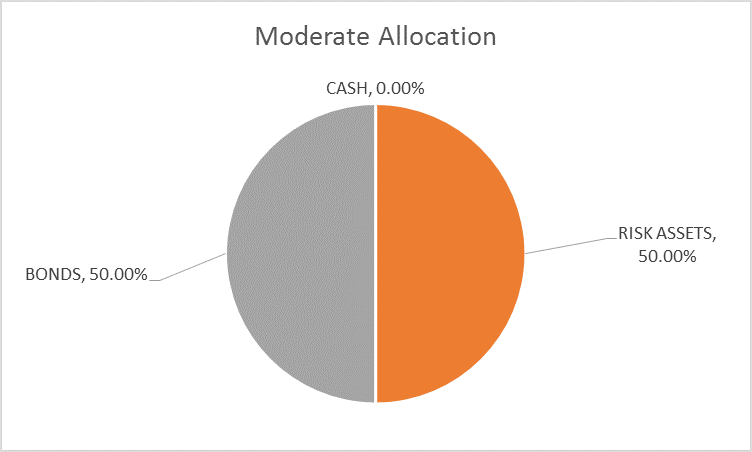 - Click to enlarge |
Yield Curve/RatesThe yield curve has recently steepened slightly but the overall trend is still toward flattening. The recent steepening was due to long rates rising faster than short rates so it isn’t a negative. Some of the rise in long term rates was due to a rise in inflation expectations but TIPs yields rose some too, an indication of better real growth expectations. But this is really just a blip so far. |
Yield Curve - 2 Year Bonds Index - Click to enlarge |
| The two year note yield has resumed its rise after moving sideways for a couple of months. The market is still expecting the Fed to hike rates at least one more time this year. |
2-Year Treasury Yield Index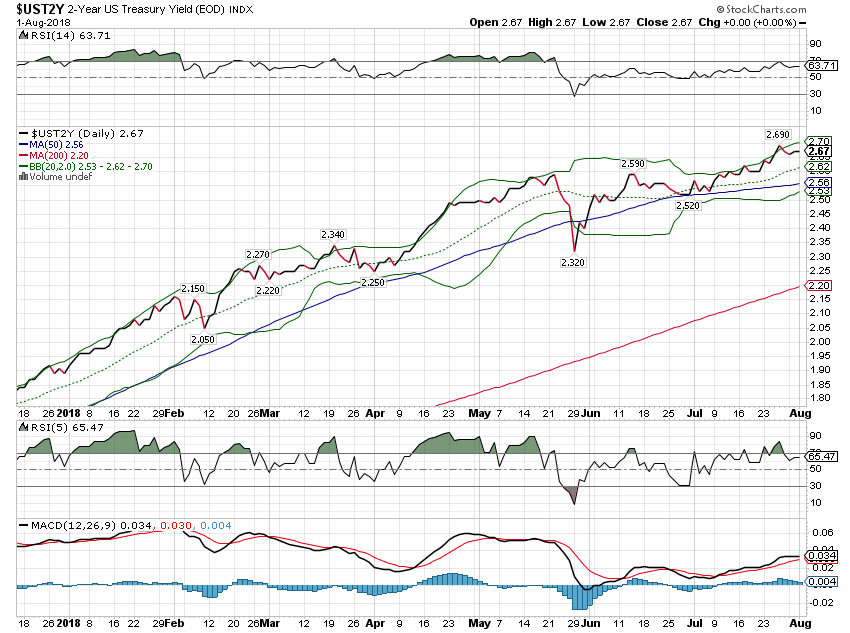 - Click to enlarge |
| The 10 year yield has moved back up to the 3% area but that is just the top of the range that has persisted since the February surge. |
10-Year US Treasury Yield Index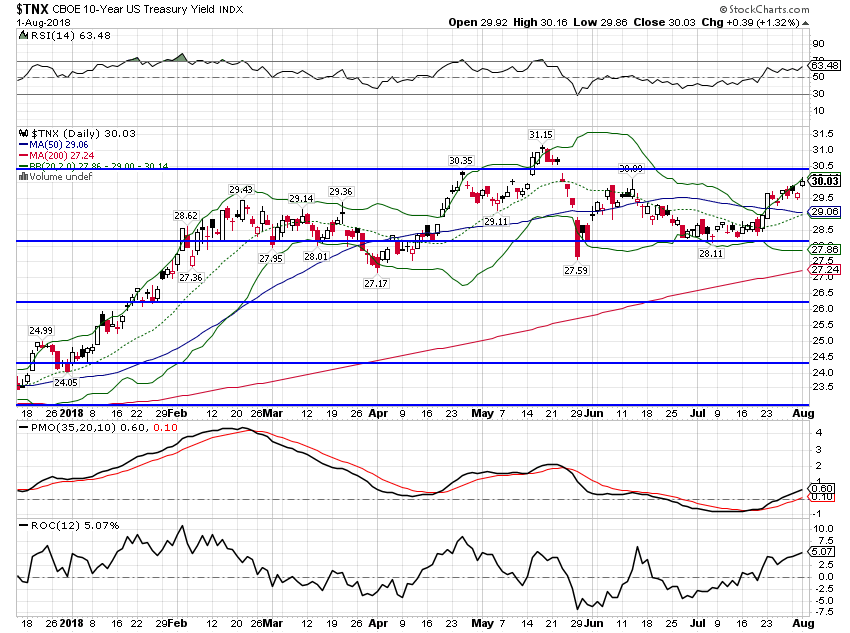 - Click to enlarge |
| The 10 year TIPS yield is also at the top of its range. I am reducing the TIP allocation just in case real growth does break out and take TIPS yields higher. |
10-Year Treasury Inflation-Indexed Security, 2013-2018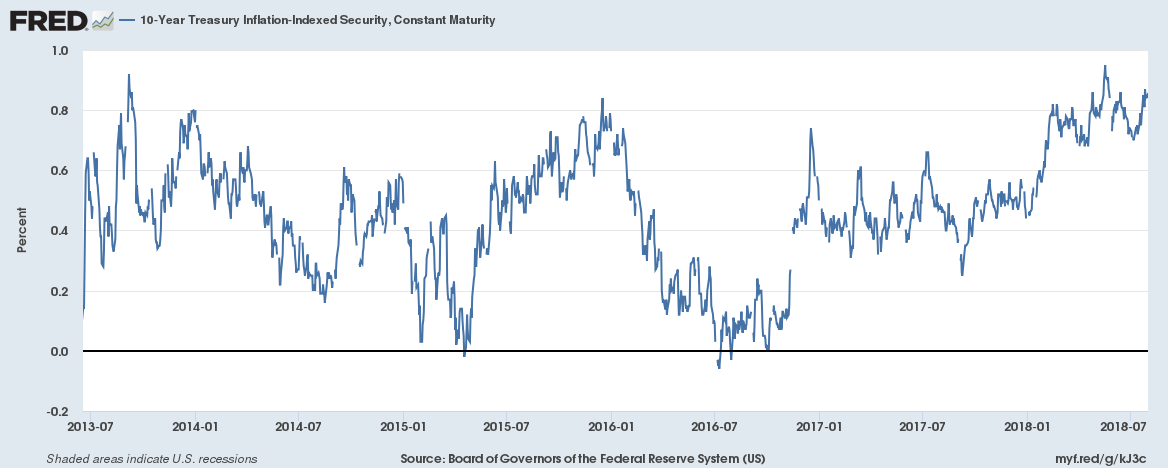 - Click to enlarge |
| As I said, inflation expectations haven’t really moved so this move up in yields is mostly about rising growth expectations. |
10-Year Breakeven Inflation Rate, 2014-2018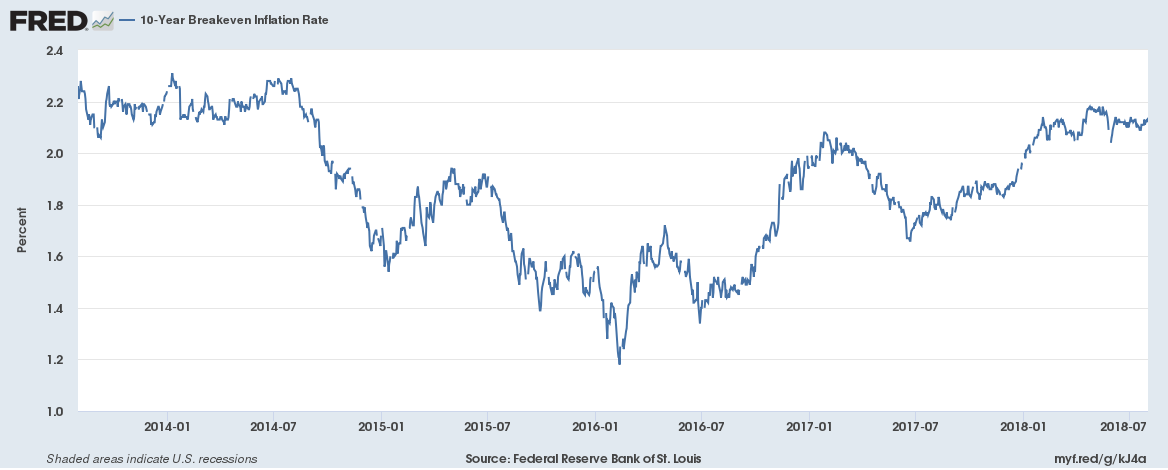 - Click to enlarge |
Credit SpreadsCredit spreads are back near their lows although up a few basis points over the last month. Risk taking is alive and well. |
ICE BofAML US high Yield Master II Option-Adjusted Spread, 2014-2018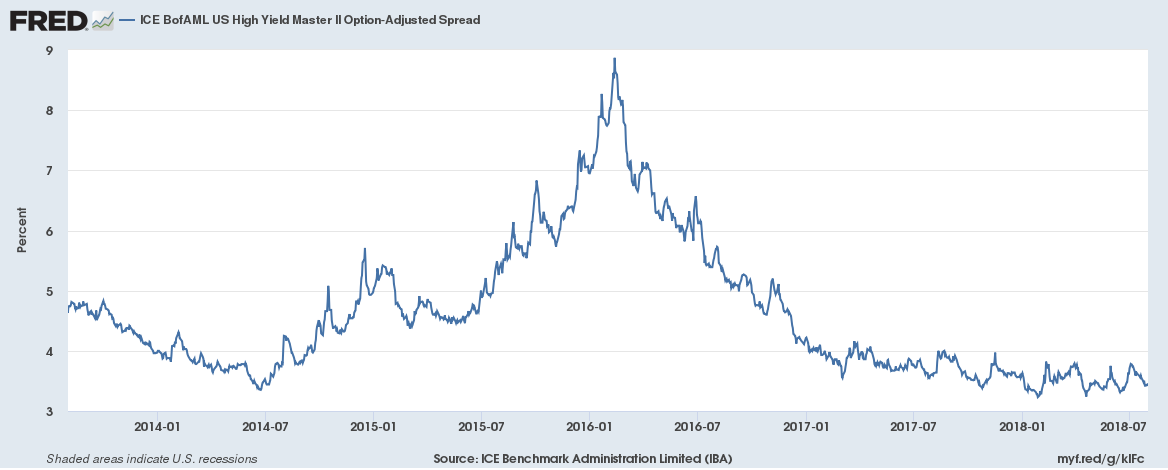 - Click to enlarge |
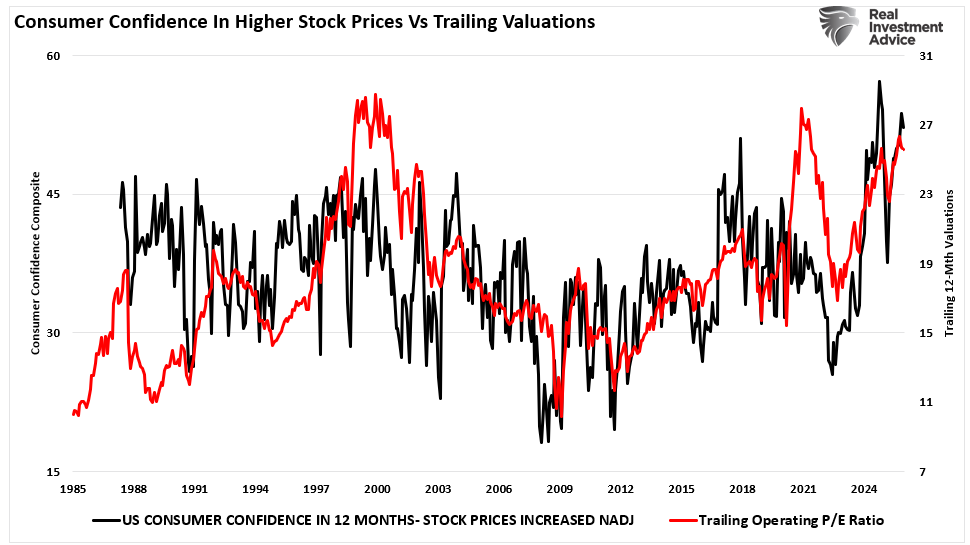
Valuations
Valuations have improved somewhat as earnings have been robust and stock prices have been stuck in a range. Still, we aren’t talking bargain basement here. US stock valuations are expensive relative to history no matter how you look at them. As has been the case for several years, foreign stocks are a lot cheaper than their US counterparts. None of that matters unless the dollar is falling though; international outperformance is almost always a function of currency movements.
MomentumAnd the trend of the dollar is…stalled. The direction from here will likely be determined to some degree by the trade talks. Negative news that sends the dollar higher will not be kind to most risk assets. Agreements will likely be celebrated through a weaker buck. |
US Dollar Index, Oct 2107 - Jul 2018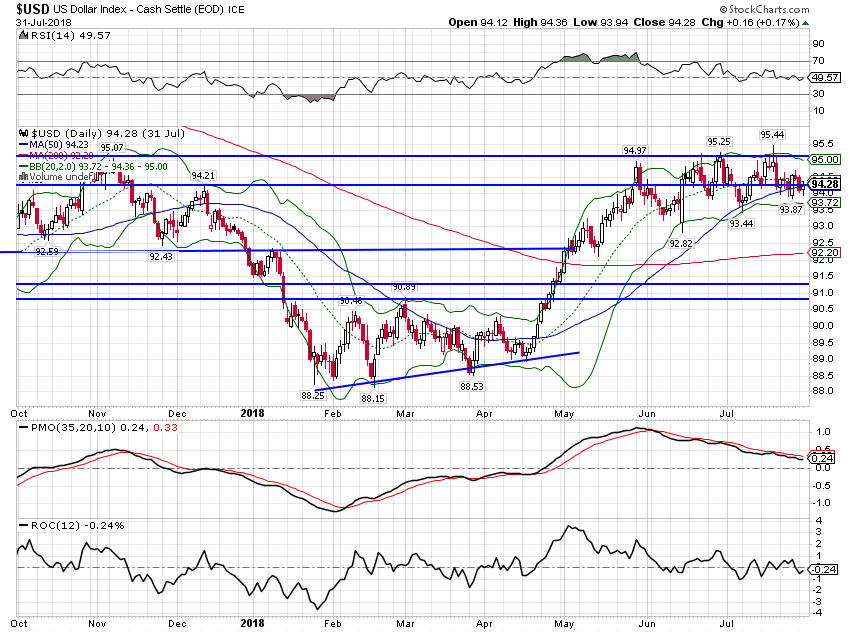 - Click to enlarge |
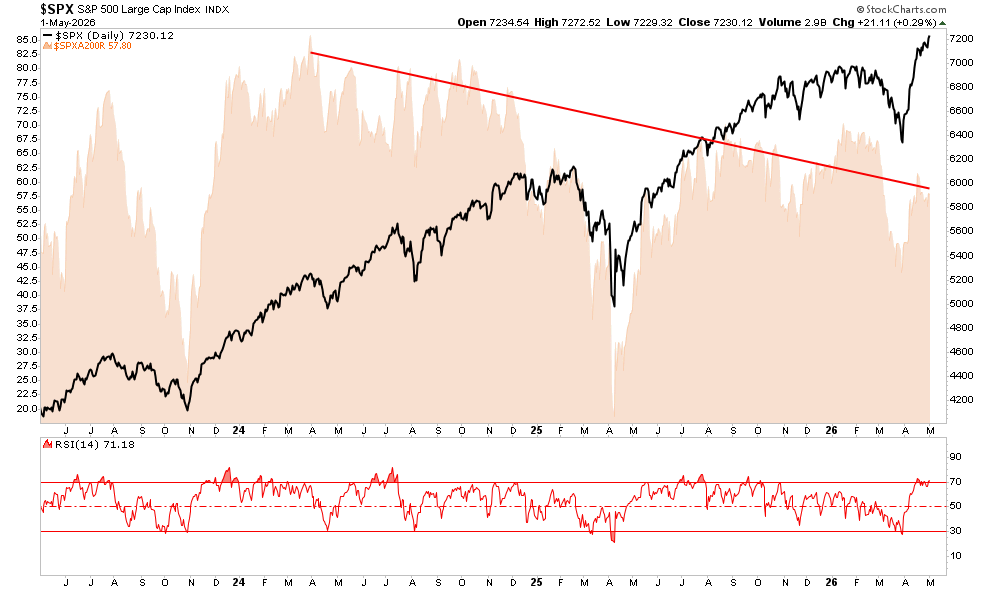
| S&P 500 continues to trend higher on the back of good earnings. With no recession on the horizon it is hard to bet against eventually making new all time highs. |
S&P 500 Large Cap Index(see more posts on S&P 500 Large Cap Index, )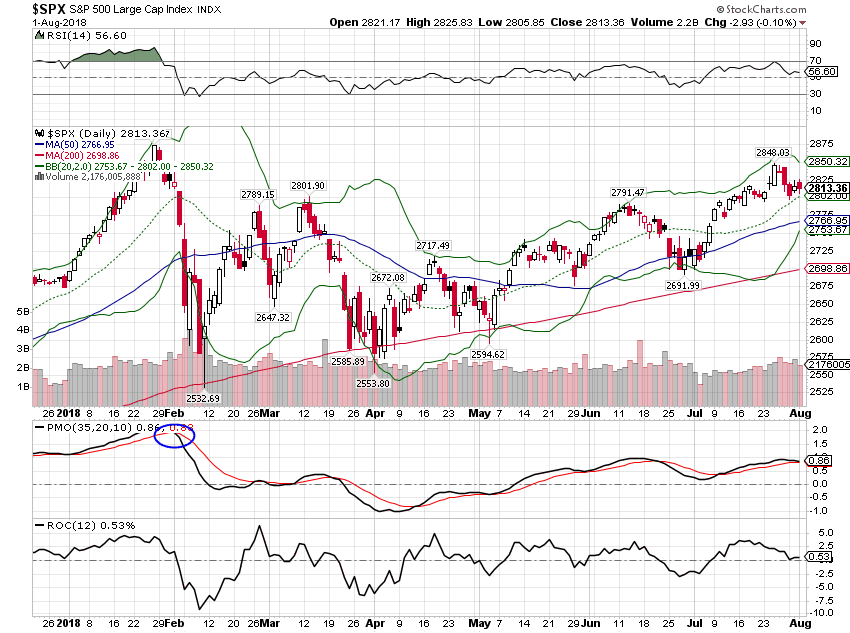 - Click to enlarge |
| Small cap outperformance came to a screeching halt last month. Small caps are seen as more domestic than large cap multinationals and tend to perform well in strong dollar environments. |
iShares Russell 2000 ETF/SPDR S&P 500 ETF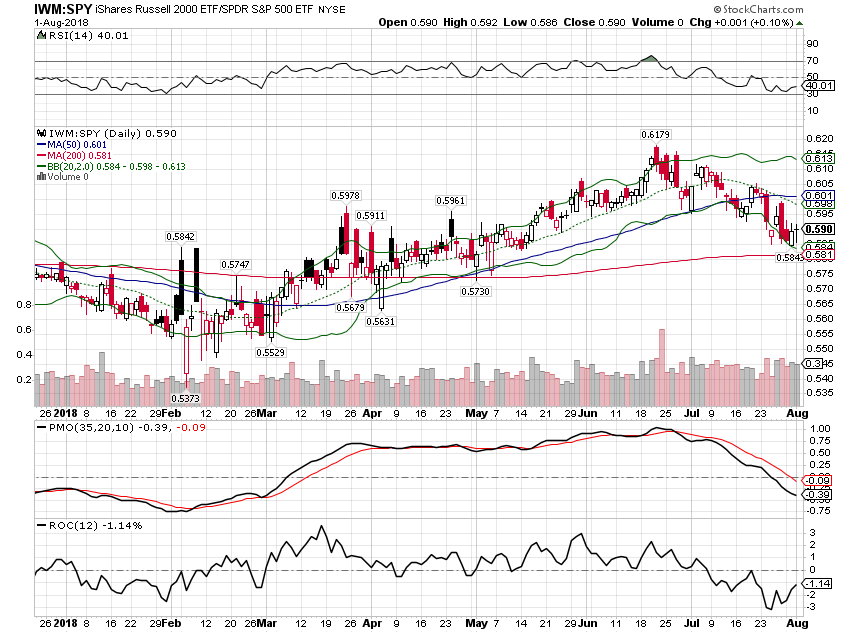 - Click to enlarge |
| Earnings for foreign companies have been good too but EAFE continues to underperform the S&P 500. As I said above, that will probably continue until the dollar downtrend resumes. |
iShares EAFE ETF/SPDR S&P 500 ETF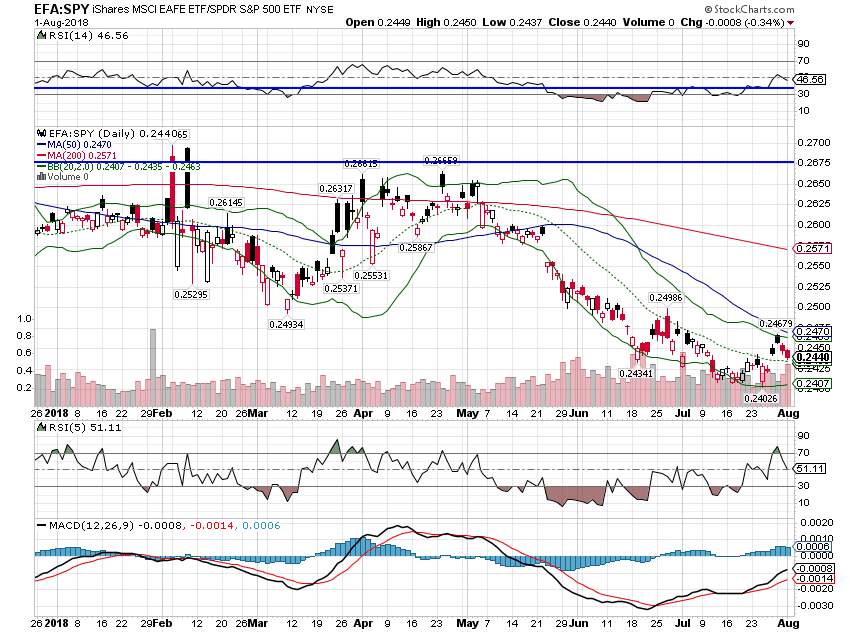 - Click to enlarge |
| Emerging markets are more negatively affected by a stronger dollar and that is reflected in the performance of EM stocks relative to EAFE. If the dollar resumes its downtrend this ratio will resume its uptrend: |
iShares MSCI Emerging Markets ETF/iShares MSCI EAFE ETF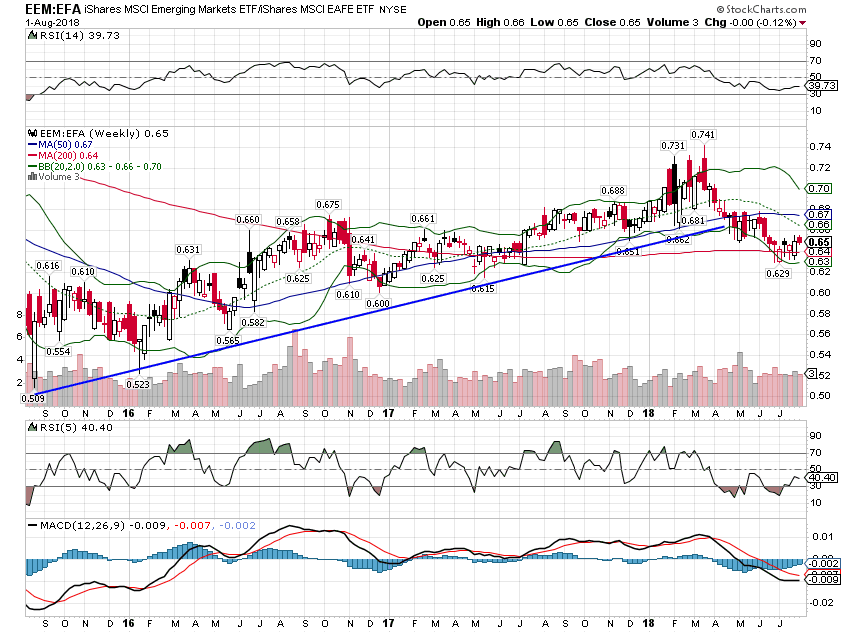 - Click to enlarge |
| Japan continues to outperform EAFE: |
iShares MSCI Japan ETF/iShares MSCI EAFE ETF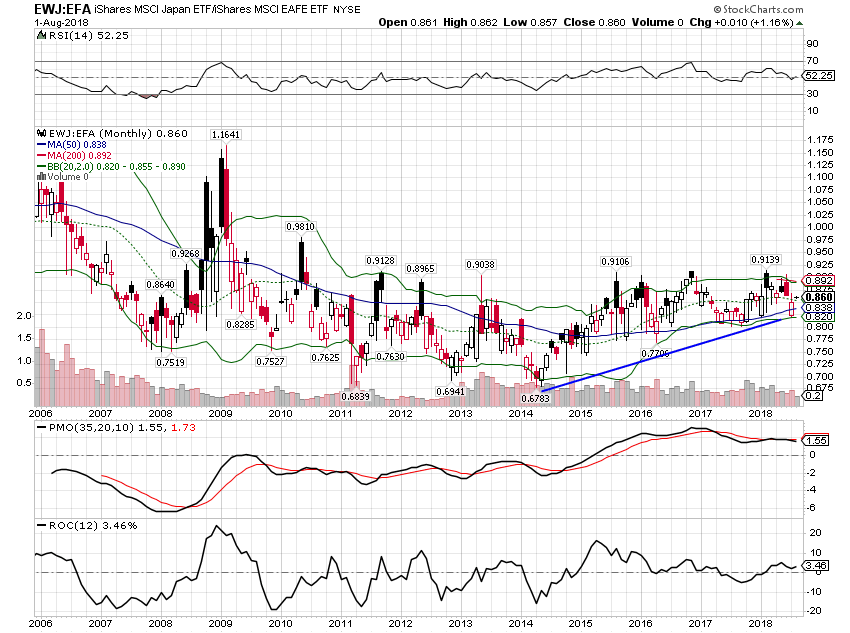 - Click to enlarge |
| Commodities are just hanging onto the uptrend. |
Bloomberg Commodity Index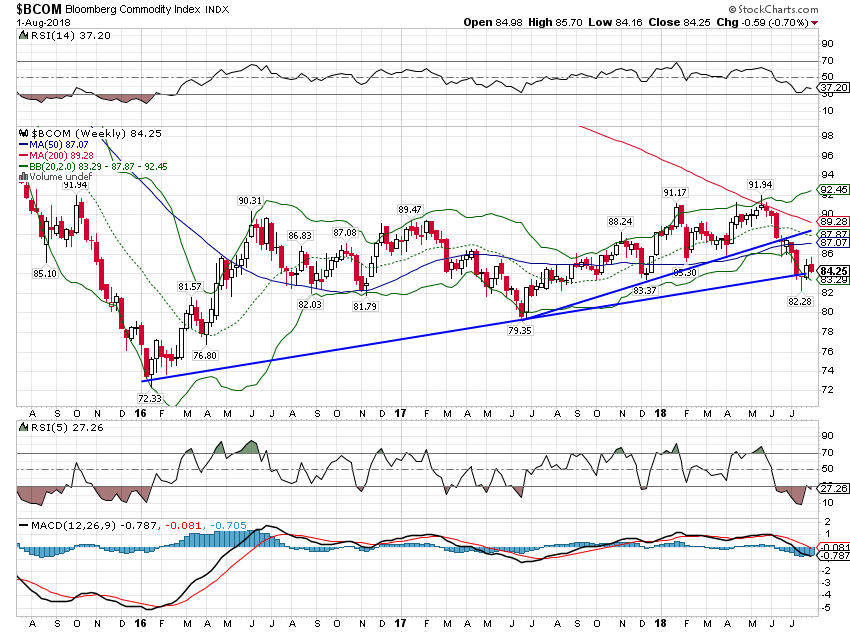 - Click to enlarge |
| The downtrend in gold has been relentless but it may end soon. Hedge funds are just about all in on the short side of the trade so it is due for a reversal, probably a violent one. |
iShares Gold Trust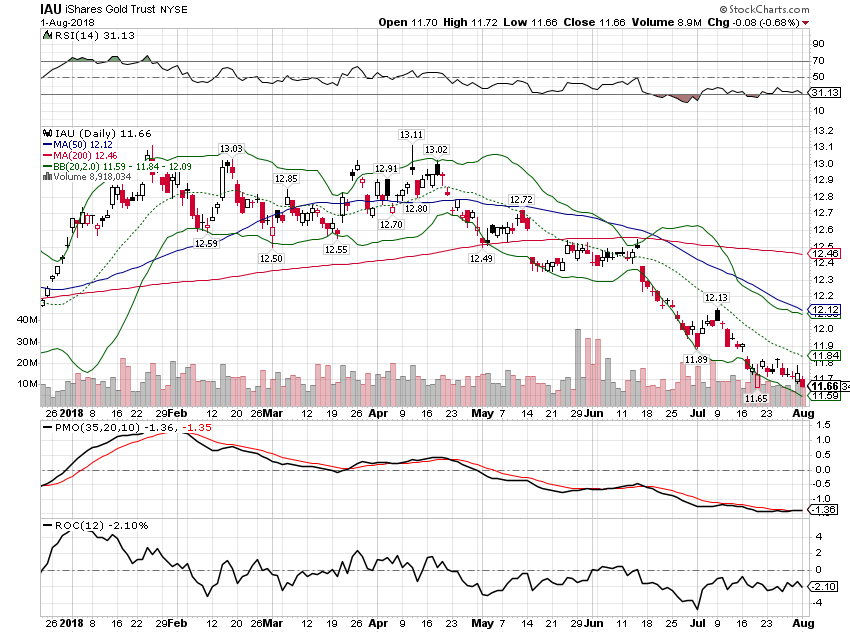 - Click to enlarge |
| Momentum for commodities is still turning positive relative to stocks but the transition is slow. |
S&P GSCI Commodity Index / S&P 500 Large Cap Index 1999-2018(see more posts on S&P 500 Large Cap Index, )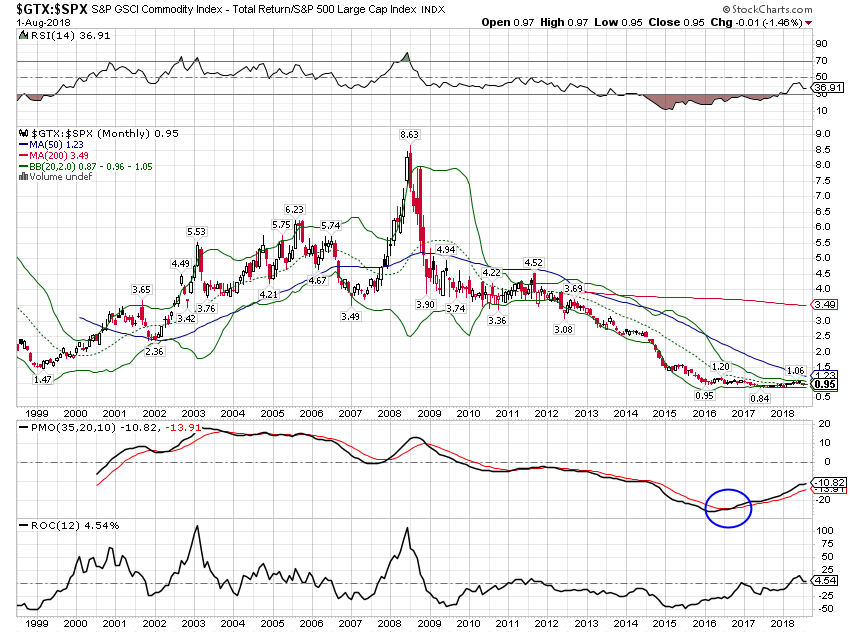 - Click to enlarge |
| TIPS have lost some of their momentum relative to nominal bonds. Weekly momentum has also turned negative which prompts a partial move out of TIP. |
iShares TIPS Bond ETF / iShares 3-7 Year Treasury Bond ETF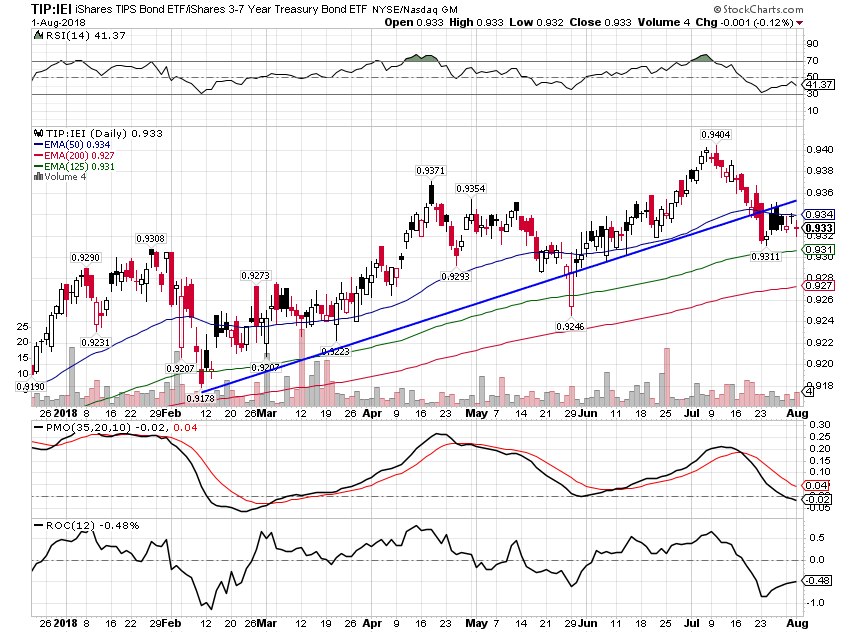 - Click to enlarge |
ChangesSell half of TIP and use the proceeds to buy SHY.
|
Moderate Allocation, Aug 1 2018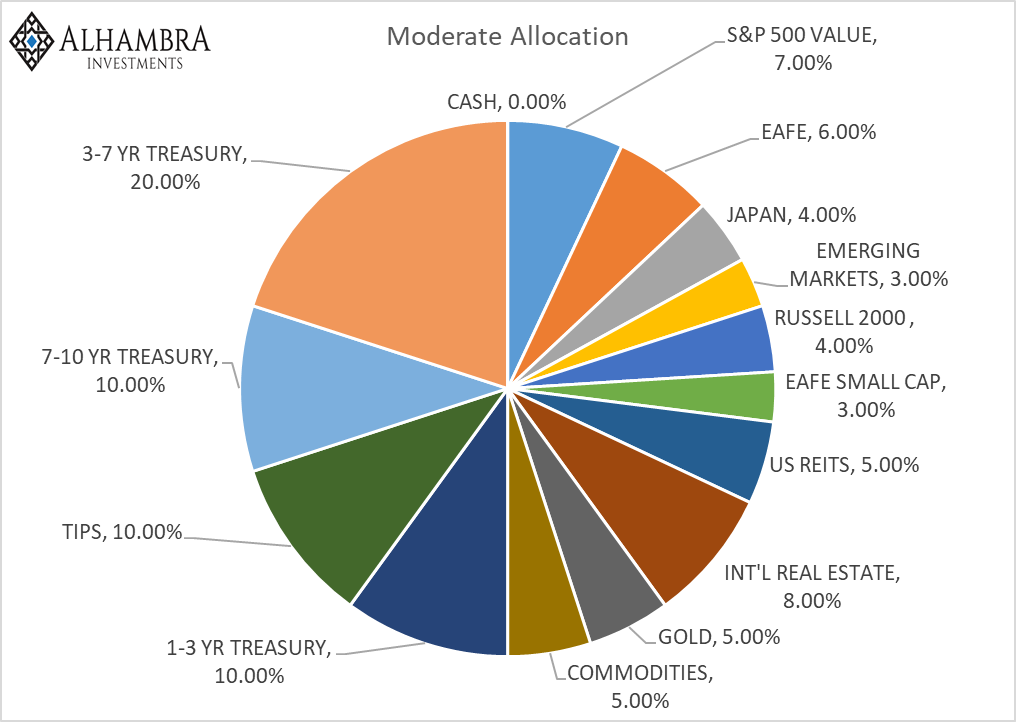 - Click to enlarge |
Tags: Alhambra Research,Bonds,China,commodities,credit spreads,currencies,eafe,economic growth,Emerging Markets,EU,Global Asset Allocation Update,Gold,inflation expectations,Interest rates,Investing,Japan,Markets,Model Portfolios,momentum,NAFTA,newslettersent,Real Estate,S&P 500,S&P 500 Large Cap Index,small cap stocks,stocks,TIPS,Trade War,US dollar,valuations,Yield Curve