Marc Chandler
My articles My offerMy siteAbout meMy videosMy books
Follow on:LinkedINTwitterSeeking AlphaAmazon
Swiss FrancThe Euro has fallen by 0.03% to 1.1746 CHF. |
EUR/CHF and USD/CHF, April 02(see more posts on EUR/CHF, USD/CHF, )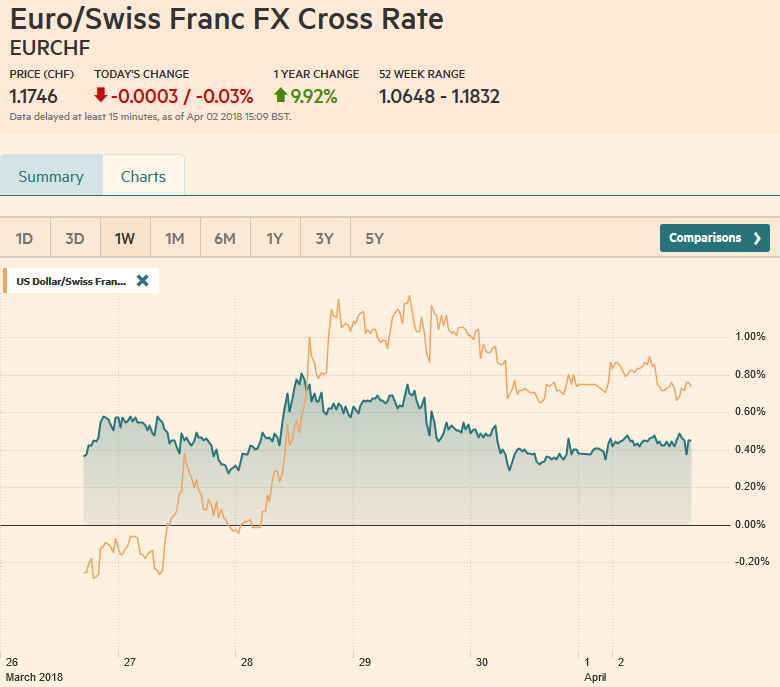 Source: markets.ft.com - Click to enlarge |
FX RatesThe US dollar drifted a little lower in Asia to start the week while equities had a slightly heavier bias. The MSCI Asia Pacific Index slipped 0.1%. European bourses are mostly closed for the extended Easter holiday, while the S&P is set to start the new quarter about 0.3% lower. Although the subdued price action may not reflect it, there have been several new economic reports and developments. Japan’s quarterly Tankan survey was a touch softer than expected and left the market nonplussed. The results of the large manufacturers ticked down to 24 from 25, while the large non-manufacturer sentiment was unchanged at 23. The results for small business was similarly little changed. Given the more than 5% decline in Japanese stocks in Q1 and the fact that it is being targeted with US steel and aluminum tariffs, the fact that both readings remain near multiyear highs is notable. |
FX Daily Rates, April 02 - Click to enlarge |
| Still business showed cautious investment plans. Capex is projected to growth 2.3% in the new fiscal year down from 7.4% the respondents expected in December for the fiscal year that just ended. Business expect the dollar to average JPY109.66 this fiscal year. It averaged about JPY110.85 in the last fiscal year.
Turning to the foreign exchange market, the dollar has been stuck in narrow ranges. The euro has been confined to about 1/5 a cent, while the dollar has traded in a 1/4-yen range. Sterling enjoys a slightly larger range, with a bounce toward $1.4070 when it became clear the $1.40 level was going to hold. |
FX Performance, April 02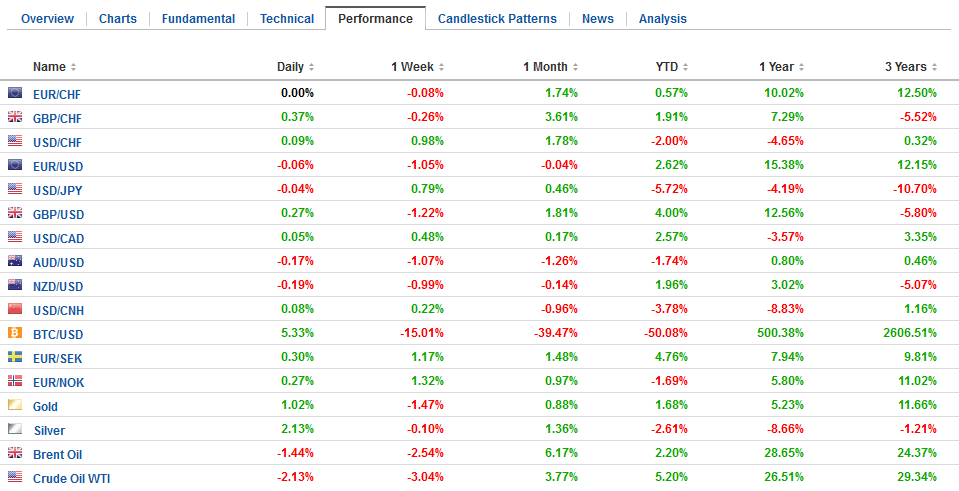 - Click to enlarge |
ChinaChina announced duties on more than 100 US products. Some products, like scrap aluminum and frozen pork were hit with 25% tariffs on top of the current tariff schedule, while other goods, such as dozens of foods, fresh and dried fruit, nuts, and rolled steel bars were subject to new tariffs of 15%. These are not surprising and simply provide details on what Chinese officials already indicated. This is in retaliation for the steel and aluminum tariffs. China’s action is less than the US action and seems mostly symbolic. However, it does not mean that China will not do more. Specifically, by the end of the week US Trade Representative Lighthizer will release the details of the US measures in retaliation for intellectual property rights violations that will include tariffs on $50-$60 bln of Chinese goods. China will likely make take fresh measures after the new US actions are announced. China appears to have a three-prong response to the US. First, there are these symbolic gestures. Second, there is the WTO. Third, China will adjust its behavior. There is little problem with China’s declaratory policy–what it says it will do. The rub lies with its operational policy–what it does. There are several measures that are in China’s interest, like better safeguards for intellectual property rights, especially as Chinese companies acquire their own portfolio of patents and innovations. China’s official PMI was firm, with the manufacturing firming to 51.5 from 50.3 and the non-manufacturing edging up to 54.6 from 54.4. New export orders helped lift the manufacturing results, while construction helped lift non-manufacturing. The Caixin manufacturing PMI, which has a greater weight for small businesses than the official measure, fell to 51.0 from 51.6. |
China Caixin Manufacturing Purchasing Managers Index (PMI), Apr 2013 - 2018(see more posts on China Caixin Manufacturing PMI, )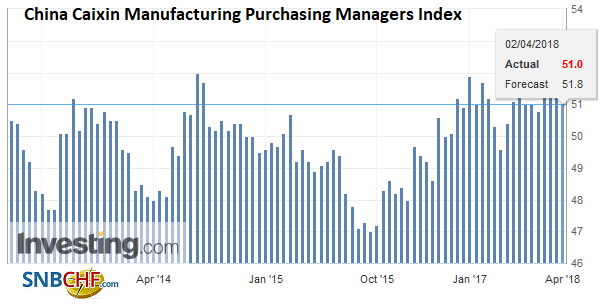 Source: Investing.com - Click to enlarge |
United StatesThe North American session features the US manufacturing (March) PMI and ISM and construction spending (February). The March PMI is at record high, but it is only a three-year old series. |
U.S. Manufacturing Purchasing Managers Index (PMI), Apr 2013 - 2018(see more posts on U.S. Manufacturing PMI, )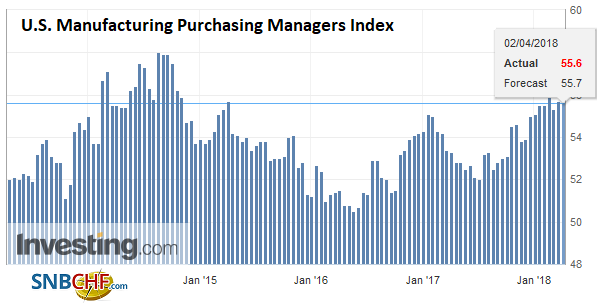 Source: Investing.com - Click to enlarge |
| The ISM, though tells a similar story of strength in the US manufacturing sector. The February reading of 60.8 was slightly below the record high of 61.4 seen in 2004. Construction spending is expected to have ticked up after a flat January. The main takeaway is that the pessimism toward Q1 GDP seen in recent weeks may have been overstated. Meanwhile, Minneapolis Fed’s Kashkari is the only Fed official to speak today and his dovish reputation proceeds him. Markit also report Canada’s manufacturing PMI today. It was at 55.6 in February, which is just shy of the cyclical high seen last April at 55.9. |
U.S. ISM Manufacturing Purchasing Managers Index (PMI), May 2013 - Apr 2018(see more posts on U.S. ISM Manufacturing PMI, )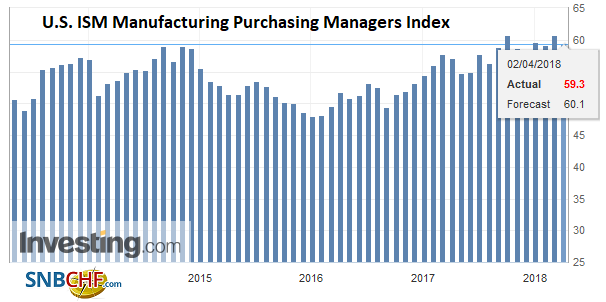 Source: Investing.com - Click to enlarge |
U.S. ISM Manufacturing Employment, May 2013 - Apr 2018(see more posts on U.S. ISM Manufacturing Employment, )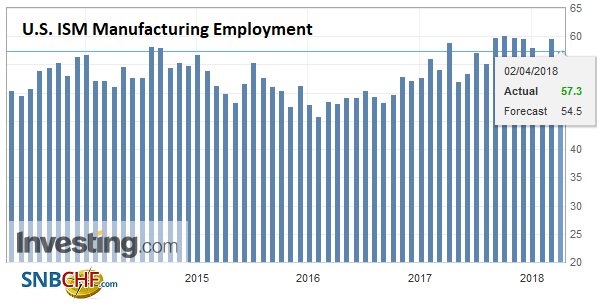 Source: Investing.com - Click to enlarge |
|
Japan |
Japan Manufacturing Purchasing Managers Index (PMI), Apr 2013 - 2018(see more posts on Japan Manufacturing PMI, ) Source: Investing.com - Click to enlarge |
South Korea’s March manufacturing PMI eased to 49.1 from 50.3, an eight-month low. It averaged 50.0 in Q1 and 50.4 in Q4 18 (49.7 average in 2017). Taiwan’s manufacturing PMI slipped to 55.3 from 56.0. It is the second consecutive decline and a four-month low. Malaysia’s manufacturing PMI fell deeper into contraction territory with a 49.5 reading down from 49.9. Indonesia’s manufacturing PMI eased to 50.7 from 51.4 and Thailand’s reading fell into contraction mode (49.1) and its lowest level since late 2016.
Although, the Philippines went the other way, bouncing from February’s six-month low of 50.8 to 51.5, the region appears to have lost some momentum. The US and Europe also appears to have lost some momentum in Q1. The peak of the synchronized recovery may be a 2017 story.
Graphs and additional information on Swiss Franc by the snbchf team.
Full story here Are you the author?Tags: #USD,$EUR,Asia,China,China Caixin Manufacturing PMI,EUR/CHF,EUR/GBP,Japan Manufacturing PMI,newslettersent,SPY,U.S. ISM Manufacturing Employment,U.S. ISM Manufacturing PMI,U.S. Manufacturing PMI,USD/CHF