Marc Chandler
My articles My offerMy siteAbout meMy videosMy books
Follow on:LinkedINTwitterSeeking AlphaAmazon
![]() Introduction by
Introduction by
George Dorgan
My articles
My siteAbout meMy videosMy books
Follow on:LinkedINTwitterSeeking Alpha
CFA SocietyEconomicBlogs
Summary:
The US and Australian two-year interest rates have diverged.
There is scope for a further widening of the spread.
Directionally the correlation between the exchange rate and the rate differentials is strong, but not stable.
Near-term technicals are supportive but the move above trendline resistance is needed to confirm.
The steady increase in the US two-year yield while the market unwinds rate hike expectations in Australia has pushed the US rate above Australia for the first time since late 2000. In the past month, the US two-year yield has risen by 15 bp, while Australia’s has fallen by 13 bp. But the narrowing of the spread, and now inversion, has been unfolding for the past six years.
Moreover, we suspect there is room for divergence to extend well into 2018. Australia’s case rate stands at 1.5%. With the central bank likely on hold for an extended period, the two-year yield can slip closer to the cash target rate. At the same time, the US two-year yield is trading 50 bp above the upper end of the current Fed funds target and 25 bp above the range expected to be adopted next month. That 25 bp may be a reflection of the one rate hike that the Fed funds futures strip appears to have discounted in full.
| What is not priced in is the likelihood of at least two rate hikes next year. We suspect the US two-year yield can rise toward 2.0% and the two-year Australian yield can ease toward 1.50%. The spread, which has just turned in the US favor is likely to continue and could trend toward 50 bp in a coming couple of quarters.
What are the implications for the exchange rate? The Great Graphic posted here shows the rolling 60-day correlation of the two-year interest rate spread and the Australian dollar exchange rate. The correlation shown here is on a purely directional basis. On days the differential increases, the US dollar strengthens the vast majority of times. However, the correlation is not stable, and you can see that in three of the past four years, the correlation snaps and becomes inverted for a short period. Still, as the distribution chart on the right shows that most of the time the correlation is above 0.60. |
AUD BGN Currency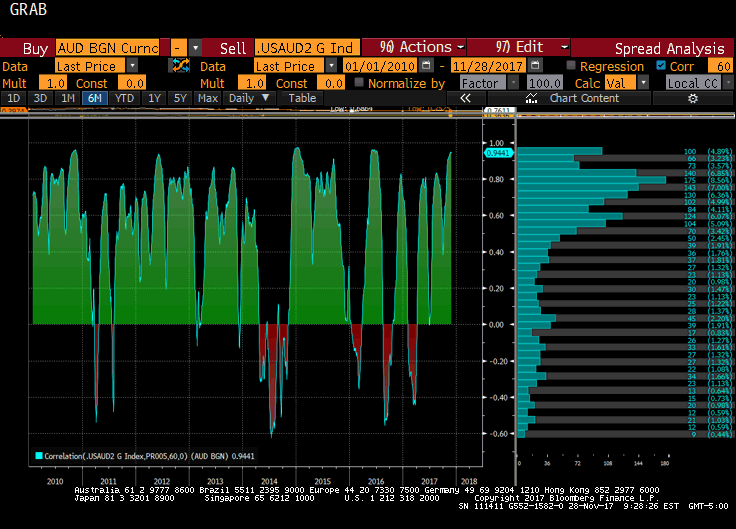 - Click to enlarge |
However, when we conduct the correlations on the level of percentage change, the correlation recently broke down. The 60-day rolling correlation has fallen from a little above 0.5 earlier this month to below 0.2 presently. It is the lowest in a little more than a year. This seems to reflect the fact that after trending since early September, the Australian dollar traded broadly sideways in the first have of November, and then made fresh lows on November 15-21. It recovered following the key reversal on November 21 but posted an outside down day yesterday.
The Aussie is near its 20-day moving average, while the two-year rate differential has continued to sawtooth move lower. The spread has not seen its 20-day moving average since September 21. Taken together the two correlation studies show that while the interest rate spread and the currency tend to move in the same direction, the magnitude of the price movement has become markedly different.
The Australian dollar’s technical condition is modestly constructive. The MACDs are turning higher. The Slow Stochastics have already turned up, and in any event, did not confirm the recent new lows in the Aussie, leaving a bullish divergence in its wake. Speculative positioning in the futures market has adjusted in recent weeks. The gross long speculative position has been trimmed by nearly 30% since the end of September., while the gross short speculative position has increased by nearly 50% since the middle of October. This resulted in a decline in the net long speculative position from 77.2k contracts at the end of September to just below 40k contracts as of November 21, the most recent data. The net position is within a few hundred contracts of this year’s average.
Three-month implied volatility for the Aussie has fallen from near 11.8% at the start of the year to about 7.25% at of June. It was above 9.0% in August and September and has since drifted back toward the year’s low. It is currently a little below 7.5%. The three-month risk-reversal, which is the skew between puts and calls equidistant from the money, favors Aussie puts, but by nearly the least this year (~ 0.65%). It suggests a small bias that volatility is more likely to rise if the Aussie breaks down than if it appreciates. The correlation between the implied three-month volatility and the exchange rates is 0.85 over the past sixty days.
Near-term, watch the downtrend line drawn off the September 20 high (~$0.8100), the October 20 high (~$0.7880), and the pre-weekend high (~$0.7640). The trend line was violated yesterday on an intraday basis, but it closed below it. A break below $0.7575 would suggest the attempt to stem the nearly three-month decline has failed.
Full story here Are you the author?Tags: $AUD,Correlations,Great Graphic,newslettersent