George Dorgan
My articles My siteAbout meMy videosMy books
Follow on:LinkedINTwitterSeeking Alpha
CFA SocietyEconomicBlogs
EUR/CHFThe euro rose close to CHF 1.15 with the ECB meeting this week. Finally traders realized that the ECB committed not to hike rates for a very long time. The ECB will review and take a first decision on the bond purchasing program this autumn. However, this program will come to an end only when the inflation target of 2% becomes in reach. Strangely the EUR/CHF reacted with losses only on Friday. |
Where will Euro area inflation be in December?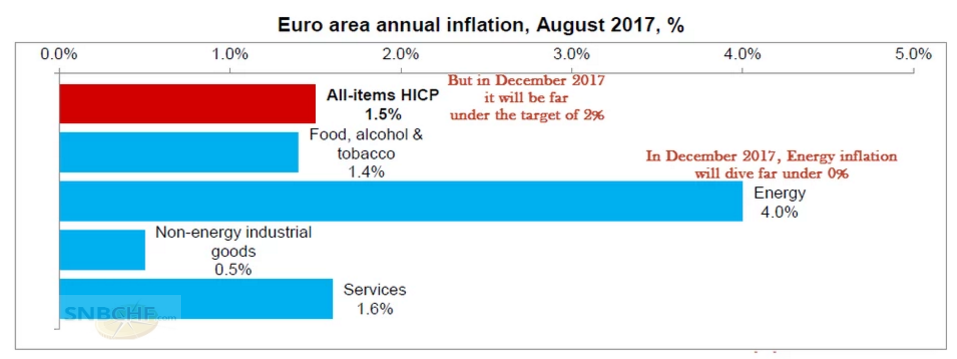 .
|
|
FX RatesThe US dollar had one of its worst weeks of the year, as its interest rate support eroded. Despite prospects for a further upward revision in Q2 US GDP above 3.0% and continued above trend growth, the market continues to downgrade the chances of another rate hike this year. The CME’s model suggests the odds of a hike by the end of the year fell to about 26% from 42% a week ago. The early retirement of the Federal Reserve’s Vice Chairman Fischer and reports that suggest the chances of Cohn replacing Yellen have fallen may have contributed to the reduced expectations and the weaker dollar. Cohn represents a key part of Trump’s coalition, and if he does not get the appointment, or is otherwise sidelined, the energy behind the economic program is diminished. That, in turn, means that thecurrent economic challenges, like the reduced growth potential and weak productivity, aren’t likely to be addressed. The implication of this is that the US 10-year yield can return to levels seen before last November’s election. At the end of October 2016, the US 10-year yield was 1.85%, approximately the level of trend growth. |
The Dollar Crashed against CHF Last Week(see more posts on EUR/CHF, USD/CHF, )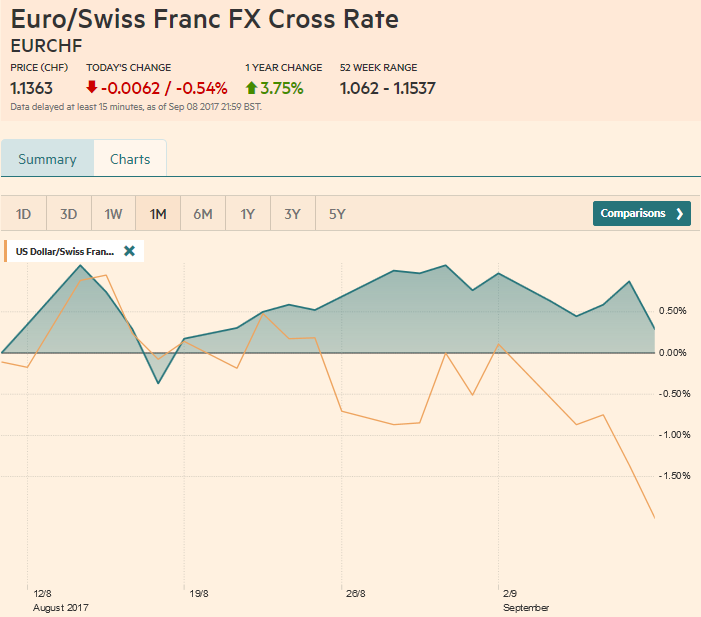 Source: markets.ft.com - Click to enlarge |
Swiss Franc Currency Index (3 years)The Swiss Franc index is the trade-weighted currency performance (see the currency basket)On a three years interval, the Swiss Franc had a weak performance. The dollar index was far stronger. The dollar makes up 33% of the SNB portfolio and 25% of Swiss exports (incl. countries like China or Arab countries that use the dollar for exchanges). Contrary to popular believe, the CHF index gained only 1.73% in 2015. It lost 9.52% in 2014, when the dollar (and yuan) strongly improved. |
Swiss Franc Currency Index (3 years), September 09(see more posts on Swiss Franc Index, )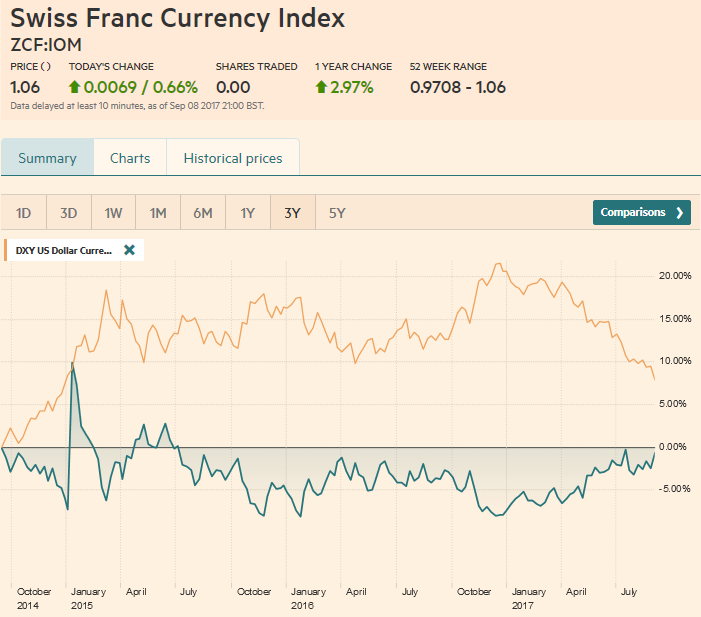 Source: markets.ft.com - Click to enlarge |
Marc Chandler My articles My offerMy siteAbout meMy videosMy books Follow on:LinkedINTwitterSeeking AlphaAmazon US Dollar IndexThe Dollar Index has now met the 50% retracement objective (~91.20) of the rally that began in mid-2014. The 1.6% decline last week was the largest in Q3. The technical indicators suggest this leg down has more room to run. The 61.8% retracement is found at 88.25. On the upside, a move above 92.20 would help stabilize the tone. One note of caution comes from the magnitude of the fall that has pushed the Dollar Index below its lower Bollinger Band (~91.50). |
US Dollar Currency Index, September 09(see more posts on U.S. Dollar Index, )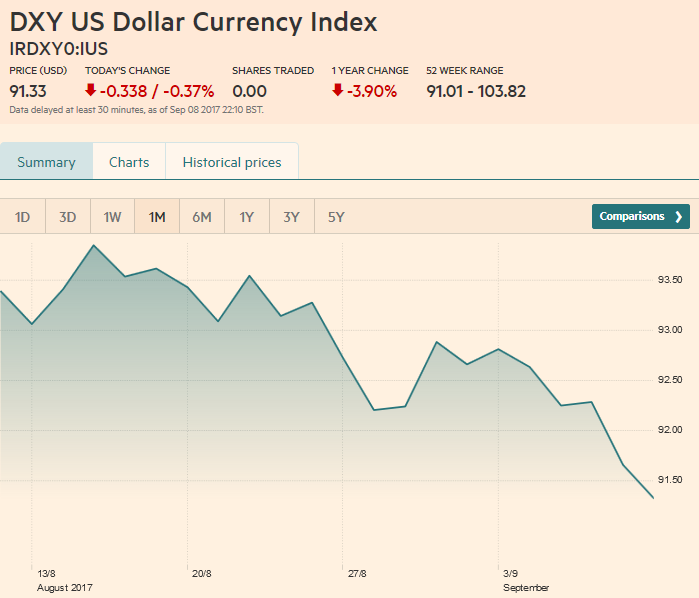 Source: markets.ft.com - Click to enlarge |
EUR/USDThe ECB’s concern about the euro’s appreciation has risen since July meeting, but it still has not reached the official pain threshold. The market’s enthusiasm for the euro has not waned. The 50% retracement of its decline that began in mid-2014 and through a low set at the start of the year is found near $1.2165. Beyond there, potentially extends toward $1.25-$1.26. The technical indicators are constructive, and buying on dips is still the preferred strategy for trend followers and momentum traders. We expect new buying to emerge on pull backs into the $1.1960-$1.1980 area. |
EUR/USD with Technical Indicators, September 09(see more posts on Bollinger Bands, EUR/USD, MACDs Moving Average, RSI Relative Strength, Stochastics, )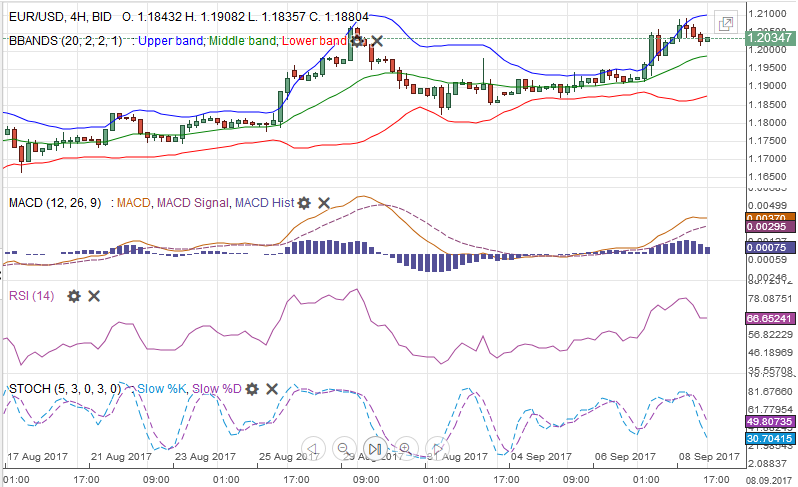 EUR/USD Week Ending September 09 with Technical Indicators - Click to enlarge |
USD/JPYThe dollar also fell to new lows for the year against the Japanese yen, where the pull from the decline in US yields was particularly pronounced, spurring the covering of the short yen positions. That said, the MOF reported that foreign investors were substantial buyers of Japanese bonds (JPY1.36 trillion) in the weekend ending September 1. This is the most in six years. We suspect that some fund managers underweight Japanese bonds due to the low yield were underperforming their benchmarks given the yen’s strength. We are still skeptical of the safe havenbuying consensus thesis. In the week ending September 1, the dollar did not sell off against the yen, which the safe haven thesis would have inferred from the buying of Japanese bonds, but appreciated 0.8% instead, the most in two months. With JPY108 finally yielding, the next technical objective we suggested was around JPY106.50. The technical indicators are consistent with this bearish view, but the dollar is well beyond the lower Bollinger Band (~JPY108.20). Indeed the greenback traded nearly three standard deviations below its 20-day moving average, an extreme not seen since early this year (and happened four times last year). |
USD/JPY with Technical Indicators, September 09(see more posts on Bollinger Bands, MACDs Moving Average, RSI Relative Strength, Stochastics, USD/JPY, )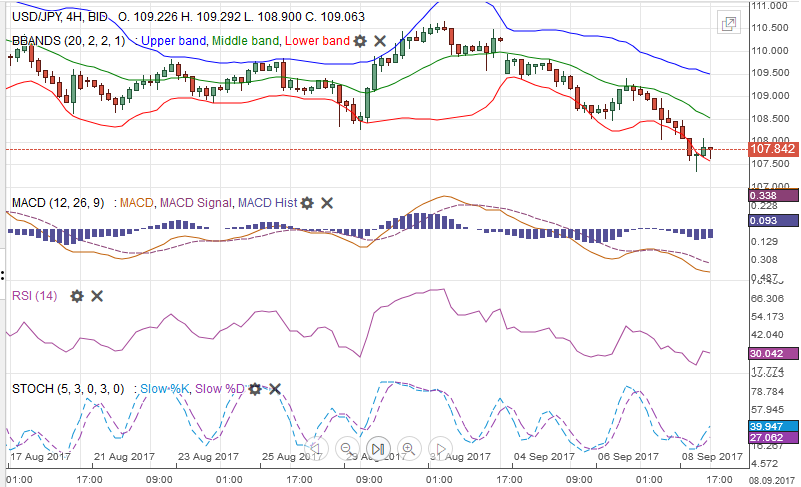 USD/JPY Week Ending September 09 with Technical Indicators - Click to enlarge |
GBP/USDSterling did not disappoint. Despite our skepticism about the UK Brexit strategy, we had recognized the improving technical tone for sterling over the past few weeks. Before the weekend it poked through $1.32 for the first time since early August. On the week, it gained almost 2%, which is its best performance here in Q3. The $1.32 area corresponded to the minimum measuring objective of small inverted head and shoulders pattern we had been tracking. Sterling’s gains seem to reflect the weak US dollar environment and what some see as the prospects for a softer Brexit. We suggest that the next key technical objective is near $1.3430, which represents a 50% retracement of the losses suffered since the referendum. The technical indicators are still constructive, though the Slow Stochastics may turn lower next week. Sterling has not only gone through the upper Bollinger Band, but it also flirted with three standard deviations from its 20-day moving average (~$1.3225). We would peg initial support near $1.3060. |
GBP/USD with Technical Indicators, September 09(see more posts on Bollinger Bands, GBP/USD, MACDs Moving Average, RSI Relative Strength, Stochastics, )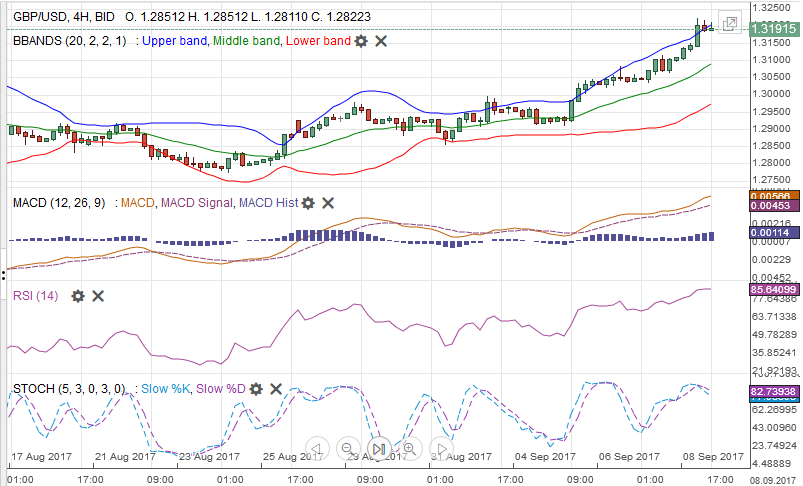 GBP/USD Week Ending September 09 with Technical Indicators - Click to enlarge |
AUD/USDThe Australian dollar reached its highest level since May 2015 near $0.8125 before the weekend. Near the highs, it was three standard deviations above its 20-day moving average. Other technical indicators are supportive. The next target is seen near $0.8160, the high from May 2015, which is also the 50% retracement of the sell-off since mid-2014 (when it traded $0.9500). Support is seen in the $0.7980-$0.8000 area. |
AUD/USD with Technical Indicators, September 09(see more posts on Australian Dollar, Bollinger Bands, MACDs Moving Average, RSI Relative Strength, Stochastics, )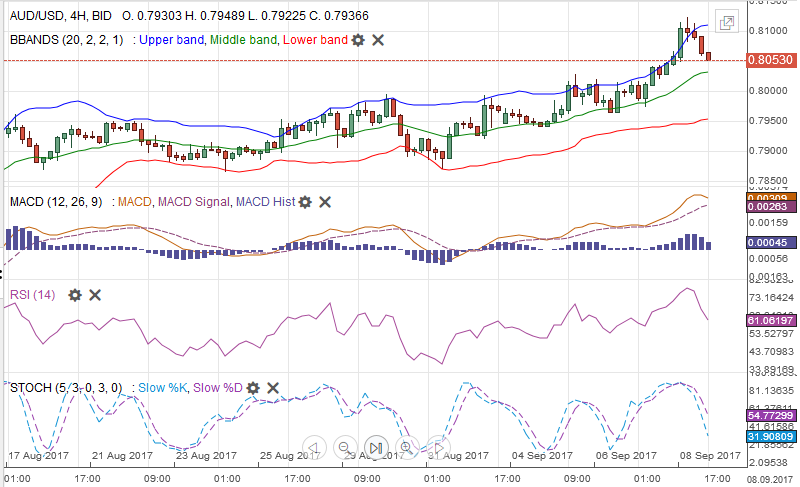 AUD/USD Week Ending September 09 with Technical Indicators - Click to enlarge |
USD/CADThe Canadian dollar had a great run last week, rising 2.0%, nearly matching the yen and Swiss franc’s strength. The Loonie was aided by the Bank of Canada rate hike that surprised many. It did not only lift rates, but seemed to keep the door open to more, though we suspect a hike in October, which would be the third hike in as many meetings, is too aggressive given the comments of the central bank and other macro considerations, like inflation, the exchange rate, household indebtedness and the housing market. The employment data was mixed before the weekend, but the report seems skewed by the youngest cohort returning to school. The US dollar approached CAD1.20. We expect this to hold in the near-term as the technical indicators are getting stretched. Housing data in the week ahead may also spur some caution. |
USD/CAD with Technical Indicators, September 09(see more posts on Bollinger Bands, Canadian Dollar, MACDs Moving Average, RSI Relative Strength, Stochastics, )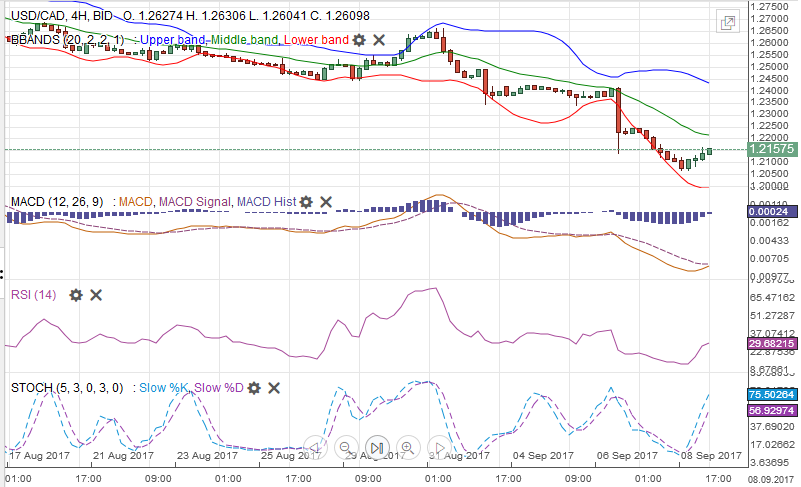 USD/CAD Week Ending September 09 with Technical Indicators - Click to enlarge |
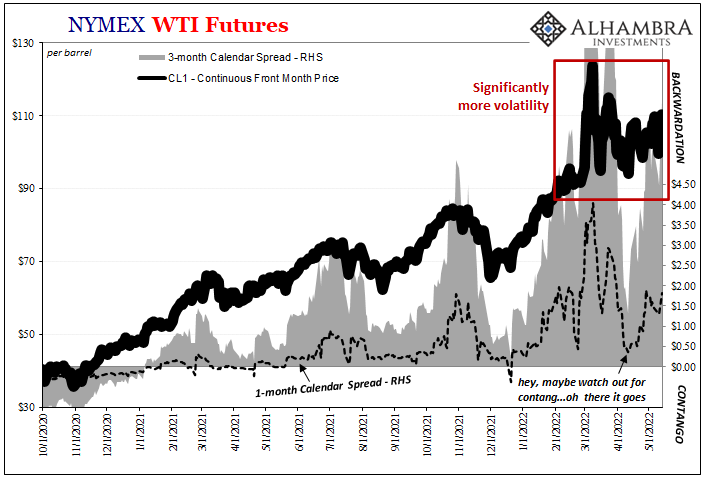
Crude OilLight sweet crude oil futures snapped a five-week losing streak with the October contract gaining 0.4%%. The contract traded at one-month highs, a little above $49, but the sharp drop of 3.2% before the weekend wiped out most of the earlier gains. Given the storms impact in the US, oil and gasoline have become a weather market, though we suspect that the fundamentals may be gradually improving. Initial support now is seen near $47, and a break would suggest a retest of last month’s low near $45.60. |
Crude Oil, September 2016 - September 2017(see more posts on Crude Oil, )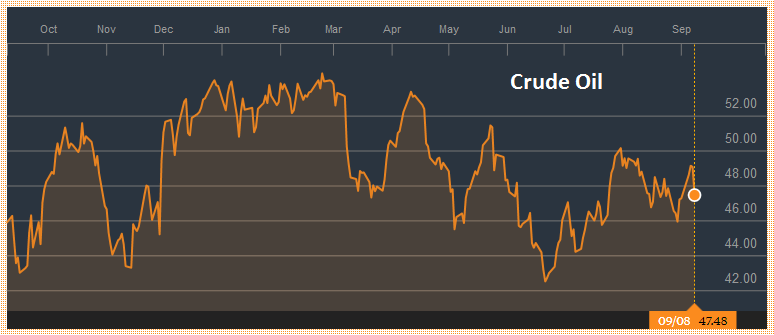 Source: Bloomberg.com - Click to enlarge |
U.S. TreasuriesUS yields fell further ahead of the weekend before firming a bit. The 10-year yield approached 2.0%, and the 2-year yield briefly traded below 1.25%, the upper end of the Fed funds range, which is also what the Fed pays on all reserves. The December 10-year note futures contract reached almost 128-00 before the weekend before reversing lower. Support is seen near 127-00, and the 20-day moving average, which it has not closed below since late July is found near 126-20. There appear to be some bearish divergences created when the technical indicators, such as the Slow Stochastics and RSI. Still, the market may be hesitant to pick a top ahead of the upcoming CPI report, where the core rate may have eased. |
Yield US Treasuries 10 years, September 2016 - September 2017(see more posts on U.S. Treasuries, ) Source: Bloomberg.com - Click to enlarge |
S&P 500 IndexThe S&P 500 gapped lower on September 5 and spent the rest of the week at the upper end of that day’s range, without entering the gap. The gap is found between 2472.0 and 2473.8. The technical indicators are not generating a robust signal. In the immediate term, a break of 2459 on the downside, or behavior around the gap will help clarify the technical picture. The Russell 1000 Value Index fell a little less than 1%, giving back the previous week’s gains. The Russell 1000 Growth Index eased about 0.4%, which surrendered a small part of the previous week’s 2.1% gain. |
S&P 500 Index, September 09(see more posts on S&P 500 Index, )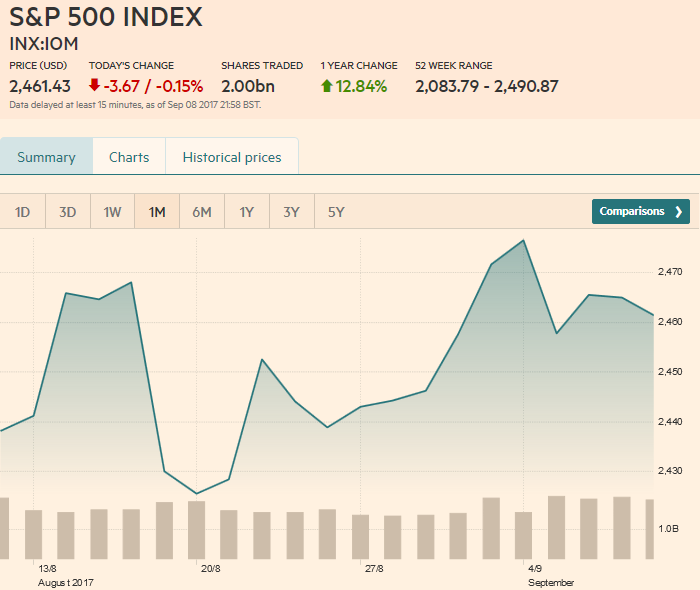 Source: markets.ft.com - Click to enlarge |
Are you the author?
Tags: Australian Dollar,Bollinger Bands,British Pound,Canadian Dollar,Crude Oil,EUR/CHF,EUR/USD,Euro,Euro Dollar,GBP/USD,Japanese yen,MACDs Moving Average,newslettersent,RSI Relative Strength,S&P 500 Index,Stochastics,Swiss Franc Index,U.S. Dollar Index,U.S. Treasuries,usd-jpy,USD/CHF,USD/JPY