Marc Chandler
My articles My offerMy siteAbout meMy videosMy books
Follow on:LinkedINTwitterSeeking AlphaAmazon
Swiss FrancThe Euro has fallen by 0.28% to 1.1393 CHF. |
EUR/CHF and USD/CHF, September 08(see more posts on EUR/CHF, USD/CHF, )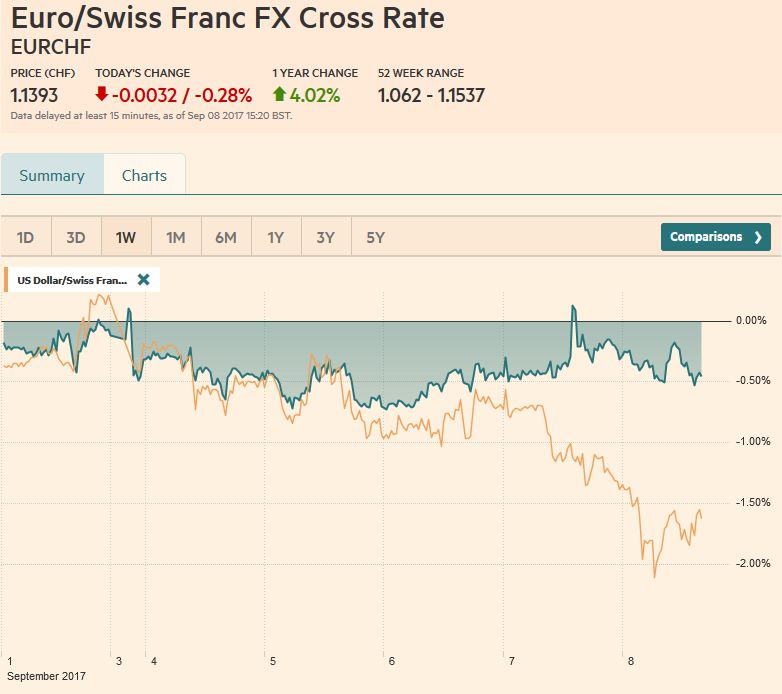 Source: markets.ft.com - Click to enlarge |
FX RatesThe US dollar has been unable to find any traction as US yields continue to move lower. The US 10-year year is slipping below 2.03% in European turnover, the lowest level in ten months. The risk, as we have noted, is that without prospects of stronger growth and inflation impulses, the yield returns to where was before the US election (~1.85%). The two-year note yield, anchored more by Fed policy than the long-end, is also soft. It yielded 1.25% today, the same as the upper end of the Fed funds target range, and the rate that the Federal Reserve pays on all bank reserves (not just excess reserves). Moreover, the developments over the past 24 hours suggest that the divergence theme between the US and Europe remains intact. Although Draghi indicated the level of concern about the euro has increased since July (something that a few members cited in then compared to “most” now), he also signaled a gradual process of “calibrating” the adjustment of the program (within current parameters). The euro neared $1.2100 in late Asian turnover but is trading a bit heavier in Europe, but it has mostly remained above levels seen at the end of the North American session yesterday. There is a 585 mln euro option struck at $1.2050 that may be in place. The $1.2165 area corresponds to a 50% retracement of the euro’s slide that began in mid-2014. Above there, and some are already forecasting it, a move toward $1.25-$1.26. |
FX Daily Rates, September 08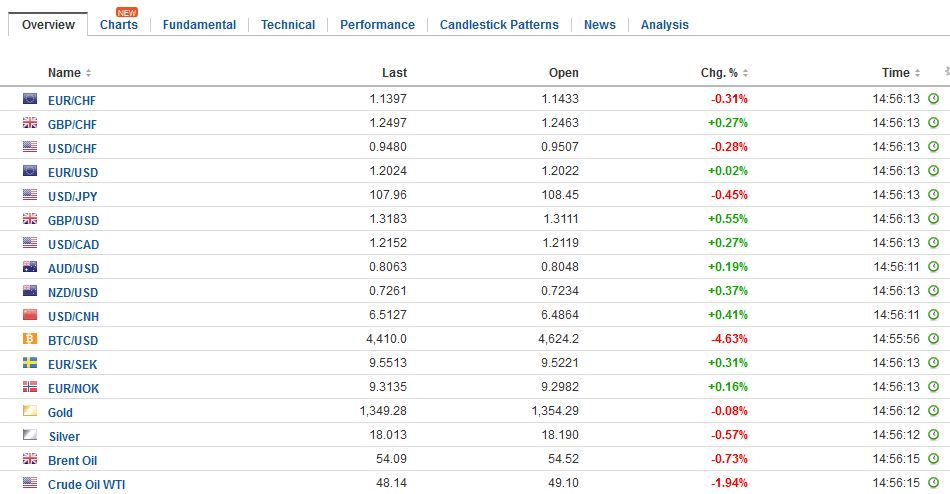 - Click to enlarge |
| Note that Draghi indicated that the euro had averaged around $1.18 when the staff made its forecasts. The euro’s continued appreciation will impact the next set of forecasts. At the same time, it appears that the staff forecast changes were less than one would have thought based on the pass-through from the currency strength.
Whereas the euro strengthened despite the prospects for continued divergence, the yen has extended its gains despite a sharper than expected downward revision in Q2 GDP. The revision is from spectacular growth (1% quarter-over-quarter) to solid (0.6%). The culprit was a business investment. It was revised to 0.5% from the initial 2.4%. Consumption was shaved to 0.8% from 0.9%. Part of these drags was blunted by an increase in public investment (6.0% vs. 5.1%). The GDP deflator remained at minus 0.4%. Sterling has continued to advance. Yesterday it closed above the 61.8% retracement of the pullback since the August 3 high near $1.3265. That retracement (~$1.3080) is now supported. We suggested the move above $1.3020 earlier in the week generated a technical signal suggesting a near-term move toward $1.3200., but long-term, the $1.3430 area,may need to be tested. It is the 50% retracement of the decline since the referendum. The dollar fell 1.5% against the yuan this week. The dollar has not fallen 1% of more against the yuan in over a decade, and now it has done it for two weeks back-to-back. It is the third consecutive weekly decline. In fact, here in Q3, the yuan has only fallen in two weeks. The US dollar bottomed against the yuan in early 2014 near CNY6.04. It peaked at the end of last year near CNY6.9650. It shot through CNY6.50 this week, which is 50% marker. The 61.8% retracement objective is seen by CNY6.39. |
FX Performance, September 08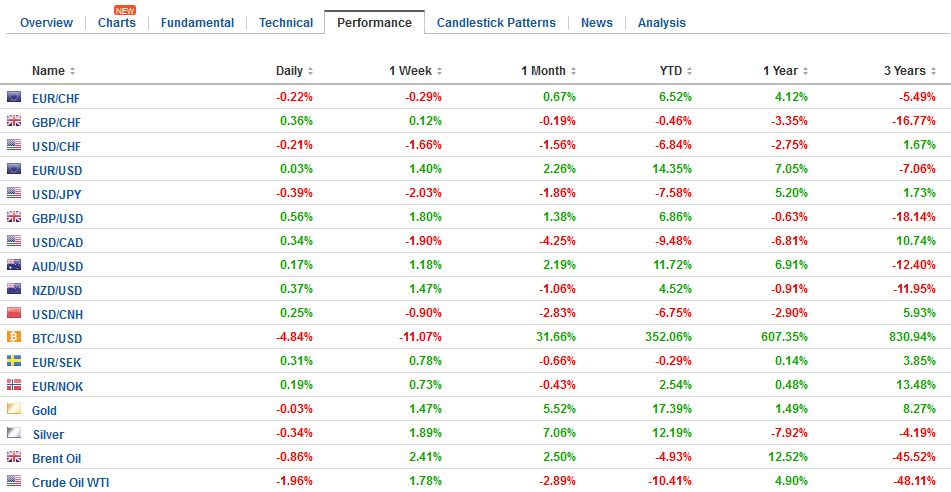 - Click to enlarge |
United KingdomToday’s UK industrial production figures for July were largely in line with expectations with a 0.2% monthly advance. Within industrial output, manufacturing was a bright spot. It rose 0.5% after a flat June reading. Construction output was considerably weaker than expected (-0.9% vs. median guesstimate of -0.2%). It is the fourth consecutive monthly decline. |
U.K. Industrial Production YoY, Jul 2017(see more posts on U.K. Industrial Production, )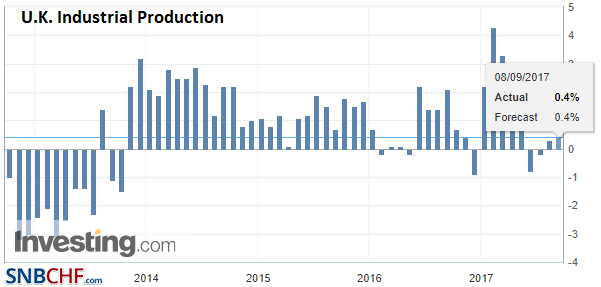 Source: Investing.com - Click to enlarge |
| Separately, the UK reported a somewhat smaller trade deficit, but much of the improvement was due to revisions to the June series. |
U.K. Trade Balance, Jul 2017(see more posts on U.K. Trade Balance, )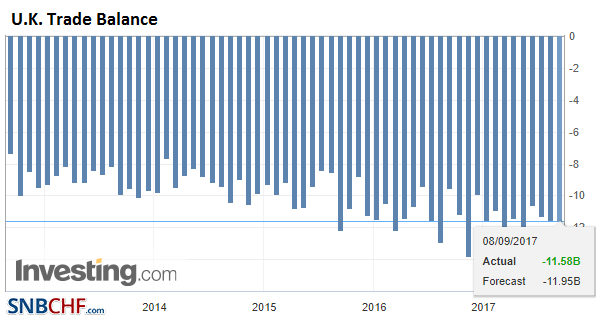 Source: Investing.com - Click to enlarge |
ChinaChina reported August trade figures. Exports were less robust and imports more, leading to a narrower trade surplus. Export growth slowed to 5.5% from 7.2% (expectations ~6.0%). |
China Exports YoY, Aug 2017(see more posts on China Exports, )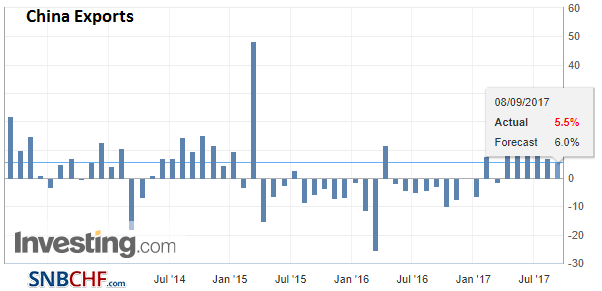 Source: Investing.com - Click to enlarge |
| Imports accelerated to 13.3% from 11.0% (expectations ~10%). |
China Imports YoY, Aug 2017(see more posts on China Imports, )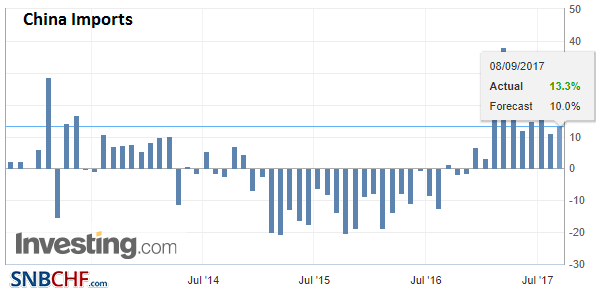 Source: Investing.com - Click to enlarge |
| The trade surplus fell to $42 bln from $46.7 bln. Exports to the US are up 8.4% from a year ago to $39.2 bln. Its bilateral trade surplus of $26.2 bln is the largest in two years. |
China Trade Balance (USD), Aug 2017(see more posts on China Trade Balance, )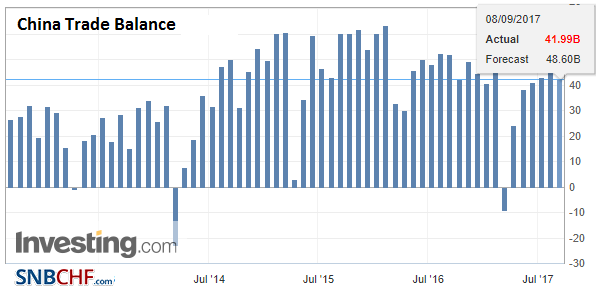 Source: Investing.com - Click to enlarge |
Japan |
Japan Gross Domestic Product (GDP) YoY, Q3 2017(see more posts on Japan Gross Domestic Product, )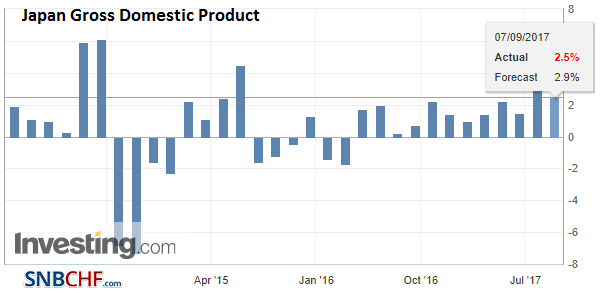 Source: Investing.com - Click to enlarge |
Germany |
Germany Trade Balance, Jul 2017(see more posts on Germany Trade Balance, )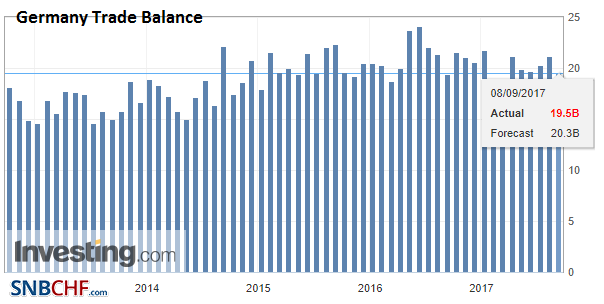 Source: Investing.com - Click to enlarge |
France |
France Industrial Production, Jul 2017(see more posts on France Industrial Production, )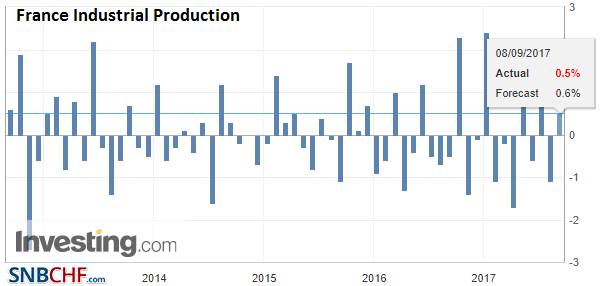 Source: Investing.com - Click to enlarge |
Spain |
Spain Industrial Production YoY, Jul 2017(see more posts on Spain Industrial Production, )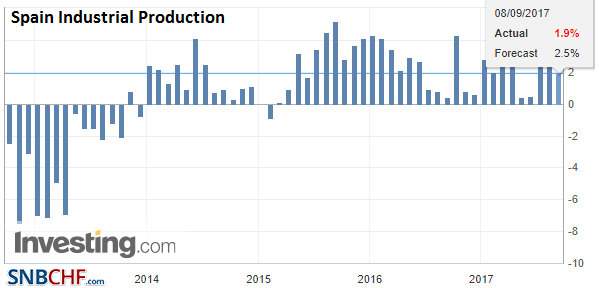 Source: Investing.com - Click to enlarge |
Canada |
Canada Participation Rate, Aug 2017(see more posts on Canada Participation Rate, )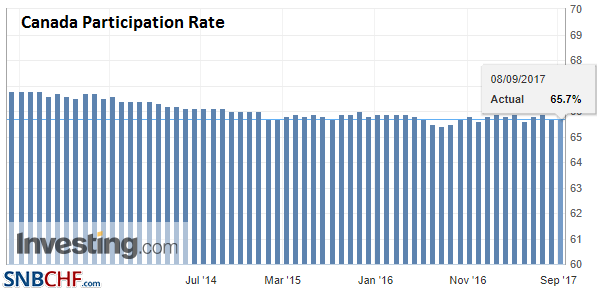 Source: Investing.com - Click to enlarge |
At the same time, comments from Fed officials this week, ahead of the blackout period in front of the FOMC meeting, the consensus appears to remain intact to begin allowing the Fed’s balance sheet to be shrinking. The process will also begin slowly ($10 bln a month), but in Q3 18, this will have been gradually ratcheted up to $40 bln a month. The ECB’s balance sheet may still be expanding.
The decline in US yields seems to explain the bulk of the dollar’s drop against the yen. It has broken through JPY108 for the first time since last November. We have suggested that a break of JPY108 would set up a test on the JPY106.50 area. This still seems reasonable, especially if the US 10-year falls below 2.0%. The geopolitical uncertainty, with fears that North Kora may have another missile launch over the weekend, may be a short-term factor, discouraging much of a short-covering dollar bounce in North America today.
Are you the author?Tags: #GBP,#USD,$EUR,$JPY,Canada Participation Rate,China Exports,China Imports,China Trade Balance,EUR/CHF,France Industrial Production,Germany Trade Balance,Japan Gross Domestic Product,newslettersent,Spain Industrial Production,U.K. Industrial Production,U.K. Trade Balance,USD/CHF,yields