George Dorgan
My articles My siteAbout meMy videosMy books
Follow on:LinkedINTwitterSeeking Alpha
CFA SocietyEconomicBlogs
Swiss Franc vs USD and EURA virus has spread across the markets as the first half drew to a close. Many investors have become giddy. The low vol environment was punctuated by ideas that peak in monetary accommodation is past and that the gradual process of normalization is beginning. Some investors may be exaggerating how soon the Bank of England and the European Central Bank will raise interest rates, but there seems to be little doubt about the direction of policy going forward.
It is not just the ECB and BOE. The Bank of Canada meets on July 12, and the market is pricing in around a 75% chance of a hike. The Reserve Bank of Australia and Sweden’s Riksbank meets in the week ahead, and they too will likely embrace the prospects of normalization. Ironically, it is only the US, which has seen core CPI and core PCE move lower for four consecutive months that the market doubts. Using either the Fed funds futures or the OIS market, it appears that less than a 50% chance of hike before the end of the year is discounted. |
EUR/CHF and USD/CHF, July 01(see more posts on EUR/CHF, USD/CHF, )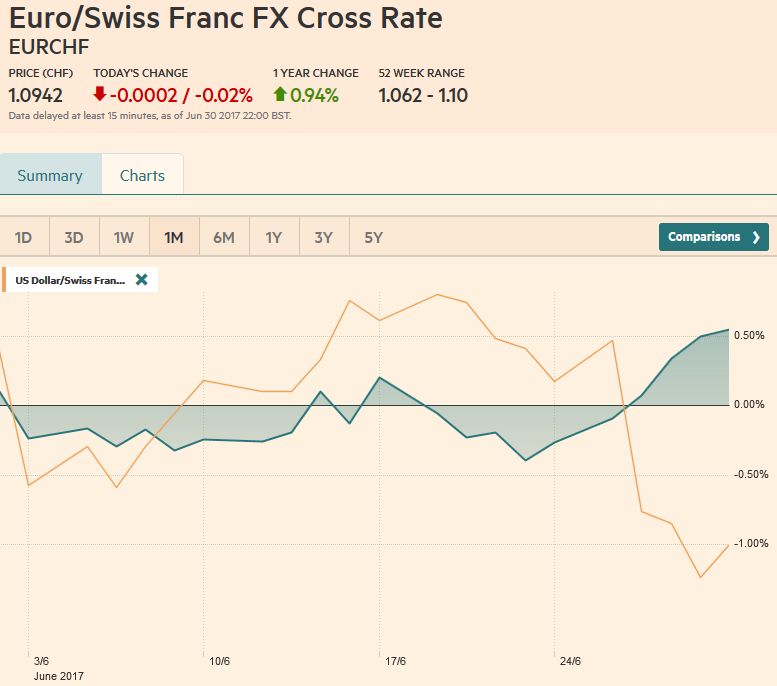 Source: markets.ft.com - Click to enlarge |
Swiss Franc Currency Index (3 years)The Swiss Franc index is the trade-weighted currency performance (see the currency basket)On a three years interval, the Swiss Franc had a weak performance. The dollar index was far stronger. The dollar makes up 33% of the SNB portfolio and 25% of Swiss exports (incl. countries like China or Arab countries that use the dollar for exchanges). Contrary to popular believe, the CHF index gained only 1.73% in 2015. It lost 9.52% in 2014, when the dollar (and yuan) strongly improved. |
Swiss Franc Currency Index (3 years), July 01(see more posts on Swiss Franc Index, )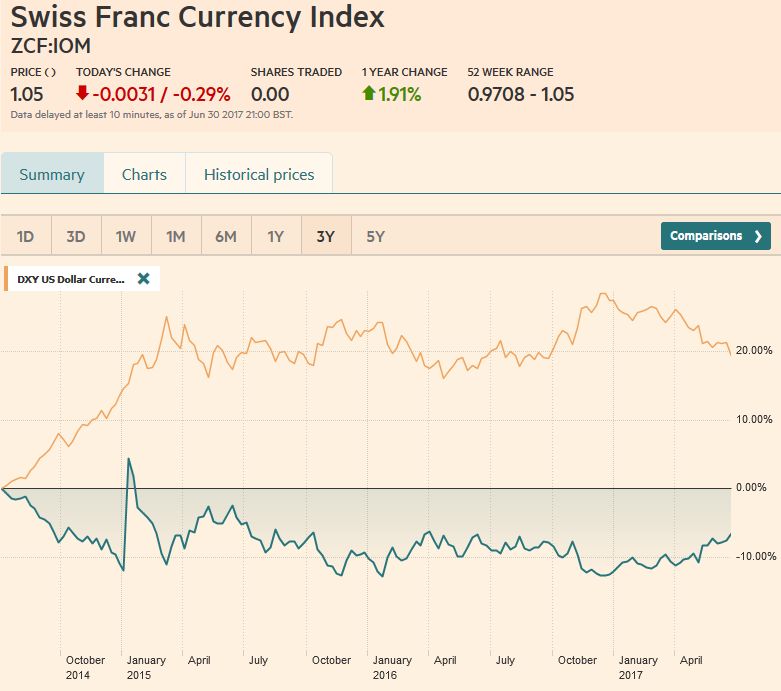 Source: markets.ft.com - Click to enlarge |
Marc Chandler My articles My offerMy siteAbout meMy videosMy books Follow on:LinkedINTwitterSeeking AlphaAmazon USD/CHF |
US Dollar/Swiss Franc FX Spot Rate, July 01(see more posts on USD/CHF, )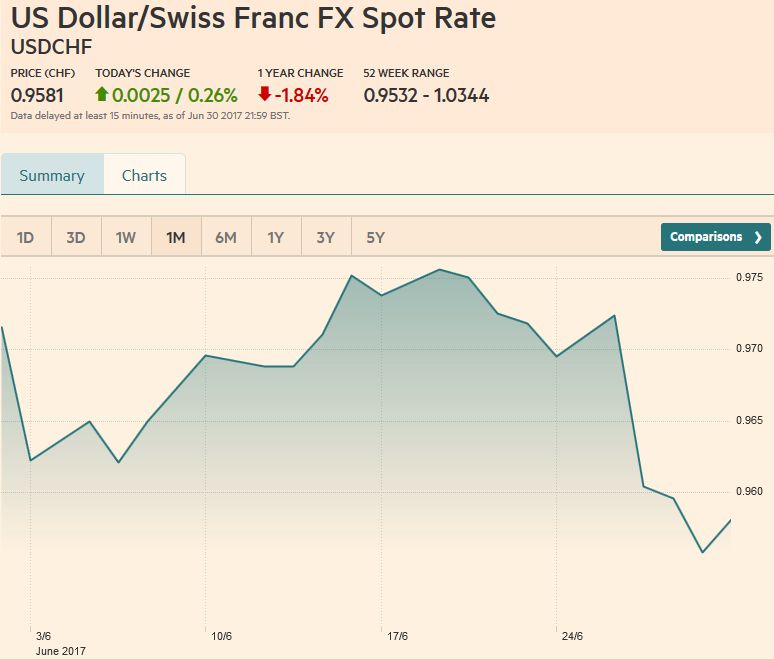 Source: markets.ft.com - Click to enlarge |
US Dollar IndexThe Dollar Index slumped 1.6% in the last week of June. This offsets the minor gains it had recorded earlier in the month. The 1..3% decline for the month is the fourth consecutive losing month since the December 2010-April 2011 period. The 4.7% loss in Q2 is the largest since Q3 10. Although it is below its lower Bollinger Band (95.73), the other technical indicators are not over-extended, nor showing divergences. The next target is near 94.30. Below there, chart support ahead of last year’s low a little below 92.00 is sparse. |
US Dollar Currency Index, July 01(see more posts on U.S. Dollar Index, )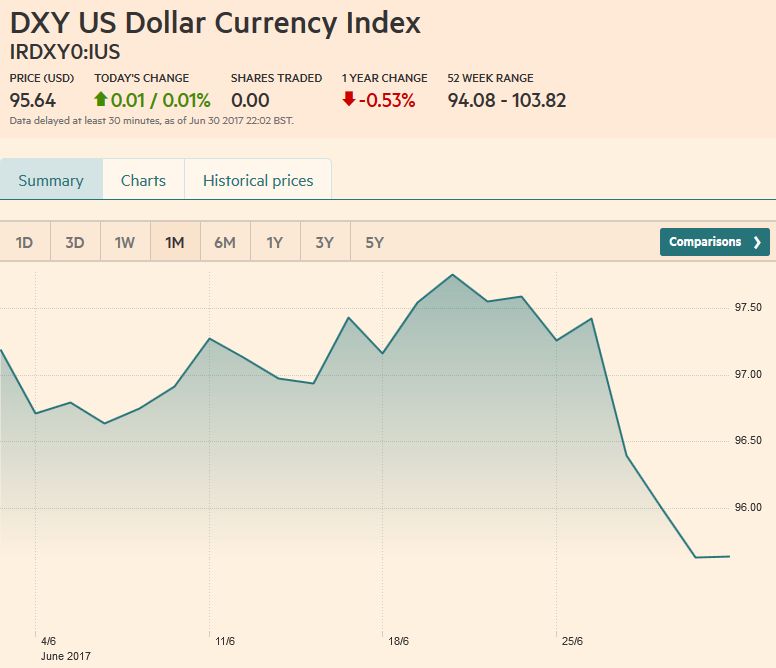 Source: markets.ft.com - Click to enlarge |
EUR/USDThe euro broke out of the $1.11-$1.13 range, which we suggested, points to a test on $1.15 and then last year’s high near $1.1615. The 2015 high was recorded near $1.1715. We note that the $1.1735 area also corresponds to a 38.2% retracement of the euro’s decline from May 2014 (~$1.40) to the low at the start of the year (~$1.0340). |
EUR/USD with Technical Indicators, July 01(see more posts on Bollinger Bands, EUR/USD, MACDs Moving Average, RSI Relative Strength, Stochastics, )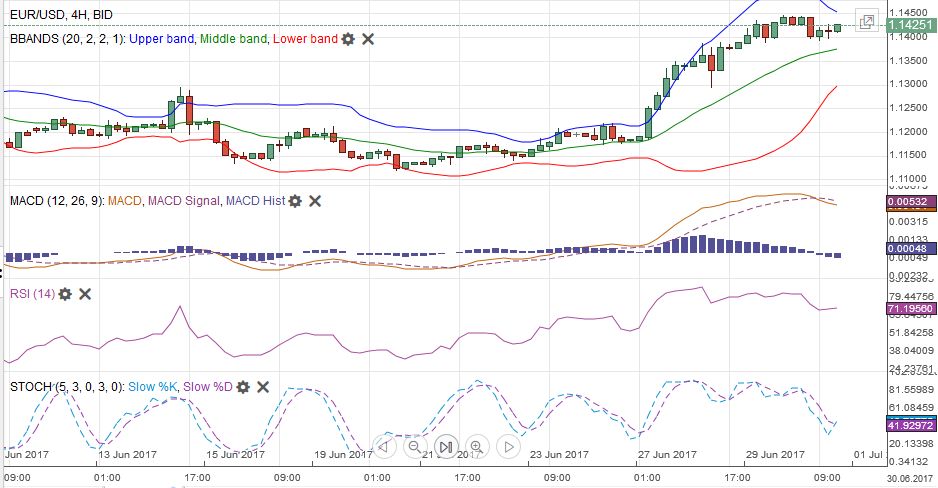 EUR/USD Week Ending July 01 with Technical Indicators - Click to enlarge |
USD/JPYThe BOJ is the other exception. It has refrained from discussing an exit strategy. Its core inflation rose 0.4% in May. The target is 2%. The core rate includes energy. If energy is excluded as well, prices in Japan are flat year-over-year, while overall household spending contracted for 15-months year-over-year through May. With the collective wisdom of the markets judging the Fed and BOJ will lag behind the other central banks in the period ahead, the dollar and yen were the poorest performing major currencies last week and for the month of June. The dollar stalled against the yen after approaching JPY113.00. A small shelf has been built around JPY111.80, which is also where the 200-day moving average is found. Technical indicators warn that the dollar’s upside may become more difficult. The 100-day moving average (~JPY111.20) is an obvious target, below which lies a band of support in the JPY110.40-JPY110.80.
|
USD/JPY with Technical Indicators, July 01(see more posts on Bollinger Bands, MACDs Moving Average, RSI Relative Strength, Stochastics, USD/JPY, )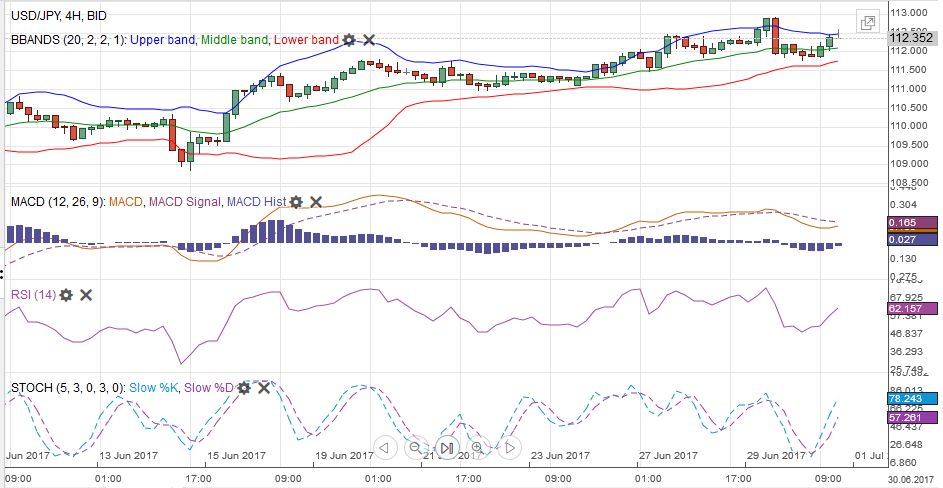 USD/JPY Week Ending July 01 with Technical Indicators - Click to enlarge |
GBP/USDThe prospects of the BOE removing accommodation, which it began with the raising the capital buffer, sent sterling for seven consecutive sessions through June 20 before profit-taking was seen after sterling approached the high for the year above $1.30. Technical indicators are still supportive. The $1.3055 area represents the 38.2% retracement of sterling fall from the referendum high of $1.50. If this area is convincingly taken out, there is not much on the charts before $1.3400. |
GBP/USD with Technical Indicators, July 01(see more posts on Bollinger Bands, GBP/USD, MACDs Moving Average, RSI Relative Strength, Stochastics, )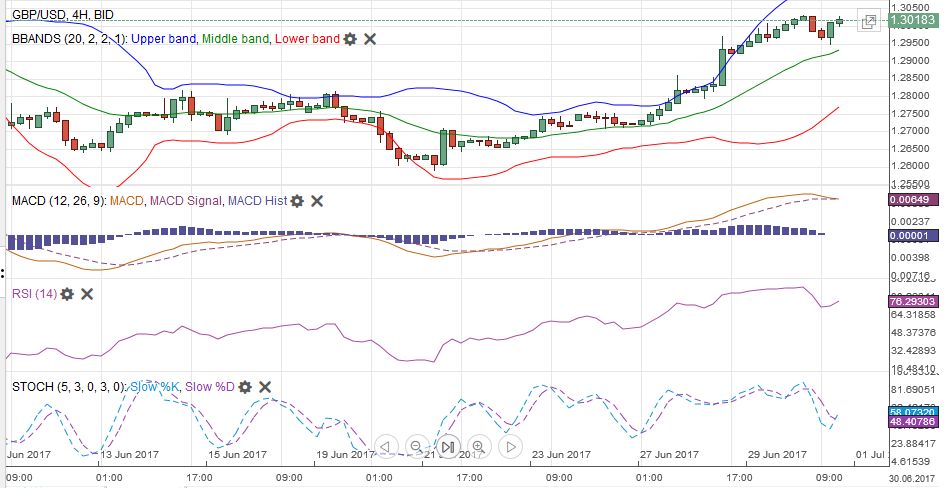 GBP/USD Week Ending July 01 with Technical Indicators - Click to enlarge |
USD/CADOf the various central banks that investors are thinking are preparing to normalize policy, the Bank of Canada strikes us as the most credible. The Bank of Canada has prepared the markets. The recovery of the Senior Loan Officer survey after a couple of quarters of weakness seems to be the last key piece to fall into place. On July 7, Canada reports its June jobs data. Given the recent strength of the labor market, including rising wages, it will take a significant downside shock to deter the rate hike. The technical indicators are getting stretched, but there is no divergence at hand. As the US dollar has fallen to new nine-month lows, it has built a head of steam. It fell every session in the last week of June for more than a 2% decline and a nearly 4% decline for the month. The next major support area is seen in the CAD1.2760 area. A move above CAD1.3050 would be the first sign of consolidative/corrective phase. |
USD/CAD with Technical Indicators, July 01(see more posts on Bollinger Bands, Canadian Dollar, MACDs Moving Average, RSI Relative Strength, Stochastics, )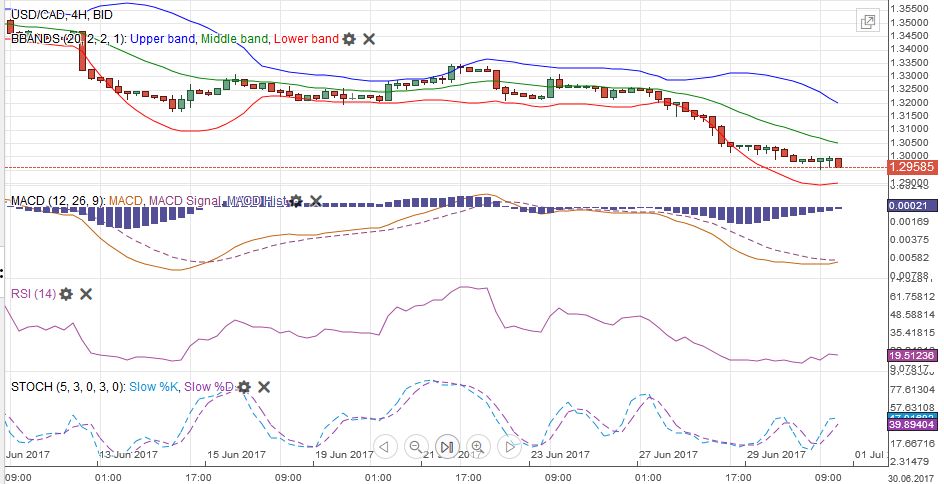 USD/CAD Week Ending July 01 with Technical Indicators - Click to enlarge |
AUD/USDThe Australian dollar culminated its recent rally by poking through $0.7700 briefly before the weekend. It reached its best level in three months. The Reserve Bank of Australia meets in early July, and although it is unlikely to change rates, it is likely to dampen lingering ideas that a rate cut may still be delivered.The central bank may not like the currency appreciation, but on a trade-weighted basis, it is several percentage points lower than it was the last time it was around $0.7700. Also with iron ore prices rallying 20% over the past couple of weeks, the terms of trade have improved. Initial support is seen in the $0.7620-$0.7640 area. |
AUD/USD with Technical Indicators, July 01(see more posts on Australian Dollar, Bollinger Bands, MACDs Moving Average, RSI Relative Strength, Stochastics, )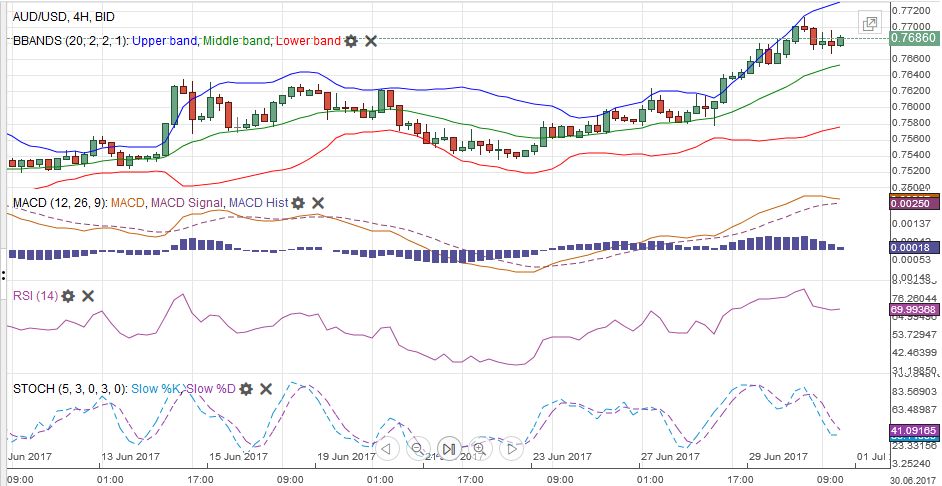 AUD/USD Week Ending July 01 with Technical Indicators - Click to enlarge |
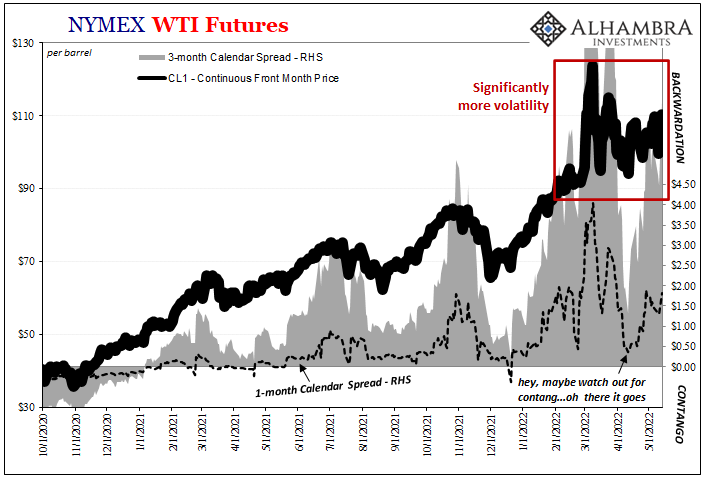
Crude OilOil prices rose every day last week, extending its advance to seven consecutive sessions, the longest such streak since last September-October. The rally has approached the 38.2% retracement of the sharp decline (~$46 basis the August futures contract). The technical tone looks constructive and there is near-term potential into the $47-$48 band. Support now is seen near $44.50. |
Crude Oil, June 2016 - June 2017(see more posts on Crude Oil, )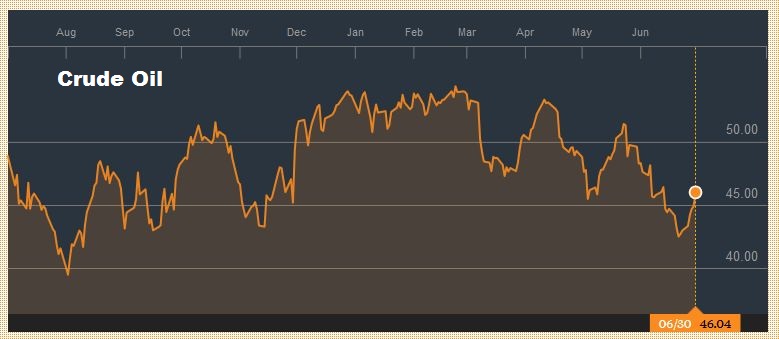 . |
U.S. TreasuriesThe taper tantrum sparked in Europe managed to do for US yields what economic data and the Federal Reserve were unable to do–steepen the yield curve. The two-year yield rose three basis points in the last week of June, while the 10-year yield rose 17 bp. The backing up of the long-end was the most in a week since the first week in March. The yield has entered the 2.30%-2.35% band that may take some time to work through the supply. The September note futures peaked on June 14 and spent the second half of the month moving lower, effectively unwinding what it had gained in the first couple of weeks of June. The 125-08-125-15 area houses retracement objectives and other chart points. Bearish divergences in the technical indicators and the extreme market positioning provides scope for additional declines in prices (higher yields). |
Yield US Treasuries 10 years, June 2016 - June 2017(see more posts on U.S. Treasuries, )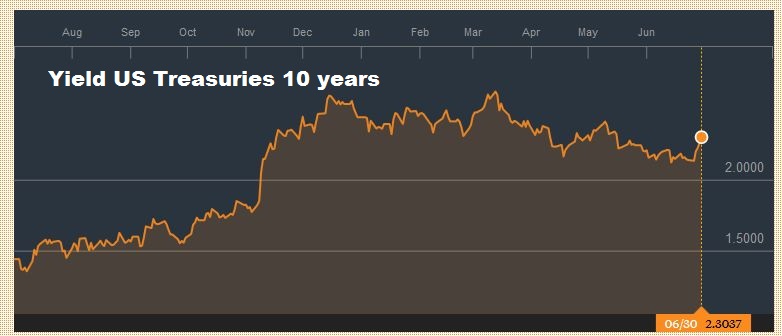 Source: bloomberg.com - Click to enlarge |
S&P 500 IndexAlthough the S&P 500 had a difficult week, having to cope with the rise in yields and the failure of the Senate to pass healthcare reform, which raises questions about the broader economic agenda, it managed to close higher on the month. It is the seventh monthly gain over the past eight months. It is the seventh consecutive quarterly advance. In fact, since the beginning of 2013, there have only been two quarterly declines in the S&P 500 (Q2-Q3 15). Many investors still seem inclined to buy pullbacks. A break of 2400, though, would be a test of this sentiment. Over the past week, the Russell 1000 Growth Index (RLG) fell 1.5%, while the Russell 1000 Value Index (RLV) rose 0.35%. On the month, RLG fell 0.4%, snapping a seven-month advance, while the RLV rose 1.5%, breaking a three-month down draft. |
S&P 500 Index, July 01(see more posts on S&P 500 Index, ) Source: markets.ft.com - Click to enlarge |
Are you the author?
Tags: Australian Dollar,Bollinger Bands,British Pound,Canadian Dollar,Crude Oil,EUR/CHF,EUR/USD,Euro,Euro Dollar,GBP/USD,Japanese yen,MACDs Moving Average,newslettersent,RSI Relative Strength,S&P 500 Index,Stochastics,Swiss Franc Index,U.S. Dollar Index,U.S. Treasuries,usd-jpy,USD/CHF,USD/JPY