George Dorgan
My articles My siteAbout meMy videosMy books
Follow on:LinkedINTwitterSeeking Alpha
CFA SocietyEconomicBlogs
Swiss Franc vs USD and EURThe ECB appears to be preparing investors for a further adjustment of its risk assessment and a reduction of its asset purchases as they are extended into next year. This assessment has marked a new phase of an appreciating EUR/CHF rate. It followed the previous phase, the one with and after the French elections. We see a strong euro only until the end of the year. At that moment, weaker oil prices will lead to a low European head inflation rate and a more dovish central bank. In the month of June and early July the franc lost 1% against the euro and had little gains versus the dollar. |
EUR/CHF and USD/CHF, July 08(see more posts on EUR/CHF, USD/CHF, )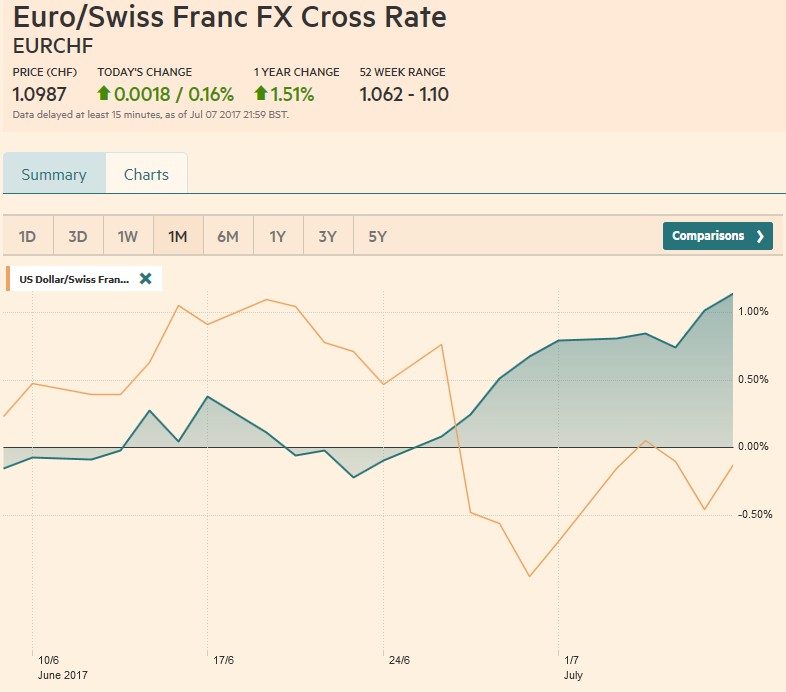 Source: markets.ft.com - Click to enlarge |
Swiss Franc Currency Index (3 years)The Swiss Franc index is the trade-weighted currency performance (see the currency basket)On a three years interval, the Swiss Franc had a weak performance. The dollar index was far stronger. The dollar makes up 33% of the SNB portfolio and 25% of Swiss exports (incl. countries like China or Arab countries that use the dollar for exchanges). Contrary to popular believe, the CHF index gained only 1.73% in 2015. It lost 9.52% in 2014, when the dollar (and yuan) strongly improved. |
Swiss Franc Currency Index (3 years), July 08(see more posts on Swiss Franc Index, )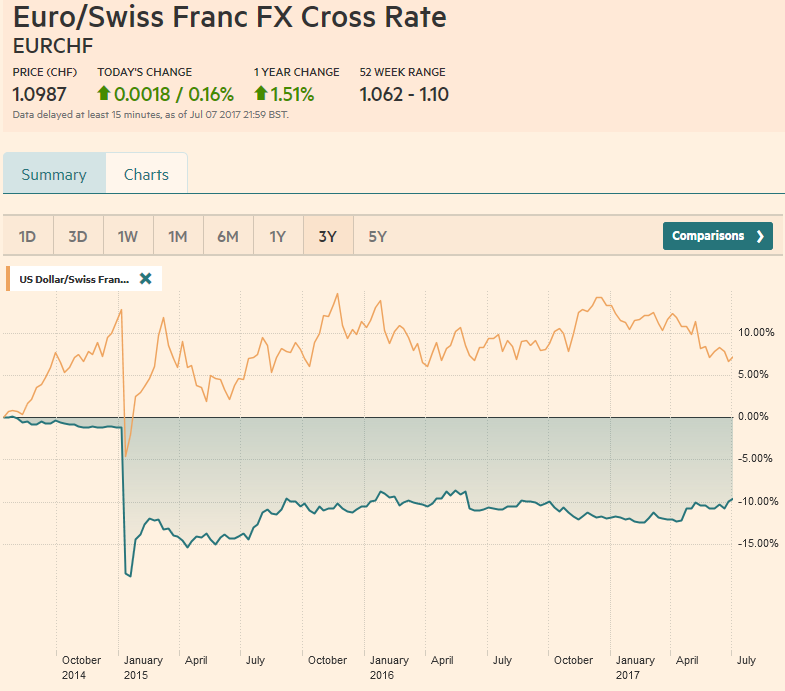 Source: markets.ft.com - Click to enlarge |
Marc Chandler My articles My offerMy siteAbout meMy videosMy books Follow on:LinkedINTwitterSeeking AlphaAmazon USD/CHFThe US employment data underscores the resilience of the US economy. Given the Fed’s commitment to the Phillip’s Curve, the robust jobs growth is sufficient to keep the faith that inflation will rise over time. Yellen can be expected to underscore this in her semi-annual testimony to Congress in the week ahead. The threat that the Bank of England can move more accommodation that it preemptively provided after last year’s referendum has been undermined by poor economic data.
|
US Dollar/Swiss Franc FX Spot Rate, July 08(see more posts on USD/CHF, )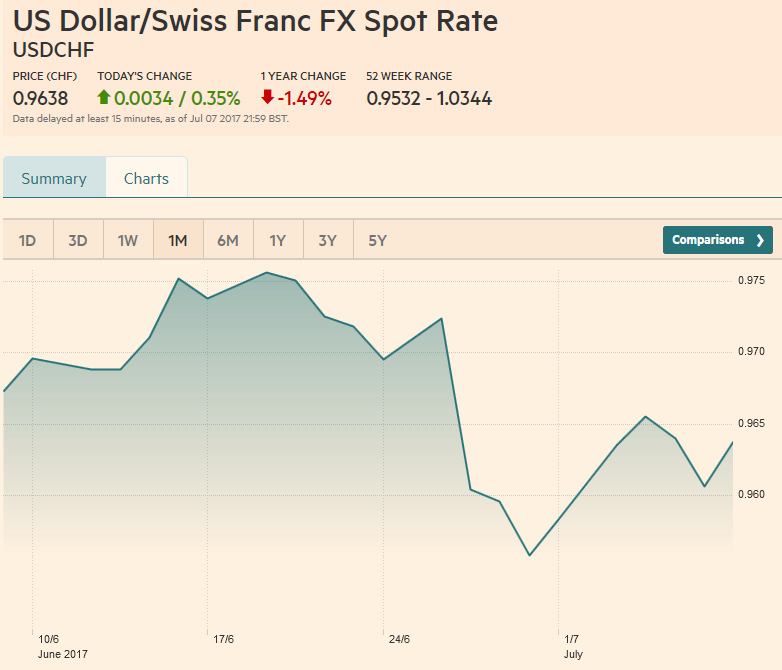 Source: markets.ft.com - Click to enlarge |
US Dollar IndexSince the beginning of May, the Dollar Index has alternated between gains and losses, The modest gain in the first week in July keeps the saw-tooth pattern intact. Although the Dollar Index rose around 0.5%, it did not rise above any important resistance levels or retracement objectives. Nevertheless, the technical indicators are constructive, suggest that the Dollar Index could string together two consecutive weekly gains for the first time since late March/early April. A move above 96.50-96.75 is needed to boost confidence that a low of some import is in place. On the downside, a break of 96.15 may be an early warning that new lows will likely be seen, |
US Dollar Currency Index, July 08(see more posts on U.S. Dollar Index, )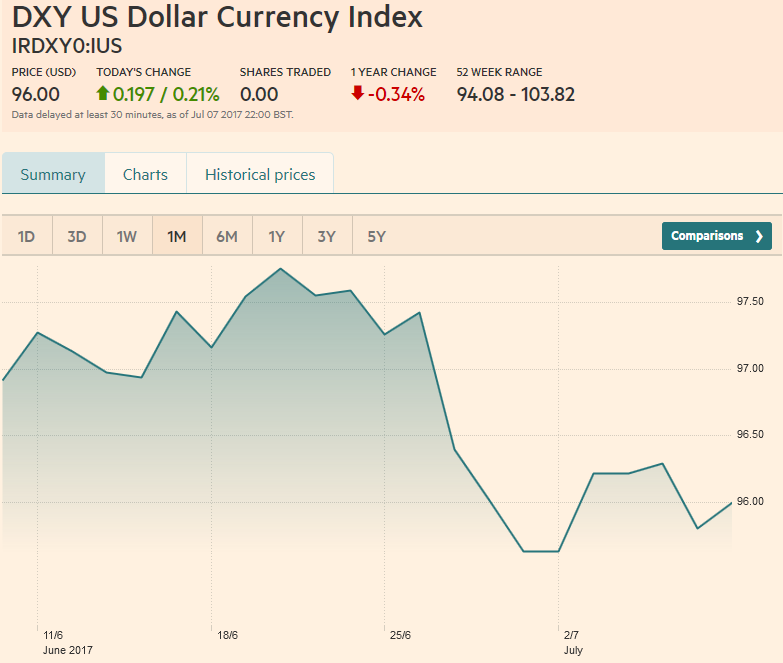 Source: markets.ft.com - Click to enlarge |
EUR/USDFor its part, the BOJ is content to lag behind the other central banks and resist the upward pressure on long-term interest rates. Ahead of the US jobs data, the sharp backing up of European interest rates sent the euro to retest high from the end of June which was also the high for the year ($1.1445). The technical indicators favor additional near-term losses, but unless the $1.1320 area yields, it will appear to be a flat consolidation rather than a correction. Initial support is seen near $1.1360. A three-month trendline support comes in near $1.1245 at the end of the week ahead. The 2016 high was set near $1.1615, and the 2015 high was a cent higher |
EUR/USD with Technical Indicators, July 08(see more posts on Bollinger Bands, EUR/USD, MACDs Moving Average, RSI Relative Strength, Stochastics, )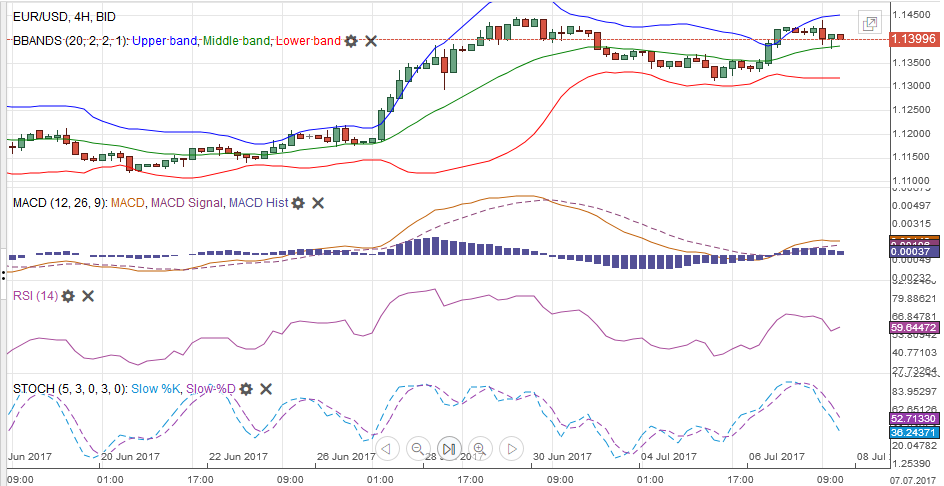 EUR/USD Week Ending July 08 with Technical Indicators - Click to enlarge |
USD/JPYThe dollar rose against the yen for the fourth consecutive week and reached its best since mid-May. Over this run, the greenback gained about 3.2%. At the start of the week, maybe in partial reaction to the LDP’s dramatic loss in the Tokyo election, the dollar was bid through a downtrend line drawn off the January, May, and June highs. It was found near JPY112.75. May’s highs near JPY114.35 and the JPY114.60 (61.8% retracement objective of this year’s decline) are the next hurdles.
|
USD/JPY with Technical Indicators, July 08(see more posts on Bollinger Bands, MACDs Moving Average, RSI Relative Strength, Stochastics, USD/JPY, )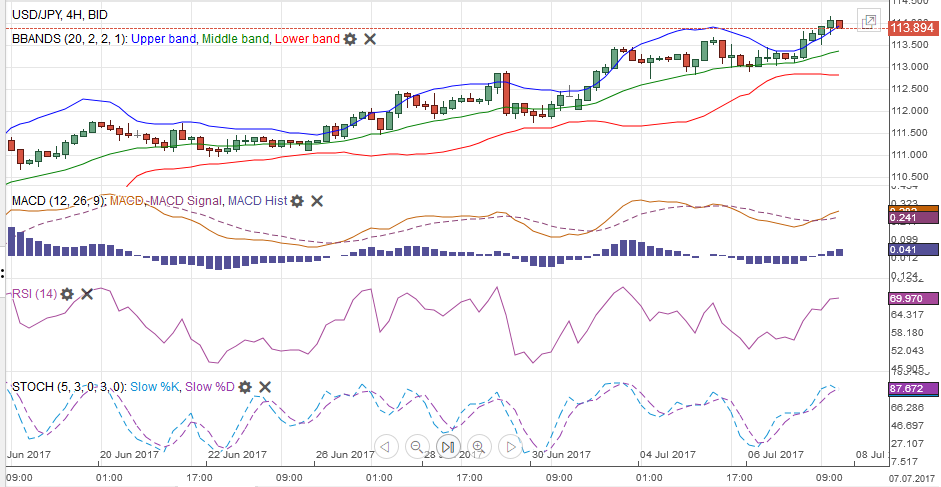 USD/JPY Week Ending July 08 with Technical Indicators - Click to enlarge |
GBP/USDSimilar to the euro, sterling approached the year high and faltered. Sterling’s high for the year was recorded in mid-May near $1.3050, meeting the 38.2% retracement objective of the losses since the $1.50 level was seen on the day of last year’s referendum. Sterling finished on its lows for the week, and the technical indicators warn that additional losses are likely next week.
The next important economic report (July 12) is the employment data, for which average weekly earnings are likely to have slowed. Sterling approached $1.2860 and a break signal a test on $1.28. A loss of $1.2760 would bolster confidence that a sterling peak is in place.
|
GBP/USD with Technical Indicators, July 08(see more posts on Bollinger Bands, GBP/USD, MACDs Moving Average, RSI Relative Strength, Stochastics, )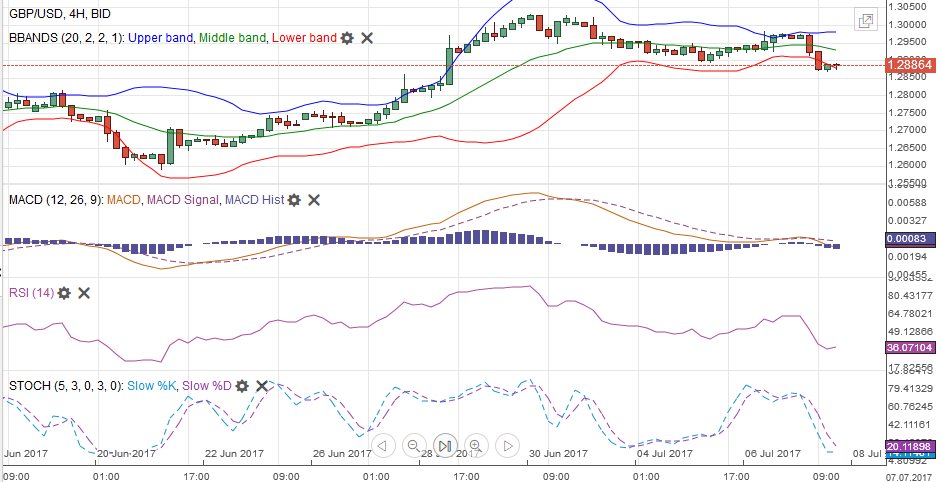 GBP/USD Week Ending July 08 with Technical Indicators - Click to enlarge |
USD/CADSince the beginning of May, the Canadian dollar has been the strongest of the major currencies, appreciating by 6.0%. It boasts the fastest-growing economy in the G7. The central bank has clearly signaled its intention to raise rates and a move is nearly fully discounted at next week’s meeting (July 12). Following a strong employment report before the weekend, the Canadian dollar extended its recent gains to reach its best level since last September, with the US dollar pushing below CAD1.29. The technical indicators are getting stretched but are not yet turning. Assuming the BoC leaves the door open for another rate hike before the end of the year, and given the speculative position, we suspect the US dollar can approach CAD1.28. |
USD/CAD with Technical Indicators, July 08(see more posts on Bollinger Bands, Canadian Dollar, MACDs Moving Average, RSI Relative Strength, Stochastics, )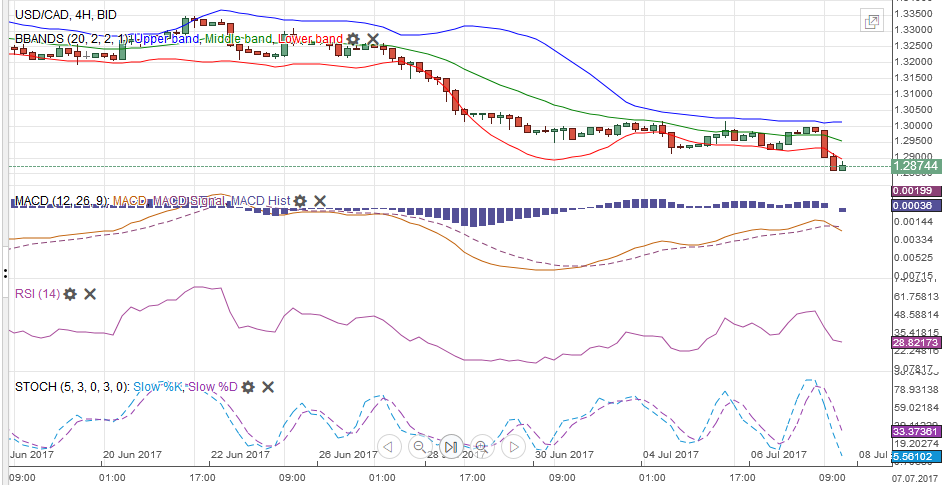 USD/CAD Week Ending July 08 with Technical Indicators - Click to enlarge |
AUD/USDThe Australian dollar fell one percent last week. It was unable to recover from the somewhat more dovish than expected central bank statement and the sharp rise in global interest rates that took some of the shine away from the traditional high yielding Australian dollar. However, in the second half of the week, the Aussie found support near $0.7570. A recovery toward $0.7635 would not change our bias toward a weaker Aussie. A five-week uptrend line has been violated. The MACDs and Slow Stochastics have turned lower. The five-day moving average is set to cross the below the 20-day moving average for the first time since late May. |
AUD/USD with Technical Indicators, July 08(see more posts on Australian Dollar, Bollinger Bands, MACDs Moving Average, RSI Relative Strength, Stochastics, )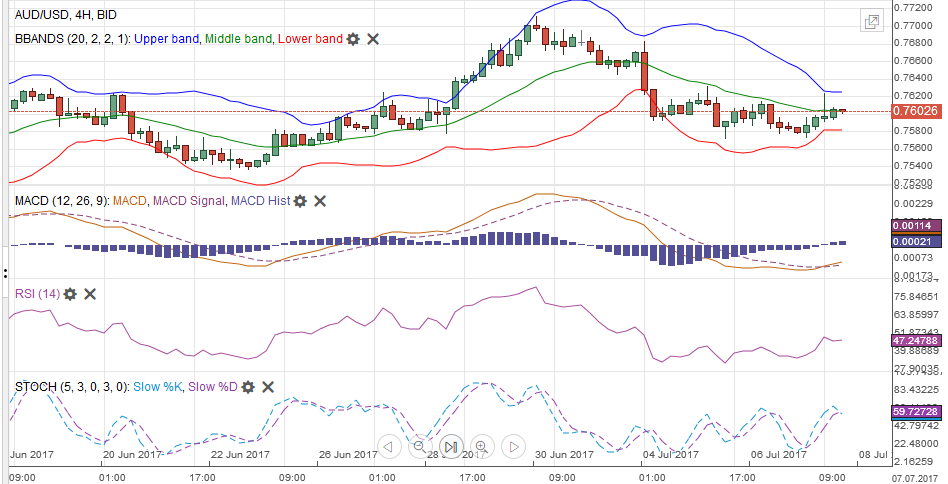 AUD/USD Week Ending July 08 with Technical Indicators - Click to enlarge |
Crude OilThe August light sweet crude oil futures contract staged a key reversal in the middle of last week. After making new highs since the June 21 low, it then switched directions and closed below the previous day’s low. News that US oil (and gasoline) inventories fell, with the former being at the lows for the year, encouraged some consolidation. However, US production remains strong, with Russia demurring, OPEC may have reached of its strategy what succeeded in extending what was initially thought to be a six-month operation. Also, Libyan and Nigerian output, which is not bound by the OPEC quotas, have managed to ramp up output. The August contract briefly fell below support near $44.00 before the weekend. The technical indicators are not generating a strong signal presently, but our bias is lower, with a test on the year’s low set last month near $42 likely. |
Crude Oil, July 2016 - July 2017(see more posts on Crude Oil, ) Source: bloomberg.com - Click to enlarge |
U.S. TreasuriesUS 10-year yields have continued their dramatic rise. They were threatening to go below 2.10% in mid-June and now three weeks later are testing the 2.40% area, which has capped yields since mid-March. The technical indicators are getting stretched after the three-week sell-off, and the 50% retracement objective of the rally since mid-March was nearly met (124-21). However, the close was poor, and the strength of US jobs growth, including the uptick in the average weekly hours worked, should set the tone for the upcoming data. The 61.8% retracement is found near 124-00, but the May low (124-12) may offer initial support.
|
Yield US Treasuries 10 years, July 2016 - July 2017(see more posts on U.S. Treasuries, )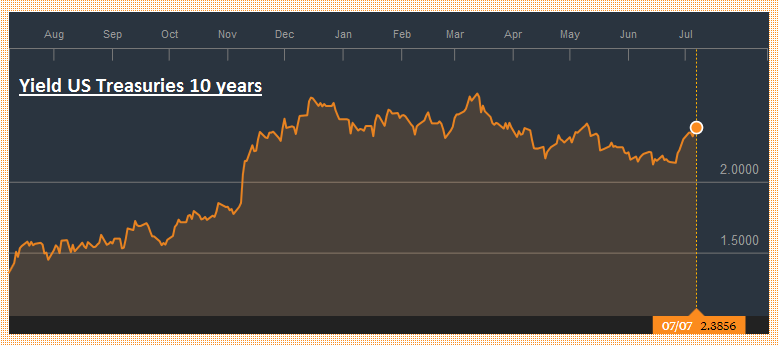 Source: bloomberg.com - Click to enlarge |
S&P 500 Index
The S&P 500 closed virtually flat on the week. It has spent the better part of the past five weeks in a 2400-2450 range. It has coped with the rise in interest rates better than many would have expected, not just the recent backing up of rates, but also the “three steps and a stumble” folklore. This broadly sideways movement has alleviated the overbought condition as recorded by the technical indicators, and the now the MACDs and Slow Stochastics are near to turning higher. The second quarter earning seasons formally kicks off with Alcoa on July 19. The Russell Value Index slipped almost 0.2% last week, its second loss since the mid-May. The Russell Growth Index rose by nearly as much and is now essentially flat over the past three weeks.
|
S&P 500 Index, July 08(see more posts on S&P 500 Index, ) Source: markets.ft.com - Click to enlarge |
Are you the author?
Tags: Australian Dollar,Bollinger Bands,British Pound,Canadian Dollar,Crude Oil,EUR/CHF,EUR/USD,Euro,Euro Dollar,GBP/USD,Japanese yen,MACDs Moving Average,newslettersent,RSI Relative Strength,S&P 500 Index,Stochastics,Swiss Franc Index,U.S. Dollar Index,U.S. Treasuries,usd-jpy,USD/CHF,USD/JPY