Marc Chandler
My articles My offerMy siteAbout meMy videosMy books
Follow on:LinkedINTwitterSeeking AlphaAmazon
Swiss FrancThe euro has appreciated by 0.15% to 1.0987 CHF.
|
EUR/CHF - Euro Swiss Franc, July 07(see more posts on EUR/CHF, )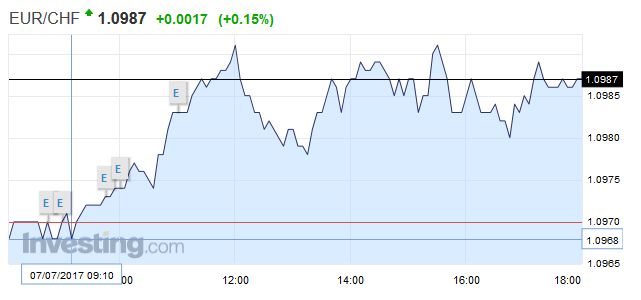 - Click to enlarge |
FX RatesTaper Tantrum 2.0, emanating from Europe rather than the United States continues to overshadow other developments. Yesterday, the yield on the 10-year German Bund pushed through the 50 bp mark that has capped the occasional rise in yields in recent months. The record of the ECB meeting was understood as indicating that the official assessment had surpassed the actual communication in order try to minimize the impact. Comments from the ECB’s Coeure seemed to point in the same direction. European bond yields are edging higher again today. US yields were dragged higher but still lagged behind the backing up of European yields. This resulted in a further compression of yield spreads and helped lift euro back above $1.14 (three-day high). The euro is in narrow ranges today near yesterday’s highs. The euro has approached thehigh from late June near $1.1445. If it cannot make a new high today, the technical indicators may look a bit toppish. |
FX Daily Rates, July 07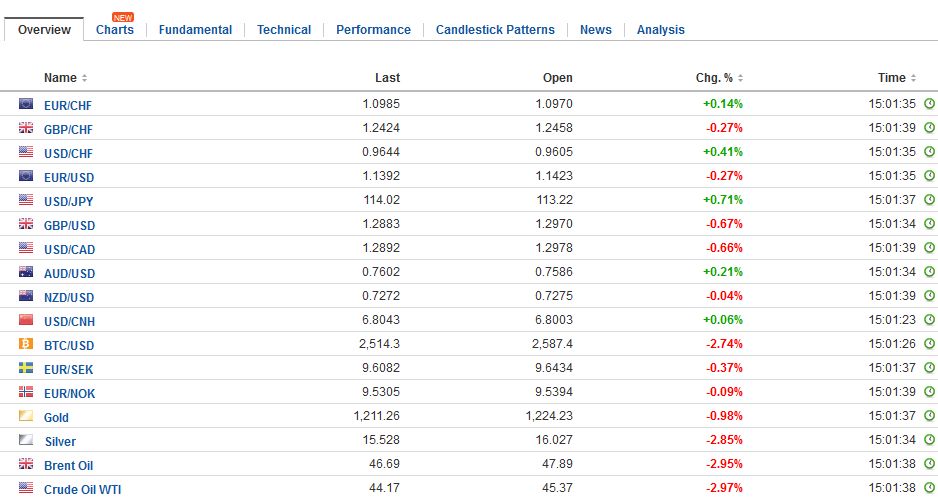 - Click to enlarge |
| The dollar pushed higher against the yen to approach JPY114. It is trading at its best level in nearly two months. At JPY113.75, it is up 1.2% for the week and the fourth consecutive weekly advance. May’s highs, near JPY114.35 and the JPY114.60 area (retracement objective of this year’s decline) are the next hurdles.
Sterling was sold through yesterday’s lows in response to the poor string of economic data. This week’s data arguably weakens the case for a BOE rate hike. The implied yield on the December short sterling futures contract has eased a couple of basis points this week. Next week’s employment report is expected to show another decline in average weekly earnings. A break of the $1.2980 area would raise confidence that a top of some kind is being formed. Although short-term Canadian rates have edged higher this week, the Canadian dollar moved broadly sideways this week. In fact, at CAD1.2980, the US dollar is slightly higher on the week. A cap has been formed near CAD1.3015. The charts warn of the risk of the potential for one more leg down, maybe a retest on the CAD1.2915 area before a corrective/consolidative phase. |
FX Performance, July 07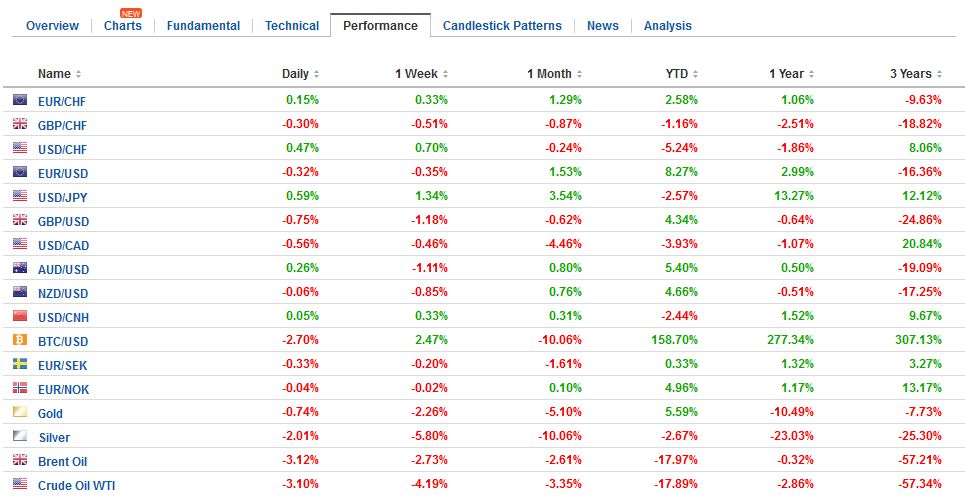 - Click to enlarge |
United KingdomA poor week for UK data that saw all three PMIs undershoot expectations was capped by today’s reports showing weaker industrial output, falling home prices, and a wider trade deficit. Industrial output had been expected to increase but instead fell 0.1% in May. Manufacturing fell by 0.2% and is the fourth decline in five months. Construction output fell for the second month. |
U.K. Industrial Production YoY, May 2017(see more posts on U.K. Industrial Production, )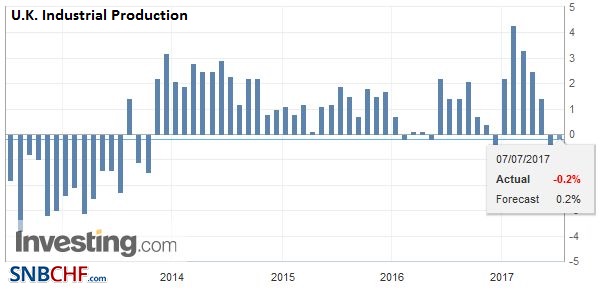 Source: Investing.com - Click to enlarge |
| The trade deficit swelled to GBP3.07 bln from GBP2.12 bln, which nearly matches the 12-month average, perhaps suggesting that the improvement spurred by the past sharp depreciation of sterling has run its course. The merchandise (visible) trade deficit rose to GBP11.86 bln and is above its 12-month average (~GBP11.0 bln). Lastly, Halifax reported its house price index fell 1.0% in May. |
U.K. Trade Balance, May 2017(see more posts on U.K. Trade Balance, )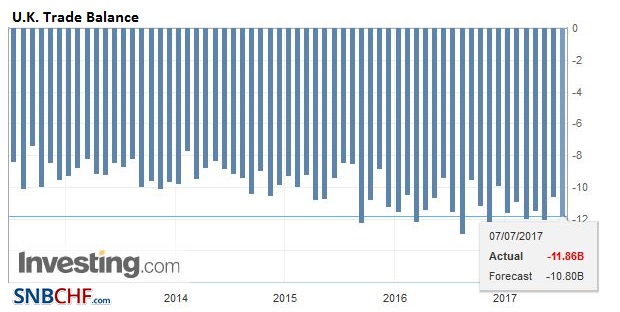 Source: Investing.com - Click to enlarge |
Spain |
Spain Industrial Production YoY, May 2017(see more posts on Spain Industrial Production, )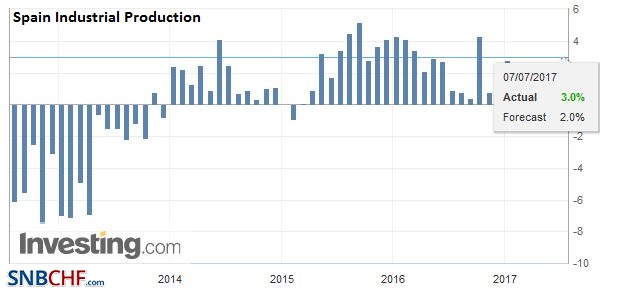 Source: Investing.com - Click to enlarge |
ItalyItalian retail sales disappointed in May. They fell 0.1% but were expected to have risen 0.3%. Adding insult to injury, the April series was revised to -0.4% from -0.1%. Retail sales in Italy have not grown since January. While Italy runs a primary budget surplus, and its debt is what is considered legacy (past policy errors), it remains among the most indebted country in Europe after Greece. Its real problem, however, is growth, and indeed the lack of it. Stronger growth might also help ease the non-performing loan challenge. Growth is well below the interest rate on Italy’s debt, despite the unorthodox policies at the ECB that drove down rates. |
Italy Retail Sales YoY, May 2017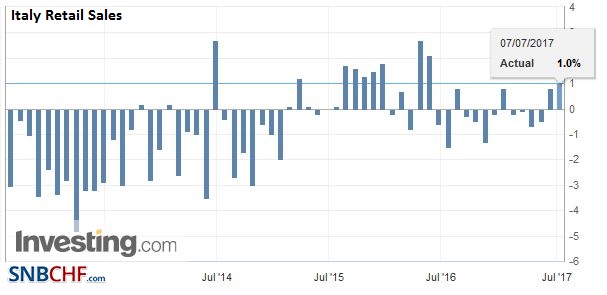 Source: Investing.com - Click to enlarge |
CanadaCanada reports its June employment figures today. However, barring a dramatic disappointing shock, expectations for Bank of Canada rate hike next week will be unaffected. Canada has created an average of 37k full-time positions a month this year. Last year’s average was about 6k a month. As a rough rule, Canada is about 1/10 the size of the US, so this would be the loose equivalent of the reporting 370k increases in non-farm payrolls for five consecutive months.
|
Canada Unemployment Rate, June 2017(see more posts on Canada Unemployment Rate, )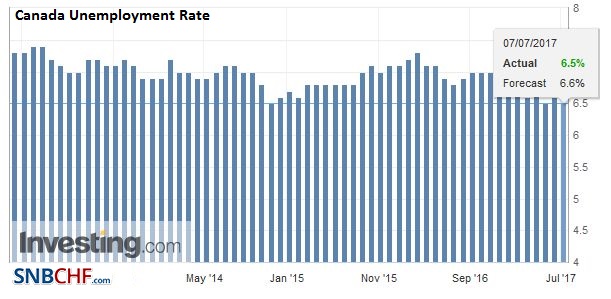 Source: Investing.com - Click to enlarge |
Canada Participation Rate, June 2017(see more posts on Canada Participation Rate, )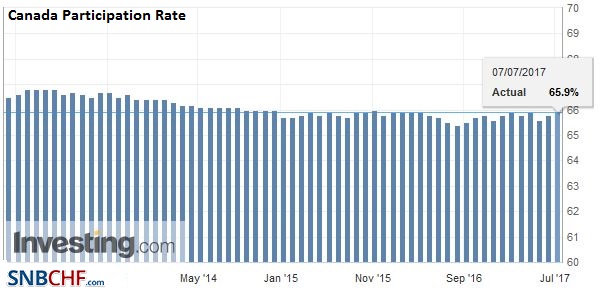 Source: Investing.com - Click to enlarge |
|
Canada Employment Change, June 2017(see more posts on Canada Employment Change, )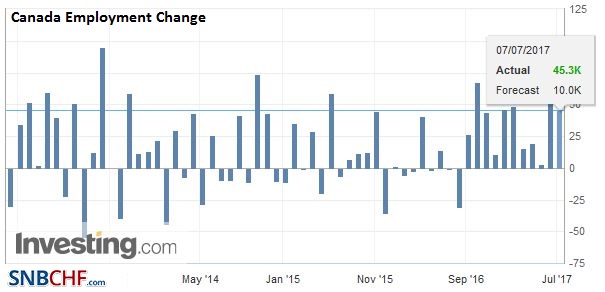 Source: Investing.com - Click to enlarge |
|
United StatesExpectations for today’s non-farm payroll report are for the 175k-180k increase. The monthly jobs gain has slowed recently. Consider that the three-month average was a little above 200k in February. In May it stood at 121k, the lowest since July 2012. |
U.S. Nonfarm Payrolls, June 2017(see more posts on U.S. Nonfarm Payrolls, )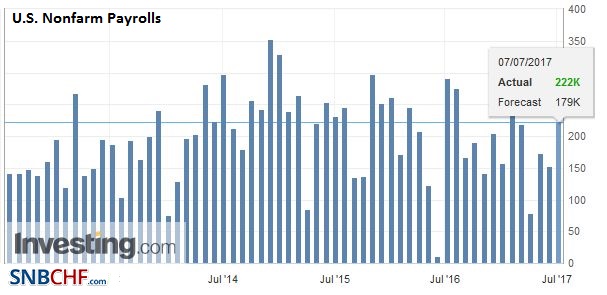 Source: Investing.com - Click to enlarge |
| However, given the dynamics of the participation rate, slowing jobs growth has seen the unemployment rate fall from 4.7% in February to 4.3% in May. |
U.S. Participation Rate, June 2017(see more posts on U.S. Participation Rate, )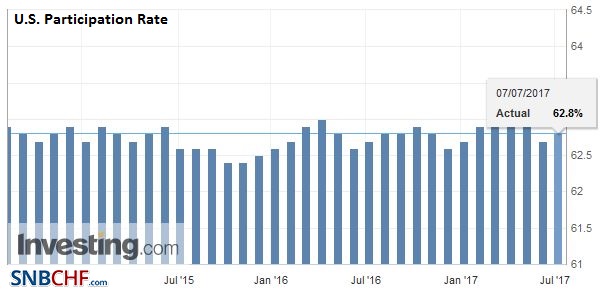 Source: Investing.com - Click to enlarge |
| The underemployment rate has fallen. It stands at 8.4%, down from 9.4% in January. |
U.S. Unemployment Rate, June 2017(see more posts on U.S. Unemployment Rate, )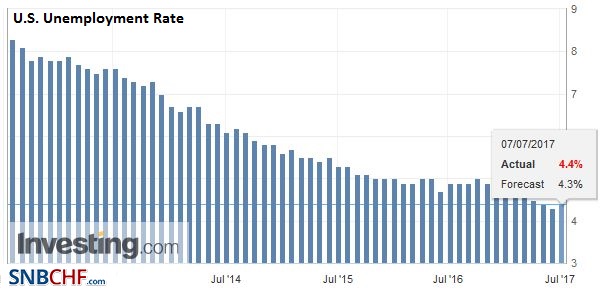 Source: Investing.com - Click to enlarge |
There were two impulses from the US economic data. On one hand, the ISM non-manufacturing survey was stronger than expected at 57.4 from 56.9 in May. The Bloomberg survey showed a median forecast for a weaker report. It averaged 57.3 in Q2 after an average of 56.4 in Q1 17 and 55.8 in Q4 16. The non-manufacturing PMI averaged 54.9 in 2016. Forward-looking orders rose to 60.5 from 57.7. Also, the price paid moved back above the 50-level (52.1 vs. 49.7 in May). Prices paid did slip in the ISM manufacturing report. The combination of modest inflation in services and deflation in goods (especially consumer durable goods) is part of the underlying price dynamic that often is obscured by focusing on headline measures.
On the other hand, labor market readings disappointed.This included the ADP (158k vs. 188k median forecast in the Bloomberg survey) and the employment component of the ISM non-manufacturing survey (55.8 vs. 57.8). Weekly initial jobless claims rose for the third consecutive week. During the week of the national survey, weekly jobless claims, and their four-week moving average were little above levels that were seen during a similar period in May. The 19.3% drop in the Challenger jobs cuts stands as an exception to the generalization.
A monthly gain of over 200k coupled with an increase in average hourly earnings would go a long way toward underscoring the upside economic surprises seen recently in the US. It would solidify expectations that the Fed is still on track to continue normalizing its monetary stance, which includes a balance sheet adjustment before the end of the year. Hourly earnings are expected to have risen by 0.3% for a 2.6% year-over-year rate (up from 2.5% in May).
Federal Reserve Chair Yellen will deliver the semiannual testimony before Congress next week. Today, her prepared remarks will be made available. These will likely be a broad overview of the economy, which is expanding a rate near where the Fed assesses is near-trend. This side of the financial crisis, the slower growth appears to be a function of weaker labor force growth (demographics and, perhaps, other sociological factors) and weaker productivity growth. At the same time, while the recovery may be getting long in the tooth, as they say, there does not appear to be the kind of imbalances that are corrected via market forces or policy which have been associated with the end of past business cycles.
Yellen and the Fed’s leadership seem more determined that some others to look past the near-term noise in high frequency data. We have suggested that earlier this year the Fed seemed to become more confident of the resilience of the economy and are committed to taking advantage of the better global conditions, and easing of US financial conditions, to continue normalizing policy through gradual rate increases and the beginning of the reduction of the Fed’s balance sheet.
Eurozone
While the ECB is seen preparing the investors for another adjustment in its risk assessment and for a reduction of asset purchases (while extending them), the BOJ wants to lag. With the 10-year JGB yield at its highest since February (~10.5 bp), and the five-year yield at its highest level since last November (~-4 bp), the BOJ offered to buy an unlimited amount of bonds. Apparently, the offer alone was sufficient to push the 10-year yield almost two basis points lower.
Germany
There were two economic reports from Europe to note, and both were surprises. German May industrial output jumped 1.2% (median Bloomberg survey forecast was for 0.2%). It is the fifth consecutive gain and overshadows the minor downward revision in April (0.7% from 0.8%). Manufacturing output rose 1.3%, helped by machinery and autos. Energy output rose 2.9%, while construction fell 1% after three months of gains.
China
Lastly, we note that China reported that its June reserves rose by $3 bln to $3.056 trillion. It is the fifth consecutive increase in reserves. During this stretch, the dollar value of the reserves has risen by about $58 bln. Some of this may reflect valuation gains from the non-dollar component of reserves but offset by the sharp sell-off in the European bonds it holds. The increase in reserves may be spurred by capital controls and the breaking of the one-way yuan-depreciation.
Graphs and additional information on Swiss Franc by the snbchf team.
Full story here Are you the author?Tags: #GBP,#USD,$CAD,$CNY,$EUR,$JPY,Canada Employment Change,Canada Participation Rate,Canada Unemployment Rate,EUR/CHF,FX Daily,newslettersent,Spain Industrial Production,u-k-trade-balance,U.K. Industrial Production,U.S. Nonfarm Payrolls,U.S. Participation Rate,U.S. Unemployment Rate