George Dorgan
My articles My siteAbout meMy videosMy books
Follow on:LinkedINTwitterSeeking Alpha
CFA SocietyEconomicBlogs
| Over the last month, the Swiss franc outpaced both EUR and USD. But the change is only little, the EUR fell by 0.60% and the dollar by 0.40%.
The main reason for the stronger CHF is the fading enthusiasm after Macron’s victory in the French elections and hence a weaker euro. Consequently also SNB interventions are rising again.
|
EUR/CHF and USD/CHF, June 24(see more posts on EUR/CHF, USD/CHF, )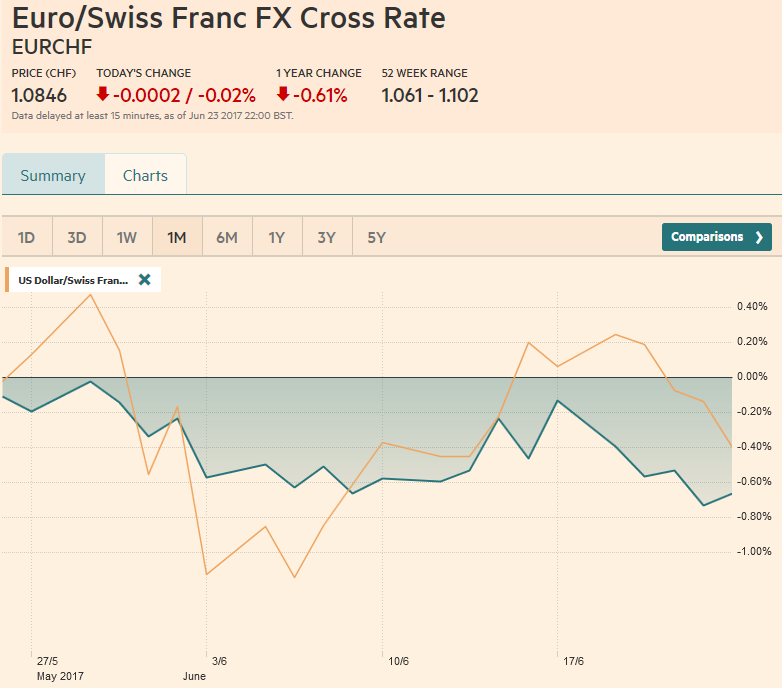 Source: markets.ft.com - Click to enlarge |
Swiss Franc Currency Index (3 years)The Swiss Franc index is the trade-weighted currency performance (see the currency basket)On a three years interval, the Swiss Franc had a weak performance. The dollar index was far stronger. The dollar makes up 33% of the SNB portfolio and 25% of Swiss exports (incl. countries like China or Arab countries that use the dollar for exchanges). Contrary to popular believe, the CHF index gained only 1.73% in 2015. It lost 9.52% in 2014, when the dollar (and yuan) strongly improved. |
Swiss Franc Currency Index (3 years), June 24(see more posts on Swiss Franc Index, ) Source: markets.ft.com - Click to enlarge |
Marc Chandler My articles My offerMy siteAbout meMy videosMy books Follow on:LinkedINTwitterSeeking AlphaAmazon USD/CHFThe US dollar edged higher against most of the major currencies over the past week.
However, the fundamental backing is still not solid, and it makes as wary of these upticks, even though we think a bottom is being carved. Specifically, the US interest rates still not finding much traction, and President Trump’s legislative agenda still is encountering significant resistance within the Republican Party.
|
US Dollar/Swiss Franc FX Spot Rate, June 24(see more posts on USD/CHF, )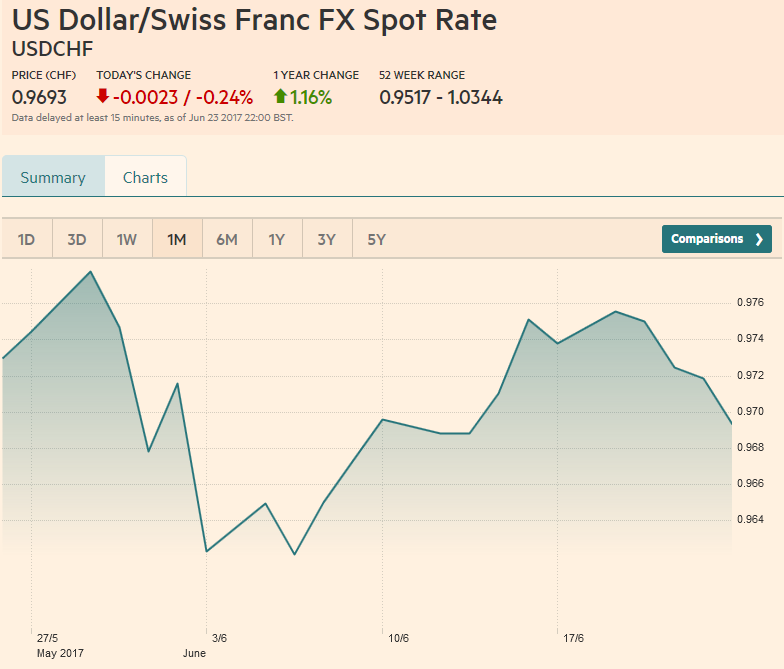 Source: markets.ft.com - Click to enlarge |
US Dollar IndexSince the end of April, the Dollar Index has alternated between advancing and declining weeks. We suspect the pattern will continue next week. After this week’s upticks, it means a setback. Over most of this period the Dollar Index has been confined to a roughly 96.50-98.00 range. The Dollar Index peaked in front of near 97.90 on June 20. It can drift toward the lower end of the range, which we expect to hold. |
US Dollar Currency Index, June 24(see more posts on U.S. Dollar Index, )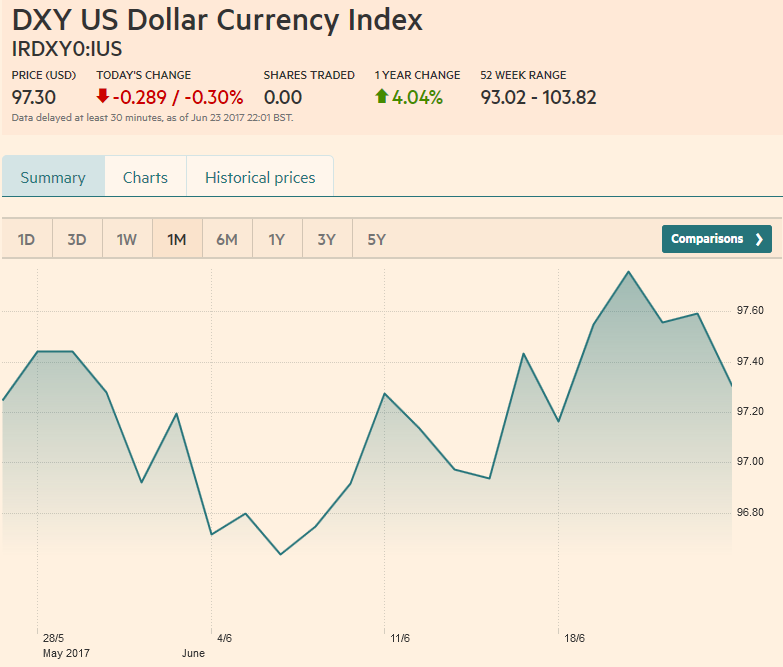 Source: markets.ft.com - Click to enlarge |
EUR/USDThe euro was confined to narrow trading ranges last week and finished little changed against the dollar. Since the middle of May, the euro has traded in an $1.11-$1.13 trading range. After starting the week in Asia above $1.12, it was confined to the lower half of the range in the past several sessions. The sideways trading has alleviated the extended technical condition we have been monitoring. In our macro view, we are concerned that a great deal of good eurozone news has been discounted, and that the economic momentum slows and price pressures ease. The softening seen in the flash PMI is consistent with this. Next week, the preliminary estimate for June CPI will be reported. The signal may be obscured by a decline in the headline and a small gain in the core. |
EUR/USD with Technical Indicators, June 24(see more posts on Bollinger Bands, EUR/USD, MACDs Moving Average, RSI Relative Strength, Stochastics, )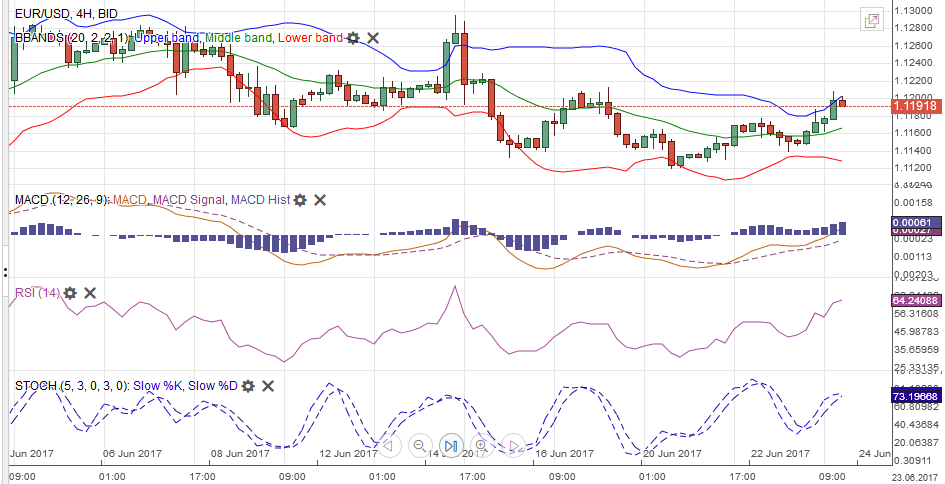 EUR/USD Week Ending June 24 with Technical Indicators - Click to enlarge |
USD/JPYThe dollar drifted lower against the yen after peaking near JPY111.80 on June 20. Bid for the dollar near JPY111.00 limited its descent. However, without greater support from the Treasury market, the greenback looks vulnerable, with an initial target near JPY110.65. As it spent a good part of the first half of June below the 200-day moving average, we would not ascribe much significance to it now, but note that it is found just below JPY111.00. |
USD/JPY with Technical Indicators, June 24(see more posts on Bollinger Bands, MACDs Moving Average, RSI Relative Strength, Stochastics, USD/JPY, )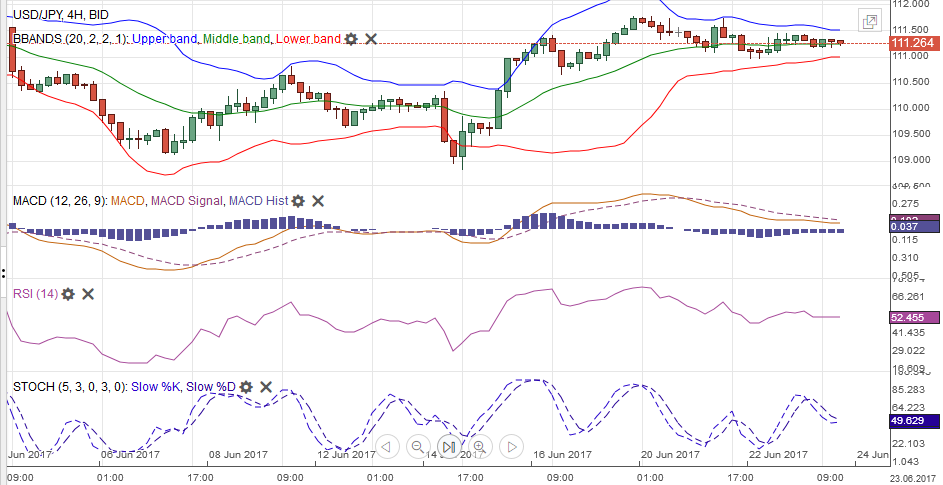 USD/JPY Week Ending June 24 with Technical Indicators - Click to enlarge |
USD/GBPSterling’s technical condition appears significantly superior to its fundamental backdrop.
The EU has the stronger hand in Brexit negotiations. The loss of the Tory majority may cost the government GBP 2 bln of additional infrastructure and NHS spending to get the support of the DUP, with which it agrees with on very few issues. The Lib-Dems and Labour are seeking to frustrate May’s ability to govern as if the Tories had a majority. On top of this, the central bank is as divided as it has been under Carney, though some may recall that Carney’s predecessor was out-voted more than once.
The MACDs and Slow Stochastics are poised to cross higher for sterling. Initial resistance is seen in the $1.2800-$1.2815 area.
What looks like a resilient sterling is more a case of a weak dollar. The euro has risen around 5.5% against the sterling since mid-May and near GBP0.8800 is within about 0.5% of the year’s high. On a trade-weighted basis, sterling is off 2% this month. We remain bearish sterling on a medium-term view.
Despite the knee-jerk reaction, the market is not convinced the softer May CPI reading before the weekend offset the strength of the retail sales report the day before, and the robust employment data.
Next week’s April GDP figure will be a reminder of the strength of the economy. We suggested sterling’s technical condition is better than its fundamental support;
|
GBP/USD with Technical Indicators, June 24(see more posts on Bollinger Bands, GBP/USD, MACDs Moving Average, RSI Relative Strength, Stochastics, )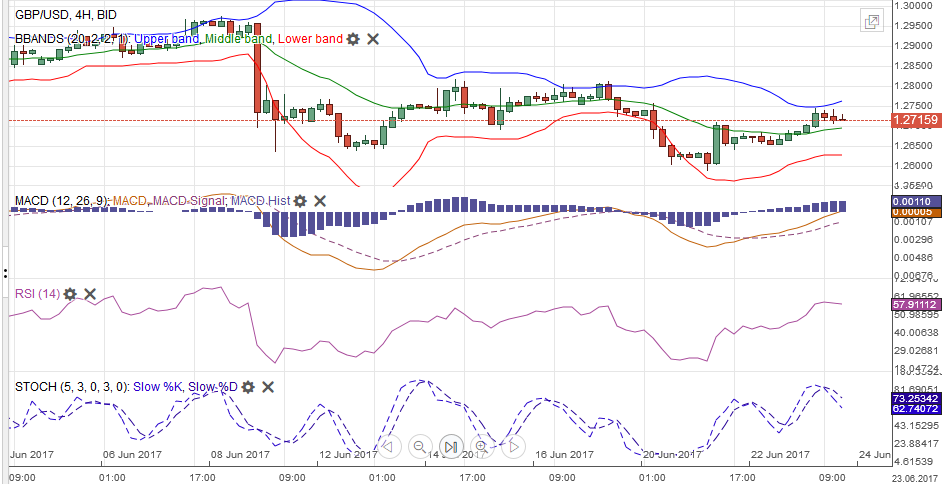 GBP/USD Week Ending June 24 with Technical Indicators - Click to enlarge |
USD/CADThe Canadian dollar is the opposite. Its technical conditions appear fragile. The MACDs and Slow Stochastics are poised to cross higher for the US dollar. The greenback has shed around 4.5% since early May. Bids near CAD1.3200 have lent support to the dollar. On the topside, CAD1.3350 has to be breached to signal anything important.
|
USD/CAD with Technical Indicators, June 24(see more posts on Bollinger Bands, Canadian Dollar, MACDs Moving Average, RSI Relative Strength, Stochastics, )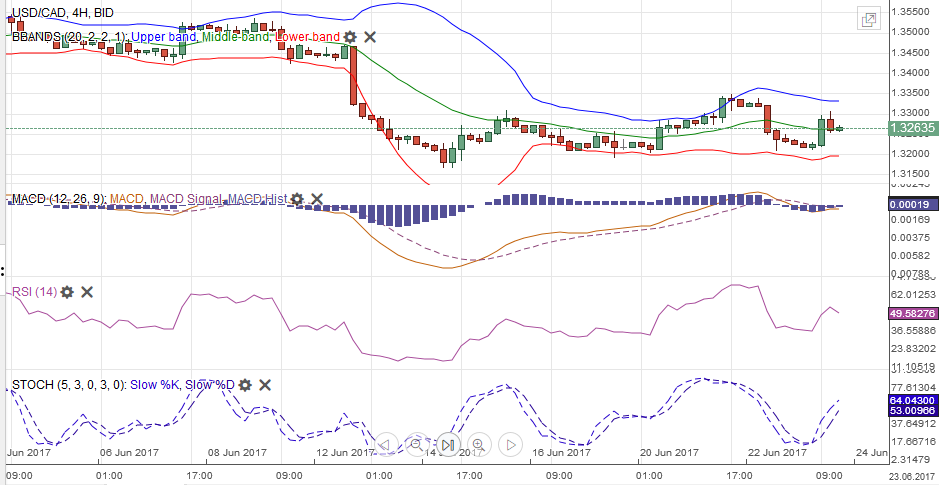 USD/CAD Week Ending June 24 with Technical Indicators - Click to enlarge |
AUD/USDThe Australian dollar snapped a four-day slide ahead of the weekend. It now looks poised to have a running start at the $0.7630 area that blocked it earlier this month. Speculative positioning is neutral, but the technical resistance near $0.7700 is formidable. Raising hedge ratios into the rally may be preferable to increase exposure. |
AUD/USD with Technical Indicators, June 24(see more posts on Australian Dollar, Bollinger Bands, MACDs Moving Average, RSI Relative Strength, Stochastics, )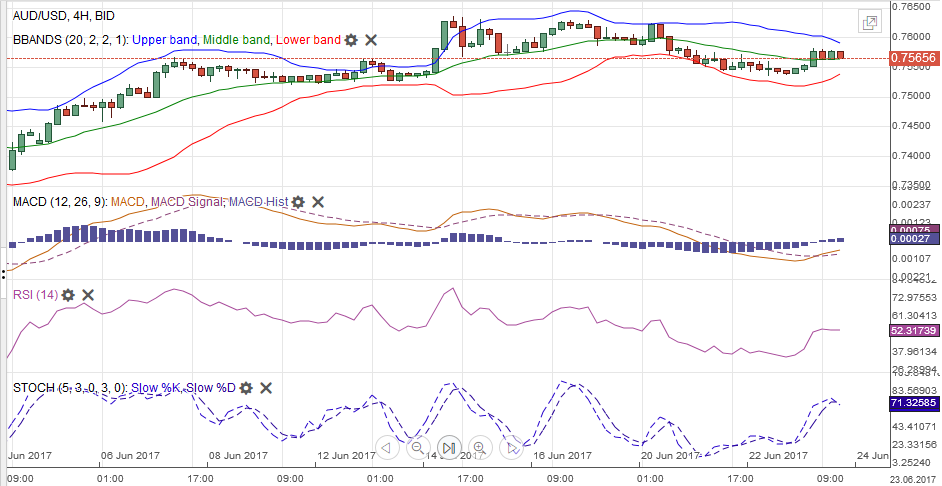 AUD/USD Week Ending June 24 with Technical Indicators - Click to enlarge |
Crude OilThe bears in the oil market look tired, and for good reason.
They have beaten the price down more than 16% in the unrelenting sell-off for the past five weeks. Technically, the August light sweet crude oil futures contract looks poised to trade higher over the coming days. After falling to nearly $42 a barrel in the middle of last week, the contract faces initial resistance in the $44.00-$44.50 area and a stronger cap near $46.00.
|
Crude Oil, June 2016 - June 2017(see more posts on Crude Oil, )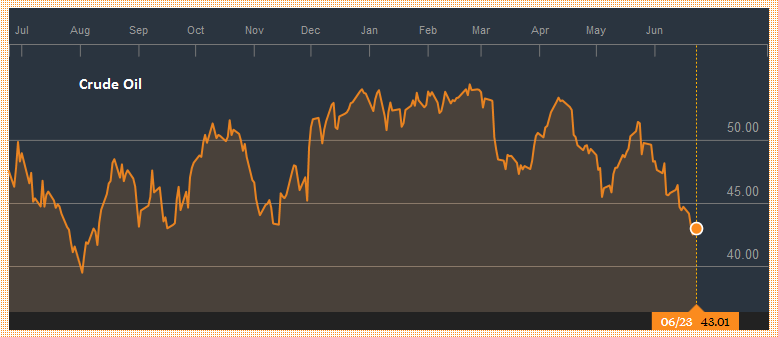 Source: bloomberg.com - Click to enlarge |
U.S. TreasuriesUS 10-year bond yields show no compelling sign that they have bottomed. The tone still seems fragile. The yield has not closed above its 20-day moving average since mid-May. The September 10-year note futures contract is moving broadly sideways. Nearby support is seen near 126-16. A break of 126-00 would suggest a top of some importance may be in place. |
Yield US Treasuries 10 years, June 2016 - June 2017(see more posts on U.S. Treasuries, )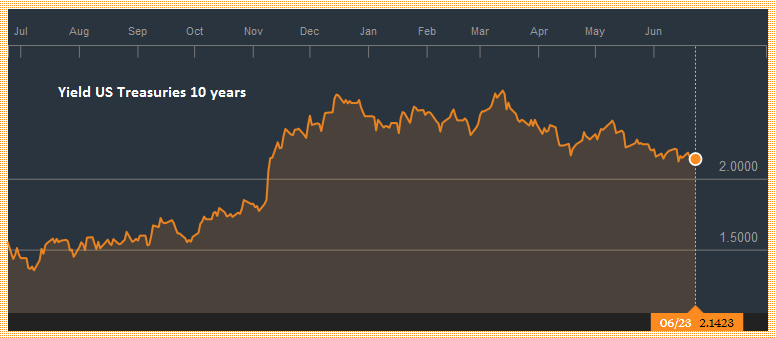 Source: bloomberg.com - Click to enlarge |
S&P 500 IndexThe S&P 500 gapped higher to start the week and spent the next two sessions filling the gap.
It has now built a little base near 2430. The technical indicators do not stand in the way of a push to marginal new highs. Below the surface that seems a rotation of sorts is threatening. Russell 1000 Growth Index rose 1.1% last week, snapping a two-week drop. Russell 1000 Value Index slipped 0.6%, ending a four-week advance.
|
S&P 500 Index, June 24(see more posts on S&P 500 Index, )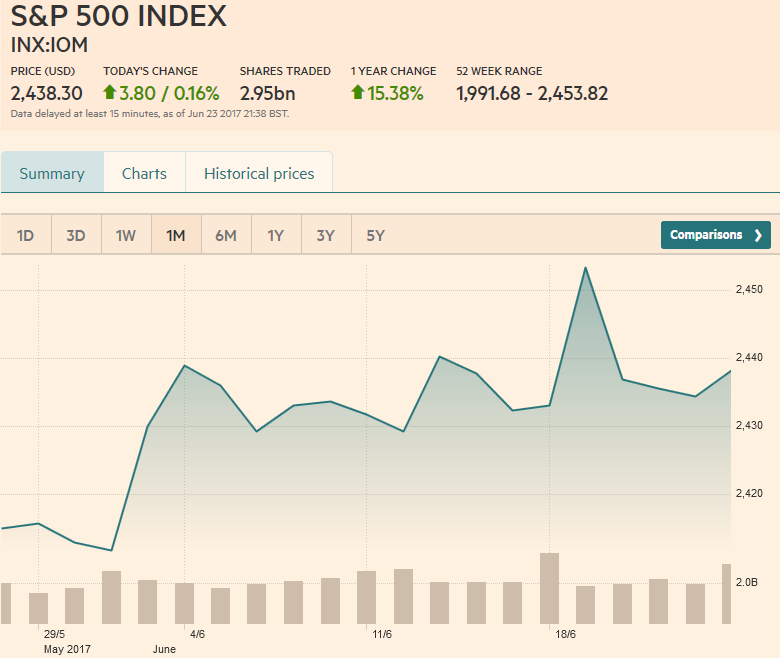 Source: markets.ft.com - Click to enlarge |
Are you the author?
Tags: Australian Dollar,Bollinger Bands,British Pound,Canadian Dollar,Crude Oil,EUR/CHF,EUR/USD,Euro,Euro Dollar,GBP/USD,Japanese yen,MACDs Moving Average,newslettersent,RSI Relative Strength,S&P 500 Index,Stochastics,Swiss Franc Index,U.S. Dollar Index,U.S. Treasuries,usd-jpy,USD/CHF,USD/JPY