George Dorgan
My articles My siteAbout meMy videosMy books
Follow on:LinkedINTwitterSeeking Alpha
CFA SocietyEconomicBlogs
Swiss FrancThe Swiss franc was the weakest of the majors. Its 1.7% fall was the largest in six months. Over the past month, the euro has rallied strongly against the Swiss franc. The 3.2% rally has seen the euro reach heights not see since last September. Thanks to the win of the pro-euro Macro, FX traders went long Euro and short CHF. The euro rose up to 1.0980. How long this momentum will last is still the question, given that it is driven by this political event and sustained by SNB interventions. That the momentum slowed was already visible on Friday when traders took profits: Both EUR/CHF and USD/CHF fell again. |
EUR/CHF and USD/CHF during French elections The picture shows that FX traders went long EUR against CHF. At the end of the week they took profits. - Click to enlarge |
Swiss Franc Currency Index (3 years)The Swiss Franc index is the trade-weighted currency performance (see the currency basket)On a three years interval, the Swiss Franc had a weak performance. The dollar index was far stronger. The dollar makes up 33% of the SNB portfolio and 25% of Swiss exports (incl. countries like China or Arab countries that use the dollar for exchanges). Contrary to popular believe, the CHF index gained only 1.73% in 2015. It lost 9.52% in 2014, when the dollar (and yuan) strongly improved. |
Swiss Franc Currency Index (3 years), May 13(see more posts on Swiss Franc Index, )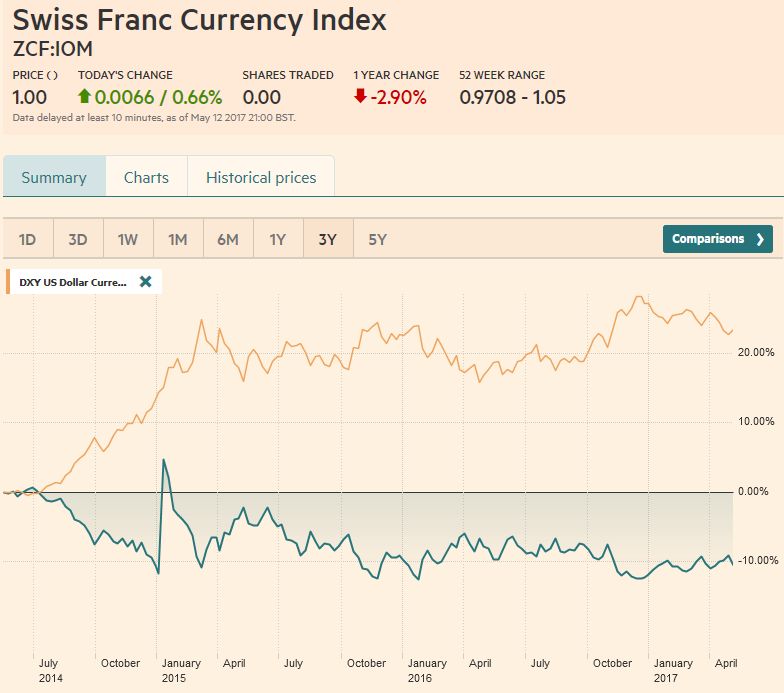 Source: markets.ft.com - Click to enlarge |
USD/CHFSofter than expected April US retail sales and consumer prices saw the dollar pare its gains ahead of the weekend – so also against the Swiss Franc.
|
US Dollar/Swiss Franc FX Spot Rate, May 13(see more posts on USD/CHF, )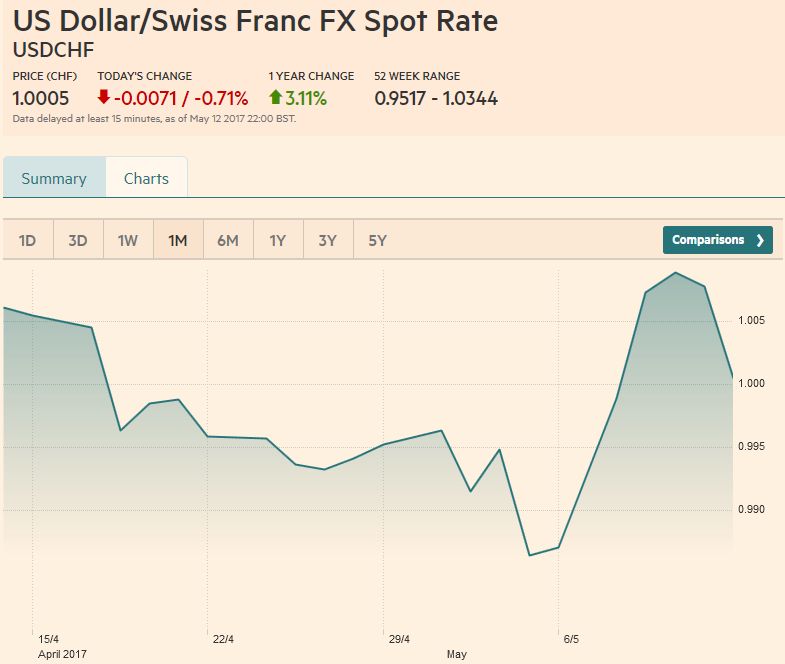 Source: markets.ft.com - Click to enlarge |
Marc Chandler My articles My offerMy siteAbout meMy videosMy books Follow on:LinkedINTwitterSeeking AlphaAmazon US Dollar Index
The dollar’s technical tone until data disappointment was improving. The setback clouds the near-term outlook. Recall that the Dollar Index reached a three-week high on May 11, filling the upside gap created by the sharply lower opening in response to the first round of the French election. The sell-off on May 12 retraced 50% of the from the key reversal low set at the start of the week. That was found at 99.20. The 61.8% retracement is near 99.00. A break warns of a retest of the recent low by 98.50. |
US Dollar Currency Index, May 13(see more posts on U.S. Dollar Index, )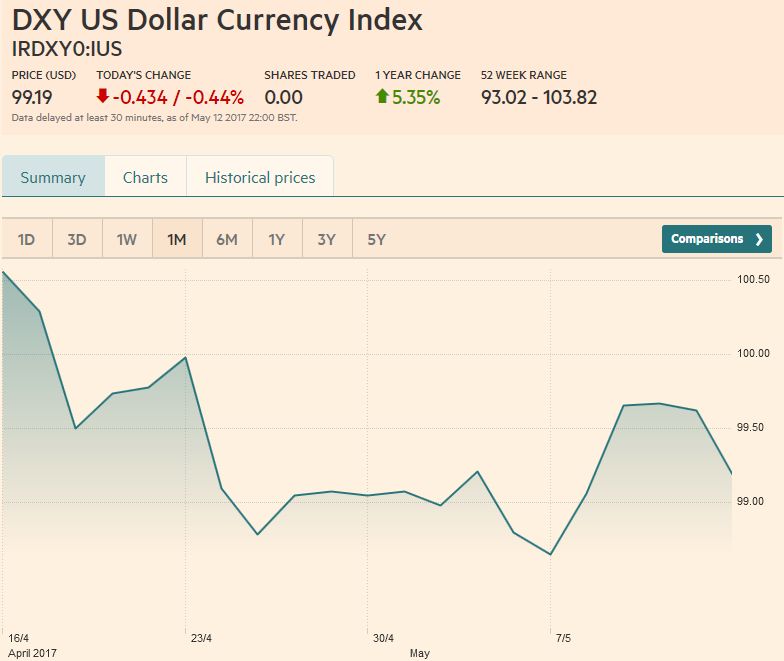 Source: markets.ft.com - Click to enlarge |
EUR/USDThe euro has not even entered a similar gap on the daily and weekly bar charts. The top of the gap is near $1.0820, and the euro barely slipped through $1.0840.
|
EUR/USD with Technical Indicators, May 13(see more posts on Bollinger Bands, EUR/USD, MACDs Moving Average, RSI Relative Strength, Stochastics, )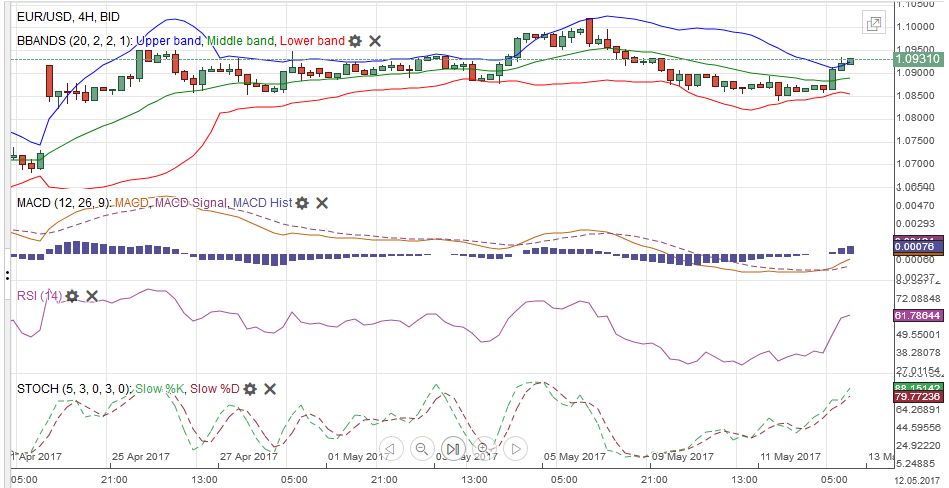 EUR/USD Week Ending May 13 with Technical Indicators - Click to enlarge |
USD/JPYFor three consecutive sessions, the dollar tried in vain to push through the JPY114.40. Short-term players appeared to give up on it even before the disappointing US data. It did not manage to poke through JPY114 before the data, and after the data, the five basis point decline in US yields assured it would not happen then either. The near-term risk is on the downside. A break of JPY113.00 Below there the JPY111.00-JPY111.25 band beckons. Further out, a small gap remains from late April between roughly JPY109.40 and JPY109.60. |
USD/JPY with Technical Indicators, May 13(see more posts on Bollinger Bands, MACDs Moving Average, RSI Relative Strength, Stochastics, USD/JPY, ) USD/JPY Week Ending May 13 with Technical Indicators - Click to enlarge |
GBP/USDSterling is in a $1.28-$1.30 range. Since it tested the lower end of the range before the weekend and it held, a retest of the upper end of the range seems likely in the coming days. However, the technical indicators have not turned, and the UK rates have softened in the aftermath of the BOE meeting. That said, both ends of the range can be extended by half a cent without convincingly signaling a breakout. |
GBP/USD with Technical Indicators, May 13(see more posts on Bollinger Bands, GBP/USD, MACDs Moving Average, RSI Relative Strength, Stochastics, )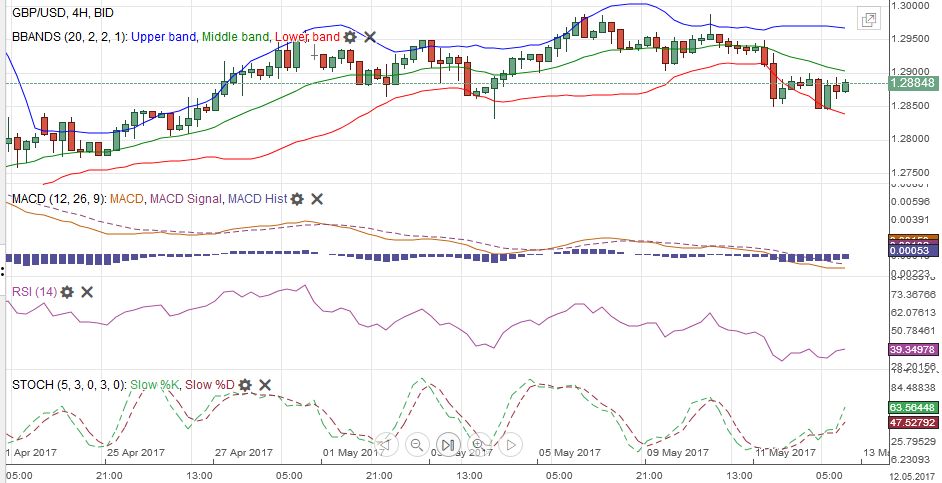 GBP/USD Week Ending May 13 with Technical Indicators - Click to enlarge |
AUD/USDSince the Fed’s hike on the Ides of March, the Australian dollar has been the weakest of the major currencies, losing more than 4% against the US dollar. Even before the disappointing US data, the Australian dollar’s downside momentum had been easing, and some demand emerged around $0.7330. Initial resistance is seen near $0.7430. Several technical consideration converges by $0.7500, which suggests it will be a formidable barrier. |
AUD/USD with Technical Indicators, May 13(see more posts on Australian Dollar, Bollinger Bands, MACDs Moving Average, RSI Relative Strength, Stochastics, )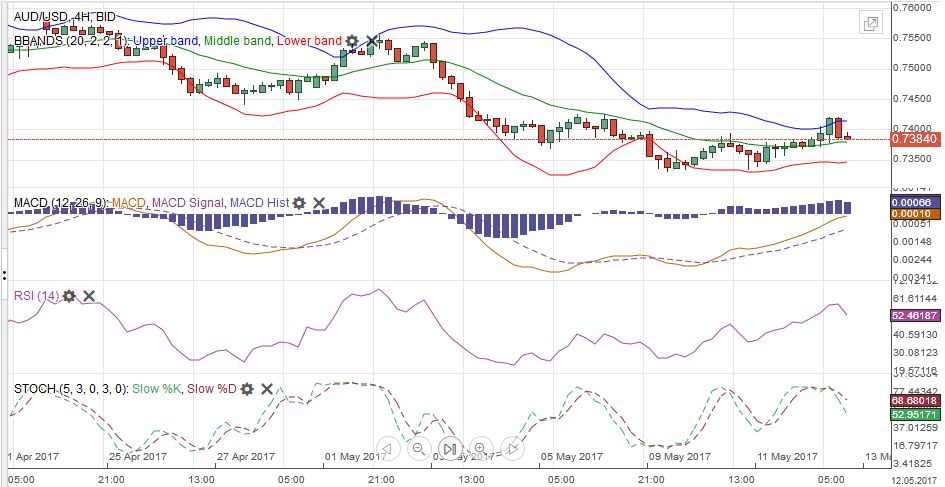 AUD/USD Week Ending May 13 with Technical Indicators - Click to enlarge |
USD/CADOver the past several sessions, the US dollar has forged a shelf near CAD1.3640. On the upside, it has only made it up above CAD1.3780 once. Moody’s downgrade of half a dozen Canadian banks due to concern over household balance sheets cut short hopes of a Canadian dollar recovery after the key reversal on May 5. The technical indicators are mixed, which may suggest near-term broad sideways trading. |
USD/CAD with Technical Indicators, May 13(see more posts on Bollinger Bands, Canadian Dollar, MACDs Moving Average, RSI Relative Strength, Stochastics, )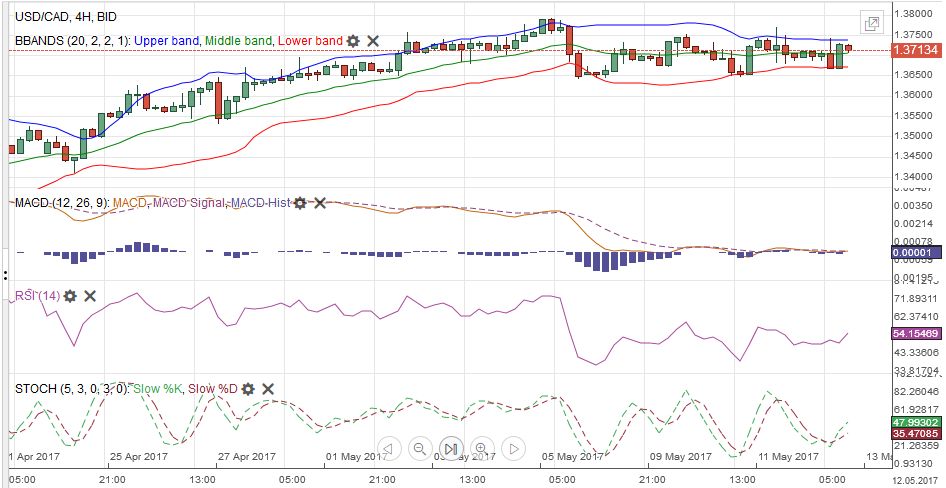 USD/CAD Week Ending May 13 with Technical Indicators - Click to enlarge |
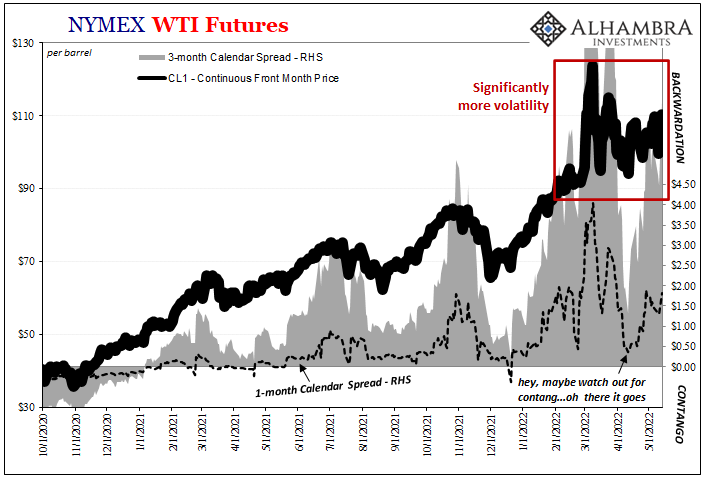
Crude OilIn the middle of last week, the oil rallied by the most since OPEC agreement was struck. The 3.2% rally was followed by another percentage point advance the following day, before consolidating ahead of the weekend. The rally managed to retrace 38.2% (~$47.75) of the last leg lower than began near $54.15 on April 12. The 50% retracement is found at $49.00. EIA and continued to revise up its US output estimates. More broadly, non-OPEC countries are making up for a large fraction of OPEC’s cuts. There may be a reluctance to commit to rolling the output restraints over for more than six months, but there is the talk of a year extension. |
Crude Oil, May 2016 - May 2017(see more posts on Crude Oil, )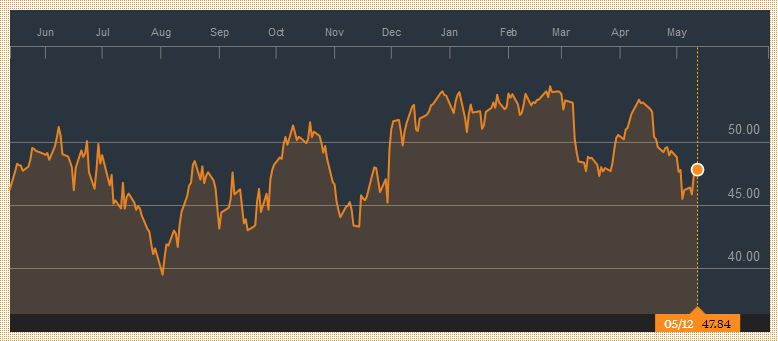 Source: bloomberg.com - Click to enlarge |
U.S. TreasuriesIn the last two sessions, the US 10-year note yield fell 11 bp to 2.33%. Between April 18 and the middle of last week, the 10-year yield rose 26 bp. Although the 2.30% level, which now houses the 20-day moving average has lost its significance, a move below 2.27% would open the door to back to the recent low yield near 2.16%. The June note futures sold off from 126-20 on April 18 to 124-23 on May 11. The bounce carried it back to 125-16 before the weekend. This met the 38.2% retracement of the decline. The 50% is found 125-21. The top of the previous congestion and 61.8% retracement is around 125-28. Look for demand to emerge (support) ahead of 125-00. |
Yield US Treasuries 10 years, May 2016 - May 2017(see more posts on U.S. Treasuries, ) Source: bloomberg.com - Click to enlarge |
S&P 500 IndexThe S&P 500 snapped a three-week advance with a minor 0.4% decline, but not before making a new marginal record high. The market seems stuck in a 2380-2400 range. We have been concerned about the downside gaps from late April, and now the technical indicators warn of the potential pending test of them. The higher gap is from roughly 2377 to 2381. The lower gap extends from near 2369.2 to about 2344.5. |
S&P 500 Index, May 13(see more posts on S&P 500 Index, )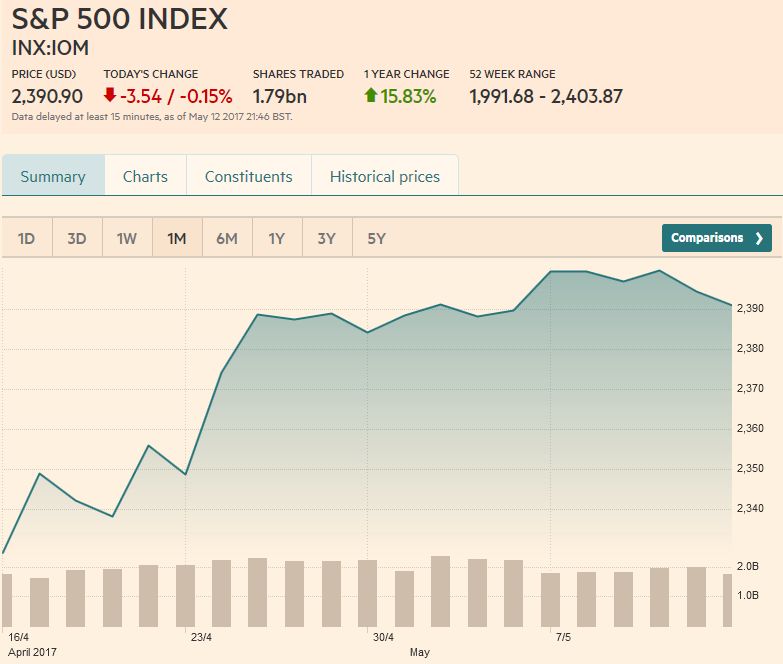 Source: markets.ft.com - Click to enlarge |
Are you the author?
Tags: Australian Dollar,Bollinger Bands,British Pound,Canadian Dollar,Crude Oil,EUR/CHF,EUR/USD,Euro,Euro Dollar,GBP/USD,Japanese yen,MACDs Moving Average,newslettersent,RSI Relative Strength,S&P 500 Index,Stochastics,Swiss Franc Index,U.S. Dollar Index,U.S. Treasuries,usd-jpy,USD/CHF,USD/JPY