


Marc Chandler
My articles My offerMy siteAbout meMy videosMy books
Follow on:LinkedINTwitterSeeking AlphaAmazon
Swiss Franc Currency IndexThe Swiss Franc Index has lost 1% over the course of the last month, while the dollar index improved by 2%.
|
Trade-weighted index Swiss Franc, January 07(see more posts on Swiss Franc Index, )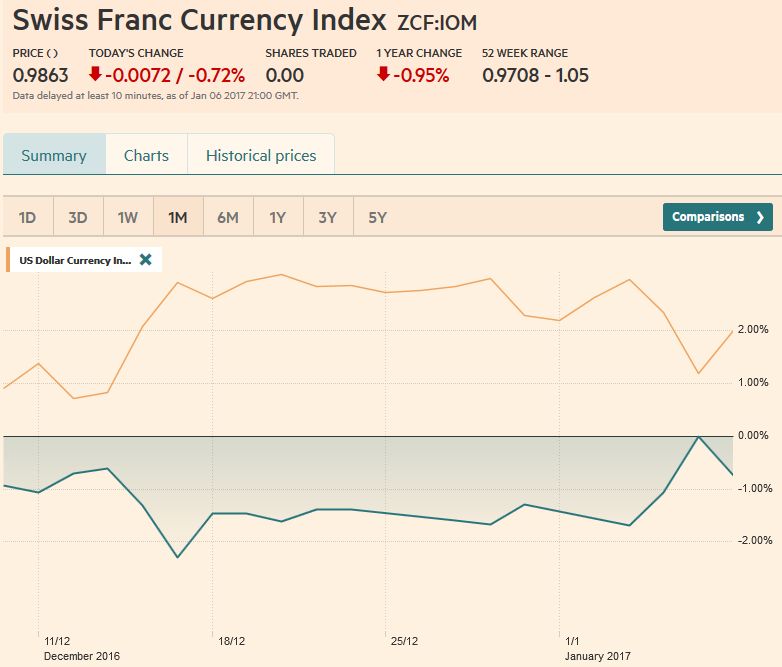 Source: markets.ft.com - Click to enlarge |
Swiss Franc Currency Index (3 years)The Swiss Franc index is the trade-weighted currency performance (see the currency basket)On a three years interval, the Swiss Franc had a weak performance. The dollar index was far stronger. The dollar makes up 33% of the SNB portfolio and 25% of Swiss exports (incl. countries like China or Arab countries that use the dollar for exchanges). Contrary to popular believe, the CHF index gained only 1.73% in 2015. It lost 9.52% in 2014, when the dollar (and yuan) strongly improved. |
Swiss Franc Currency Index (3 years), January 07(see more posts on Swiss Franc Index, )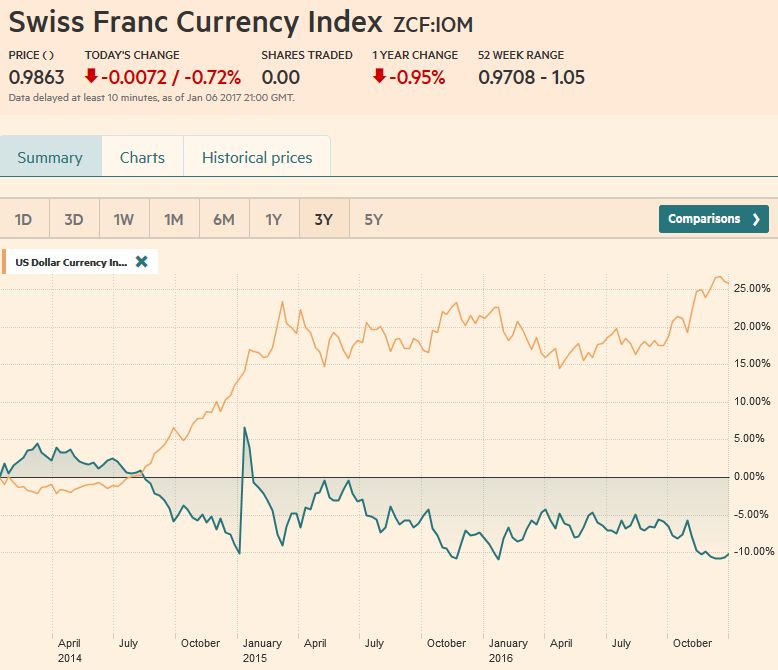 Source: markets.ft.com - Click to enlarge |
|
USD/CHFThe lack of full participation and the resulting choppy conditions may have obscured the signal from the capital markets. That signal we think was one of correction since shortly after the Fed’s rate hike in mid-December.
The question now, after the US employment data showed continued labor market strength and that earnings improvement remains intact, is whether the corrective phase is over. The technical evidence is not clear, but on balance, we are inclined to assume the correction is intact unless proven otherwise. The price action before the weekend is setting up a test of this in the coming days. The price action itself should be respected.
|
US Dollar/Swiss Franc FX Spot Rate, January 07(see more posts on USD/CHF, )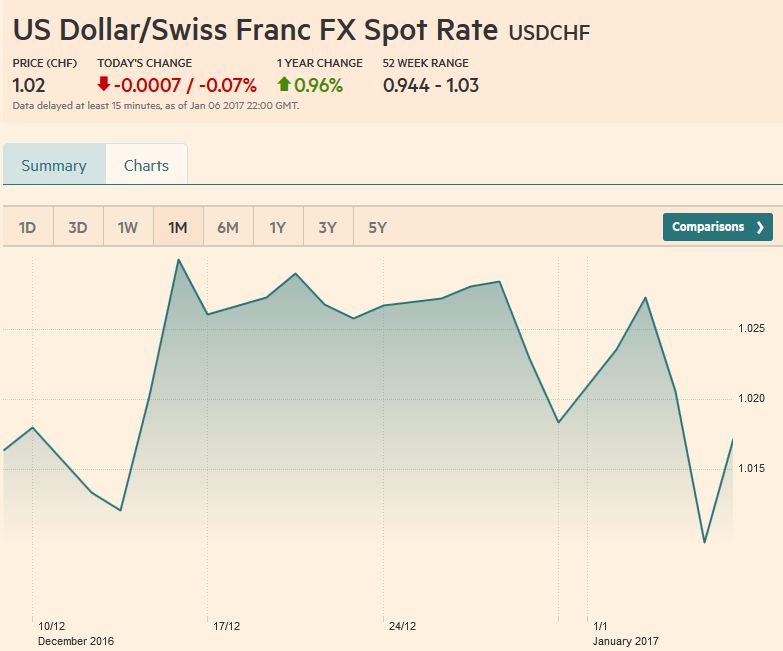 Source: markets.ft.com/ - Click to enlarge |
US Dollar IndexThe Dollar Index returned to levels seen on December 14 when the Fed hiked. The five-day moving average slipped below the 20-day average for the first time since the day before the Fed’s hike. A move now above the 102.60 area would be a preliminary signal of another run to 103.80 and higher. The next downside target is near 100.80 and then 100. 00. |
US Dollar Currency Index Dollar Index, January 07(see more posts on Dollar Index, )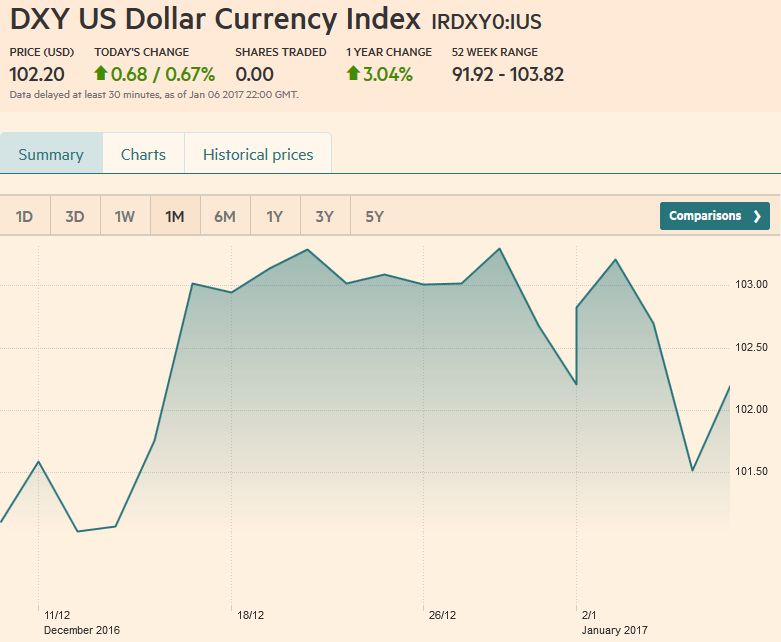 Source: markets.ft.com - Click to enlarge |
EUR/USDThe five and 20-day moving averages crossed in the euro as well. Provided the $1.0480-$1.0500 area remains intact, the upside correction appears to remain intact. On the upside the $1.0600-$1.0620 blocks a test on the year-end high a little above $1.0650 and the post-Fed high near $1.0670.
|
EUR/USD Week January 07 with technical indicators(see more posts on Bollinger Bands, EUR/USD, MACDs Moving Average, RSI Relative Strength, Stochastics, )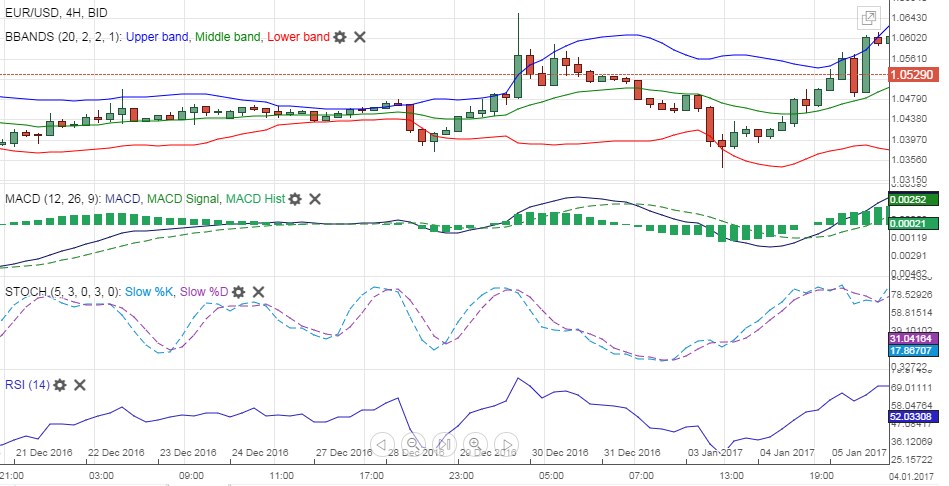 EUR/USD MACDS Stochastics Bollinger Bands RSI Relative Strength Moving Average January 07 - Click to enlarge |
USD/JPYThe dollar’s near-term peak against the yen was set on December 15 near JPY118.65. It fell to almost JPY115.00 before recovering after the US employment data. Ironically the moving averages also crossed down for the dollar for the first time since right after the US election. Provided the dollar stays below the JPY116.80-JPY117.25 band, the downside correction remains intact. If JPY115 breaks, the next target is found in the JPY114.25-JPY114.50 area. |
USD/JPY Week January 07 with technical indicators(see more posts on Bollinger Bands, Japanese yen, MACDs Moving Average, RSI Relative Strength, Stochastics, )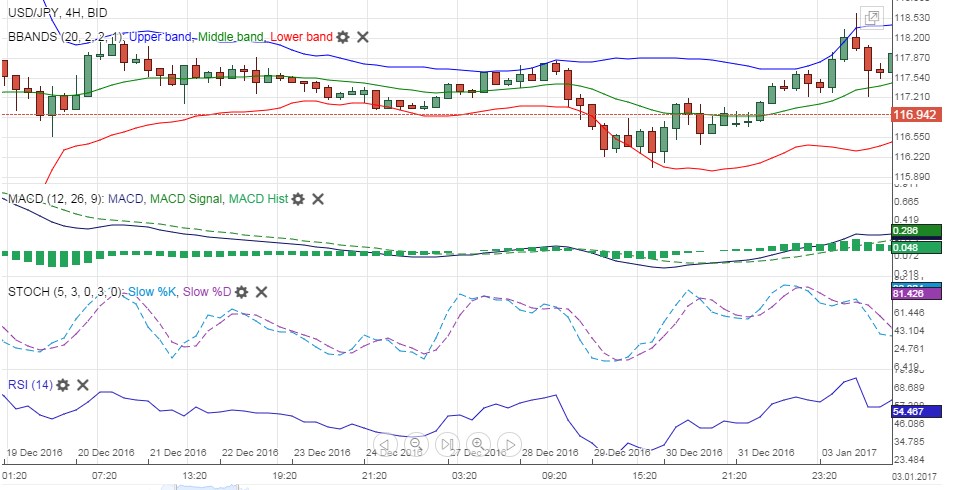 USD/JPY MACDS Stochastics Bollinger Bands RSI Relative Strength Moving Average January 07 - Click to enlarge |
GBP/USDDespite a series of robust economic reports, sterling continues to trade heavily. The five and 20-day moving averages have not crossed. Although a double bottom appears to be in place near $1.22, and neckline near $1.2400 was surpassed, it was not sustained. A break of $1.2280 is an early signal of another push lower. A push below $1.2200 could open the door to $1.2000-$1.2050.
|
GBP/USD Week January 07 with technical indicators(see more posts on Bollinger Bands, British Pound, MACDs Moving Average, RSI Relative Strength, Stochastics, )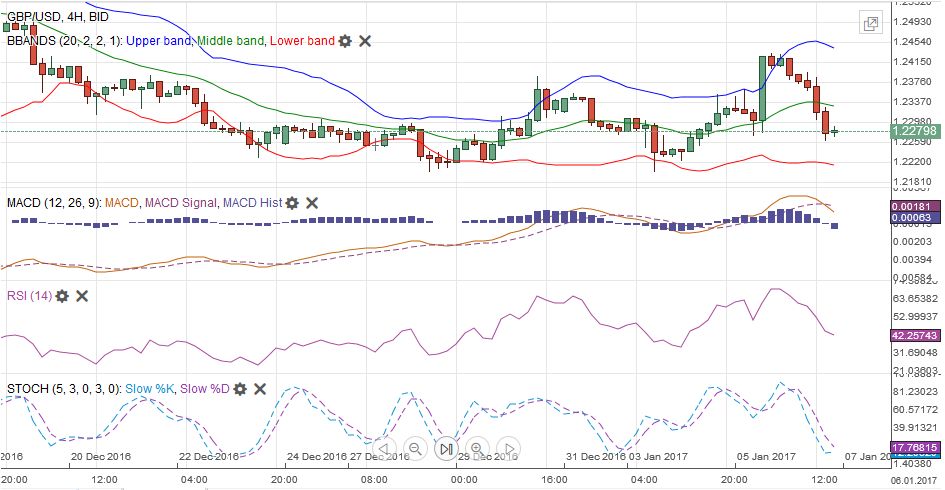 GBP/USD MACDS Stochastics Bollinger Bands RSI Relative Strength Moving Average January 07 - Click to enlarge |
AUD/USDThe Australian dollar carved out a bottom near $0.7160 over the last couple of weeks and bounced a little through $0.7350. The close before the weekend was poor, near session lows. A break below $0.7250 would be a preliminary sign that the upside correction is over. The technical indicators are constructive, though the five and 20-day moving averages have yet to cross higher.
|
AUD/USD Week January 07 with technical indicators(see more posts on Australian Dollar, Bollinger Bands, MACDs Moving Average, RSI Relative Strength, Stochastics, )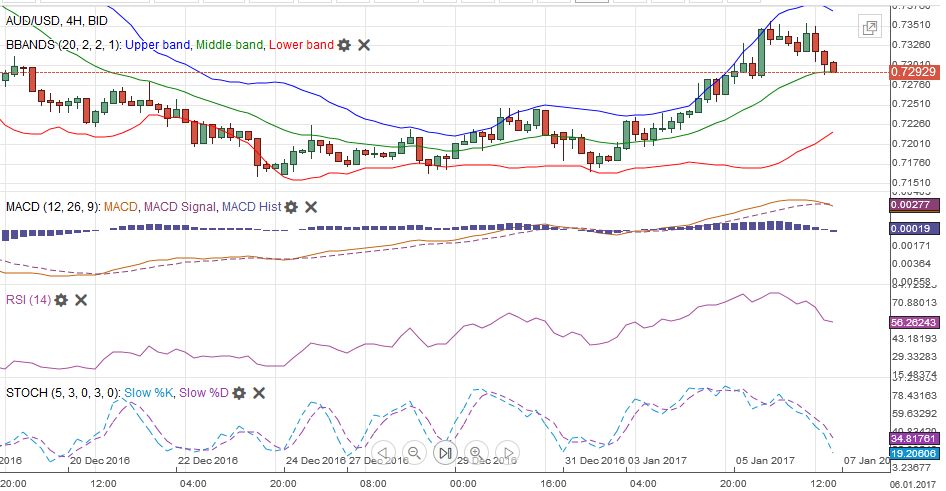 AUD/USD MACDS Stochastics Bollinger Bands RSI Relative Strength Moving Average January 07 - Click to enlarge |
USD/CADSince December 23, the Canadian dollar has been the strongest of the majors. Some are looking for a test on the 200-day moving average near CAD 1.3100. A move above CAD 1.3280 could be an early sign that a low may be in place.
|
USD/CAD Week January 07 with technical indicators(see more posts on Bollinger Bands, Canadian Dollar, MACDs Moving Average, RSI Relative Strength, Stochastics, )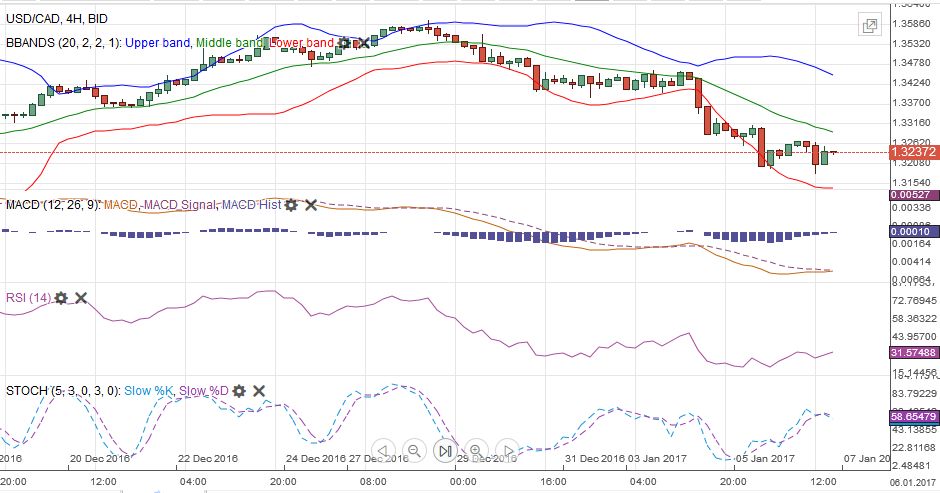 USD/CAD MACDS Stochastics Bollinger Bands RSI Relative Strength Moving Average January 07 - Click to enlarge |
Crude OilThe February light sweet crude oil futures contract finished last week with a three-session rally, allowing the winning streak to the fourth consecutive week and the fifth in the past six weeks. Reports suggesting that several OPEC producers are in fact cutting output, the unexpectedly large (~7 mln barrel ) drawdown in US inventories, and the cold weather in parts of the US and Europe helped support prices. The technical indicators remain mixed, though. The $52 area provides support. |
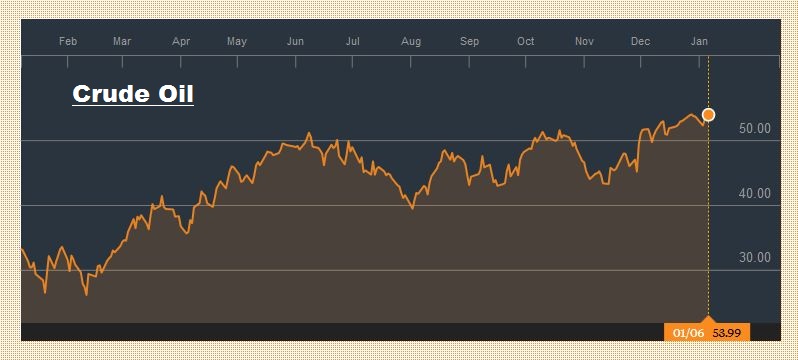 Source: bloomberg.com - Click to enlarge |
U.S. TreasuriesLast week we had suggested that the US 10-year yield could fall to the 2.35%-2.40% area. The yield dipped briefly below 2.34% ahead of the weekend, before moving higher on the back of the employment report and jump in hourly earnings. Nevertheless, it was not able to rise above the previous day’s high yield print (2.45%), and that was the third consecutive session of lower highs and lower lows. There is scope for the yield to rise to 2.45% and maybe 2.50%, perhaps in anticipation of a robust retail sales report at the end of next week. The March note futures approached the initial retracement objective near 124-07, below there support seen in the 123-14 to 123-28 area. |
Yield US Treasuries 10 years, January 07(see more posts on U.S. Treasuries, )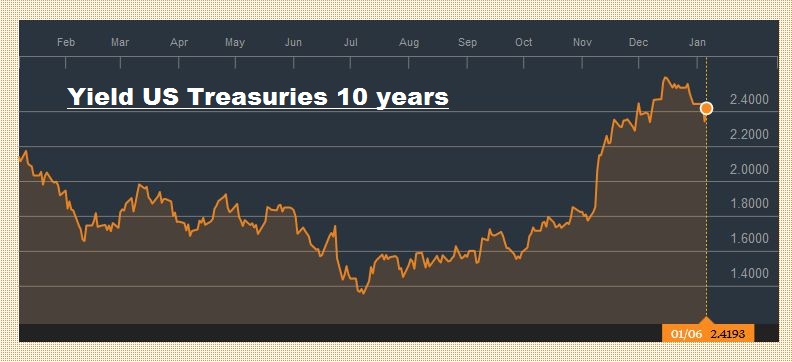 Source: bloomberg.com - Click to enlarge |
S&P 500 IndexThe S&P 500 set a new record high before the weekend. The saw tooth pattern of alternating weeks of advancing and declining remains intact since the last week in November. The NASDAQ also set new record highs. It also has risen on alternating weeks. The Dow Industrials continue to knock on the 20k level. Although there are still concerns about valuation, the technical tone looks constructive and gains next week would break the saw tooth pattern. Initial support in the S&P 500 is seen in the 2250-2260 area.
|
S&P 500 INDEX, January 07(see more posts on S&P 500 Index, )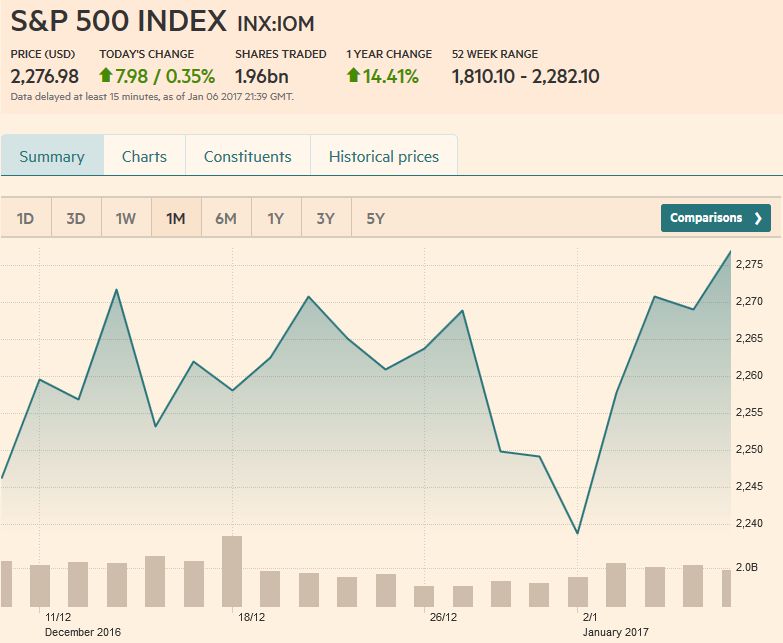 Source: markets.ft.com - Click to enlarge |
Are you the author?
Tags: Australian Dollar,Bollinger Bands,British Pound,Canadian Dollar,Crude Oil,Dollar Index,EUR/CHF,EUR/USD,Euro,Euro Dollar,Japanese yen,MACDs Moving Average,newslettersent,RSI Relative Strength,S&P 500 Index,Stochastics,Swiss Franc Index,U.S. Treasuries,usd-jpy,USD/CHF


