


George Dorgan
My articles My siteAbout meMy videosMy books
Follow on:LinkedINTwitterSeeking Alpha
CFA SocietyEconomicBlogs
Swiss Franc Currency IndexThe Swiss Franc index reduced its losses to 2 percent in the last month, while the dollar index is still 2.5 percent up.
|
Trade-weighted index Swiss Franc, December 16(see more posts on Swiss Franc Index, )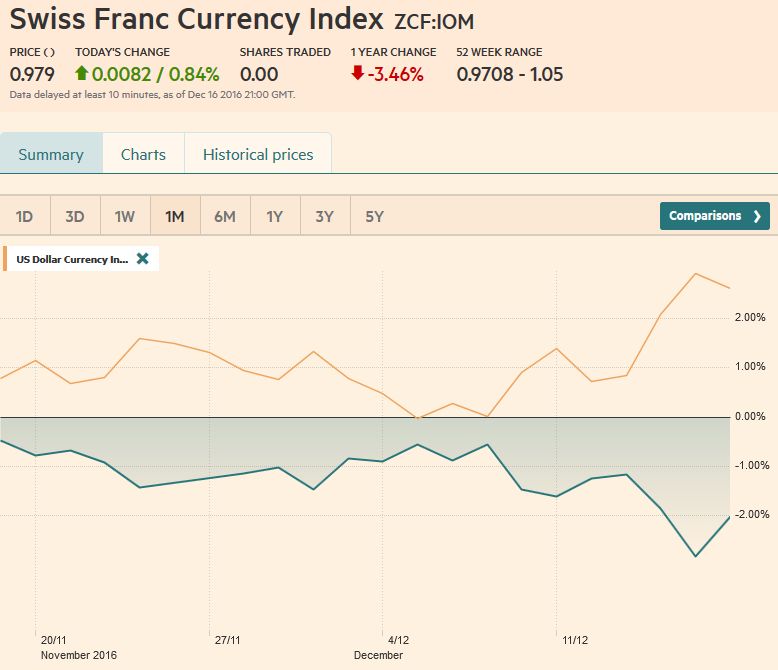 Source: FT.com - Click to enlarge |
The chart shows the massive advance of the dollar index in the last three years, while the Swiss Franc index lagged.
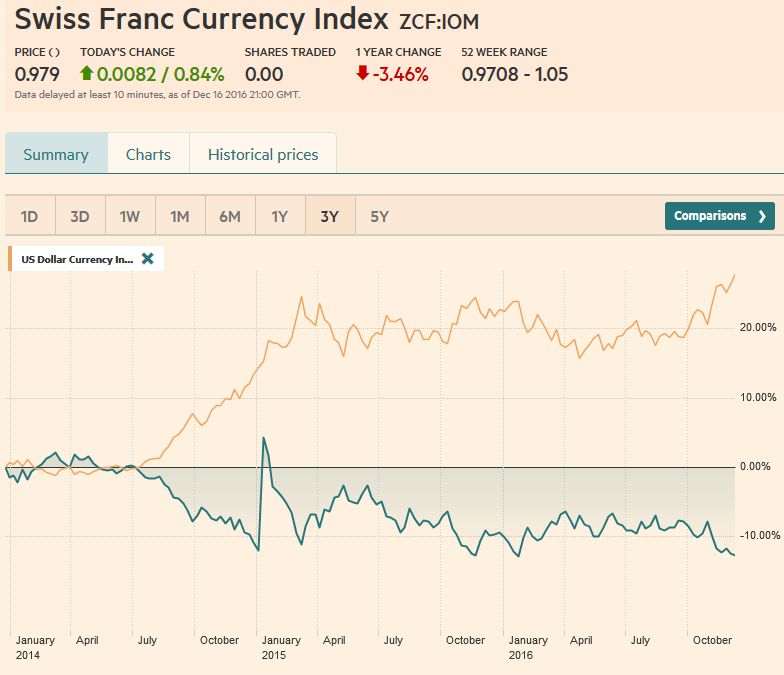
Swiss Franc Currency Index (3 years)The Swiss Franc index is the trade-weighted currency performance (see the currency basket)On a three years interval, the Swiss Franc had a weak performance. The dollar index was far stronger. The dollar makes up 33% of the SNB portfolio and 25% of Swiss exports (incl. countries like China or Arab countries that use the dollar for exchanges). Contrary to popular believe, the CHF index gained only 1.73% in 2015. It lost 9.52% in 2014, when the dollar (and yuan) strongly improved. |
 |
|
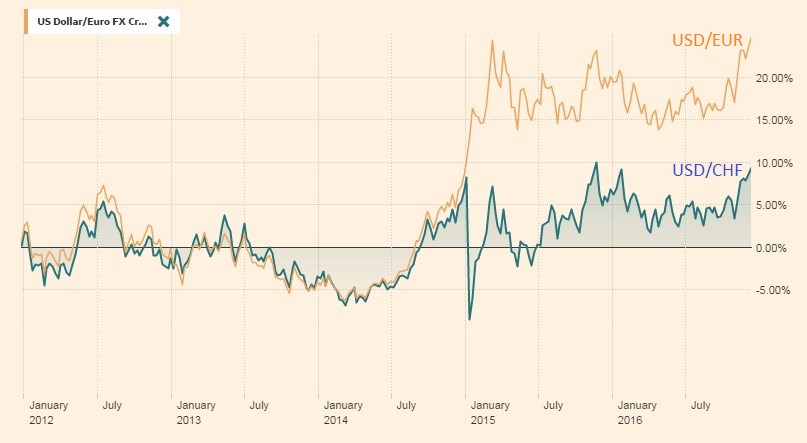
USD/CHFThe graph shows that the dollar has improved by 25% against the euro, but only by 10% against CHF over the last 3 years.
For the SNB it means that it has losses on the euro and on all other currencies. The only exception is the US dollar and this is where the SNB makes still profits on FX rates.
The USD/CHF is close to its highest rate since November 2015 and before in July 2010.
|
 |
|
Marc Chandler My articles My offerMy siteAbout meMy videosMy books Follow on:LinkedINTwitterSeeking AlphaAmazon US Dollar IndexThe small adjustment to Fed’s anticipated path for the Fed funds target helped lift the US dollar to its highest level against the euro since 2003, and to ten-month highs against the Japanese yen.
Corrective pressures may emerge amid the less active events calendar, lighter participation, and the stretched technical readings.
Although the Dollar Index rallied in response to the ECB meeting on December 8, it had stalled in front of 102, an area which had stymied it last year as well. However, with the Fed’s help it blew past the cap and recorded a high a little above 103.50. One of the considerations that give pause from a technical point of view is that the RSI, MACDs, and Slow Stochastics did not confirm the new high in price, and the fast Stochastics and RSI turned down before the weekend.
Initial support is seen near 102.50 and then 102. However, in anything but the short-term, we retain a favorable outlook for the Dollar Index. We anticipate a move to 105 early in the New Year. If it has been in a 90-100 range last year and most of this year, the breakout would suggest a 110 objective.
We place emphasis on two-year interest rate differentials in the euro-dollar exchange rate, it is important to recognize when it is about the level and when it is about the change in the level. In the short to medium term, the change in the level seems more important. Consider that the euro has fallen in seven of the past eleven weeks. Over this period, the two-year spread widened by nearly 50 bp. At over 200 bp, the US premium is the most since 2000. As businesses and investors think about 2017 investment decisions, including whether to hedge and what currency to borrow the interest rate differentials and the slope of the curves shape the incentive structure.
|
US Dollar Currency Index, December 16(see more posts on Dollar Index, )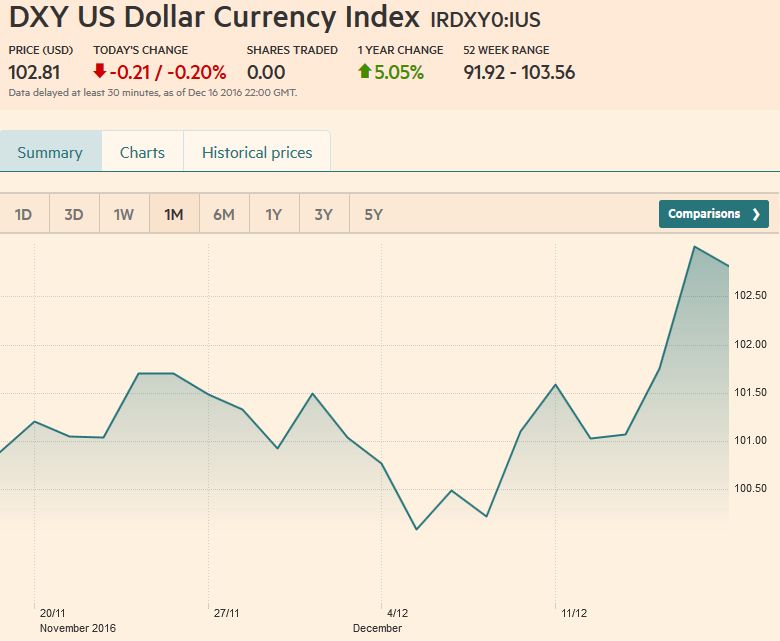 Source: FT.com - Click to enlarge |
EUR/USDThe euro has dropped a nickel since the high recorded in the knee-jerk response to the ECB’s announcement on December 8. It took the Fed hike and forward guidance to drive it through $1.05. It fell to about $1.0365 before a bout of short-covering was seen. Additional short-covering in the coming days could see the euro rise to the $1.0500-$1.0530 area, where sellers may emerge. A move through the $1.0560 area may be needed to signal a correction rather than consolidation. If the euro has been carving out a large rectangle pattern between $1.05 and $1.15, then a measuring objective of the break is $0.95.
|
Euro/US Dollar FX Spot Rate, December 16(see more posts on EUR/USD, )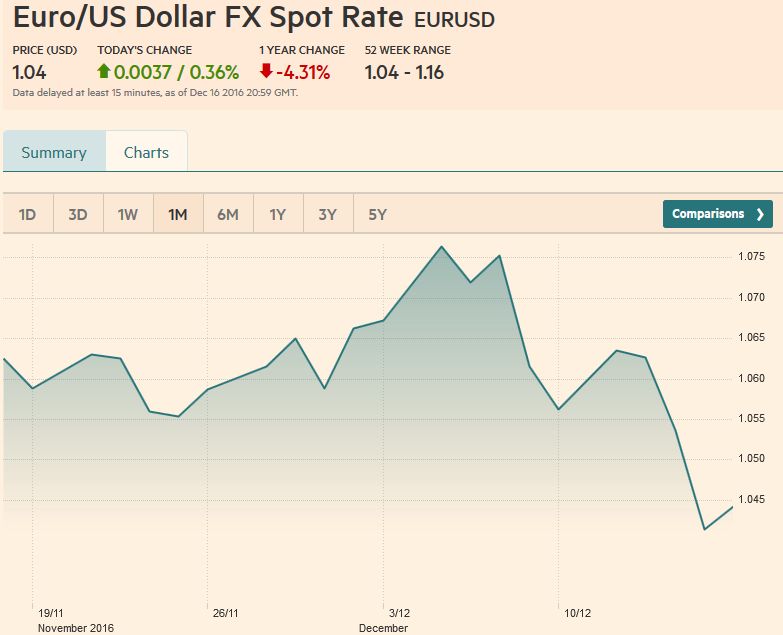 Source: FT.com - Click to enlarge |
USD/JPYThe US dollar continued to recoup the losses suffered against the yen in the first half. It has now rallied for six consecutive weeks, and 10 of the last 12 (meaning that the dollar’s move began before the election). Its current streak on the upside is longer than any streak on the downside since the greenback peaked in mid-2015.
Interest rate differential are at 8-9 year highs and this is helping fuel the dollar’s advance. The dollar finished October near JPY105. It hesitated around JPY115 in the first half of the month, but has now been lifted to JPY118.65. The market may be ready for a pause. Support is seen in the JPY116.75-JPY117.00 area. O the top side, our next target is JPY119.50-JPY120.00. Over the longer term, a return to the 2015 high above JPY126 seems increasingly likely.
|
US Dollar / Japanese Yen FX Spot Rate, December 16(see more posts on USD/JPY, )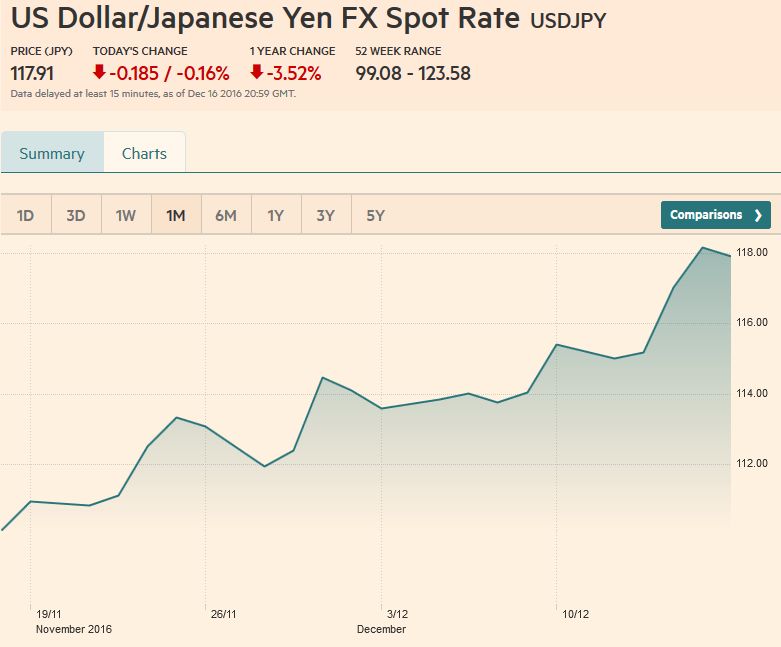 Source: FT.com - Click to enlarge |
GBP/USDSterling’s technicals have deteriorated in the face of the broad dollar rally. The five and 20-day moving averages are set to cross early next week for the first time since November 2. The MACDs and Slow Stochastics continue to trend lower. It also has broken the uptrend since the October lows, even if one dismisses the flash crash extreme. To expose the downside, the $1.2370 area needs to be convincingly violated. On the upside, a move above $1.2550 would suggest another run at the highs above $1.2700. |
UK Pound Sterling / US Dollar FX Spot Rate, December 16(see more posts on British Pound, )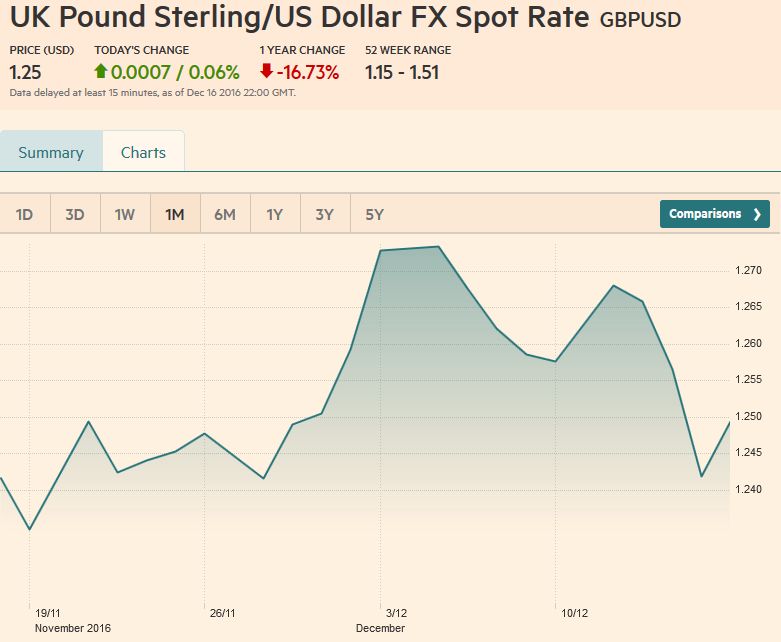 Source: FT.com - Click to enlarge |
AUD/USDThe Australian dollar took the FOMC on the chin, falling 3.5% from the pre-Fed high to the low before the weekend. That low near $0.7265 was a six-month low. Some suggest that the increased US tensions with China took a toll, but the lion’s share of the move was behind by the time it was announced that China had captured a US underwater drone in the South China Sea. If anything the most important domestic data for Australia was better than expected. It created net new full-time jobs after 45.7k in October. It is the strongest two-month full-time job creation since February-March 2011. It may hint of an upside risk to November retail sales (January 9).
We suspect that the US interest rate story was the main driver, and there continues to be lingering suspicions that the Reserve Bank of Australia may have to cut interest rates again next year. However, the move has been large and pushed the Aussie beyond its lower Bollinger Band. (~$0.7325). A move back to it may provide a better opportunity to position with the trend. Our next target is the May low near $0.7145. In the big picture, the advance by the Aussie from March through the middle of November was some kind of correction and now the downtrend has resumed. We look for a return to $0.6830 low from early this year.
|
Australian Dollar / US Dollar FX Spot Rate, December 16(see more posts on Australian Dollar, )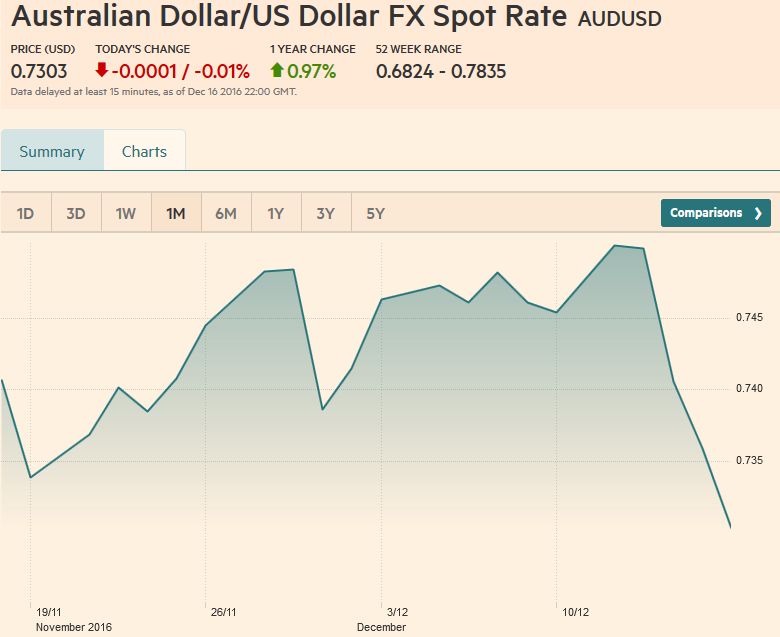 Source: FT.com - Click to enlarge |
USD/CADThe US dollar had completed its 61.8% retracment of the rally off the mid-August low against the Canadian dollar (~CAD1.2765) to almost the tick in the hours lead up to the FOMC decision. However, the greenback staged a key reversal and enjoyed follow-through buying. While it may stall around CAD1.34 in the short-term, the technical indicators suggest more upside potential that could see the US dollar re-test CAD1.36 area early in the New Year. |
US Dollar / Canadian Dollar FX Spot Rate, December 16(see more posts on Canadian Dollar, )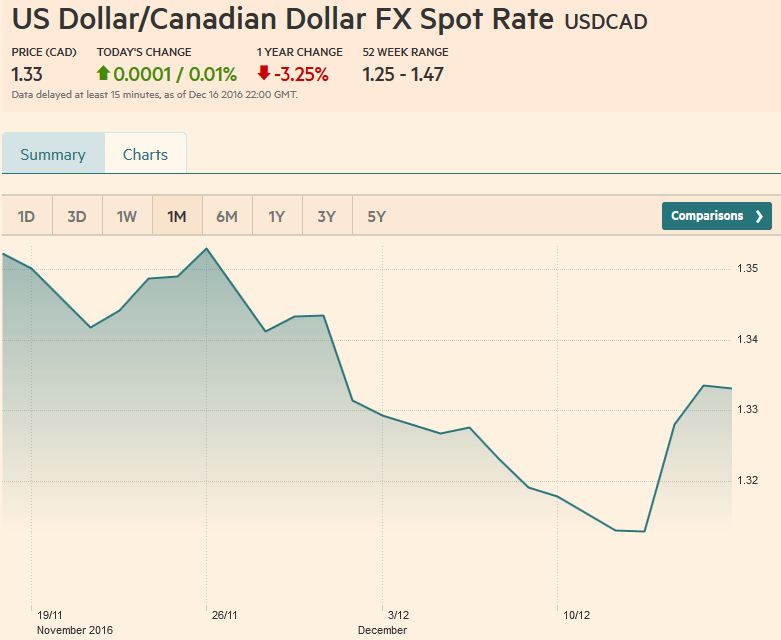 Source: FT.com - Click to enlarge |
Crude OilOil prices rallied before the weekend and it allowed the February light sweet oil futures contract to finish week with a modest 1% gain. It keeps the saw-tooth pattern intact of advancing in alternating weeks since mid-November. It has not closed below $50 a barrel this month and new buying was seen when it tested that area in the second half of last week. The technical indicators are mixed, and we suspect that the first leg of the correction is over and the bounce between corrective legs will probably fail to take out the recent high near $54.50. And then another attempt at $50 is likely. |
Crude Oil December 16(see more posts on Crude Oil, )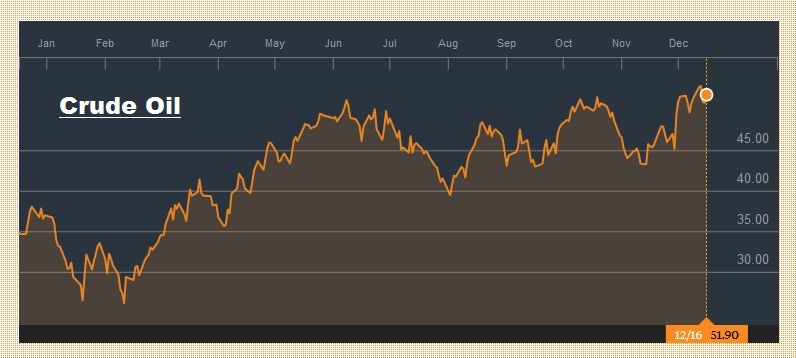 Source: Bloomberg.com - Click to enlarge |
U.S. TreasuriesIt is amazing how well the world economy and financial markets have taken a tremendous rise of the 10-year US yield. It finished July at 1.45%. It was 1.58% at the end of August little changed in September. In October, the yield rose 13 bp to 1.82% before surging 55 bp in November to 2.38%. In the first half of December is it up another 22 bp. Although the 2.75%-2.80% may draw some interest, it is the 3.0% area that many seem to be anticipating. The March 2017 note futures contract may be headed for the 2014 lows on the continuation contract near 122-20. A break there brings the price back to 2011 levels. Caution is in order. There has been a big move and neither the RSI nor the MACDs have confirmed it, and the March contract finished below its lower Bollinger Band. |
Yield US Treasuries 10 years, December 16(see more posts on U.S. Treasuries, )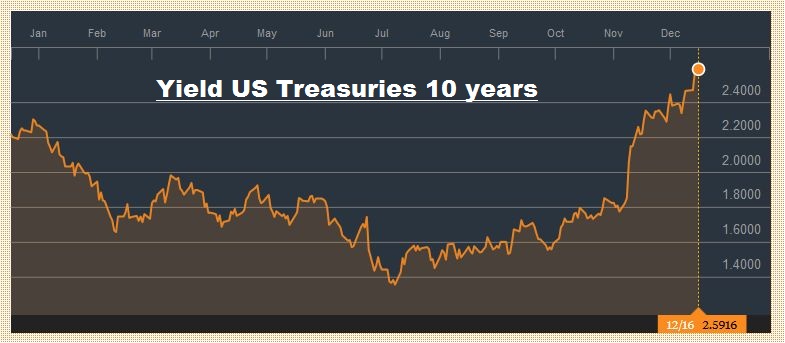 Source: Bloomberg.com - Click to enlarge |
S&P 500 IndexThe S&P 500 has carved out a little pennant over the past three sessions. It is usually a continuation pattern and suggests potential for about 25 points to the upside that would bring the S&P 500 to 2300. The MACDs and Slow Stochastics are about to turn lower, suggesting that if the leg up does materialize it may be the last before a consolidative or corrective phase is seen. On the other hand, a break of the 2248-2250 area would warn of a move toward 2220 initially.
|
S&P 500 Index, December 16(see more posts on S&P 500 Index, )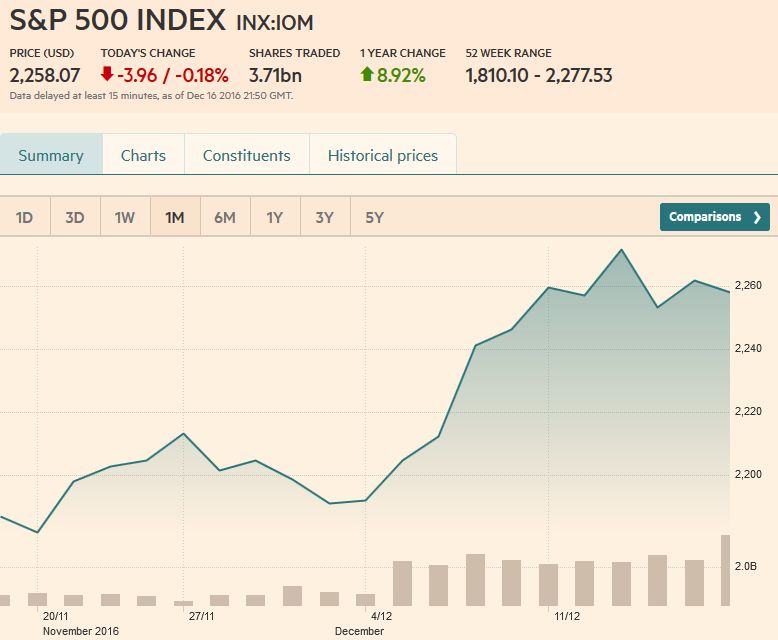 Source: FT.com - Click to enlarge |
Are you the author?
Tags: Australian Dollar,British Pound,Canadian Dollar,Crude Oil,Dollar Index,EUR/CHF,EUR/USD,Euro,Euro Dollar,Japanese yen,MACDs Moving Average,newslettersent,S&P 500 Index,Swiss Franc Index,U.S. Treasuries,usd-jpy,USD/CHF,USD/JPY


