


George Dorgan
My articles My siteAbout meMy videosMy books
Follow on:LinkedINTwitterSeeking Alpha
CFA SocietyEconomicBlogs
Marc Chandler
My articles My offerMy siteAbout meMy videosMy books
Follow on:LinkedINTwitterSeeking AlphaAmazon
Summary
The US dollar fell against most of the major currencies in Q3. The Norwegian krone was the best performer, gaining 4.4% against the greenback. It was helped by higher oil prices and a shift away from an easing bias by the central bank. The relatively high interest rates offered by Australia and New Zealand underpinned their currencies, which gained 2.7% and 2.0% respectively.
Swiss Franc Currency IndexThe Swiss Franc currency index has performed in the last week of September. Only on Friday, at quarter end the CHF depreciated again. If the reason was an SNB intervention, purchases of euro-denominated Deutsche Bank stocks or the closing of long CHF speculative positions remains unclear until Monday.
|
Trade-weighted index Swiss Franc 1 Month(see more posts on Swiss Franc Index, )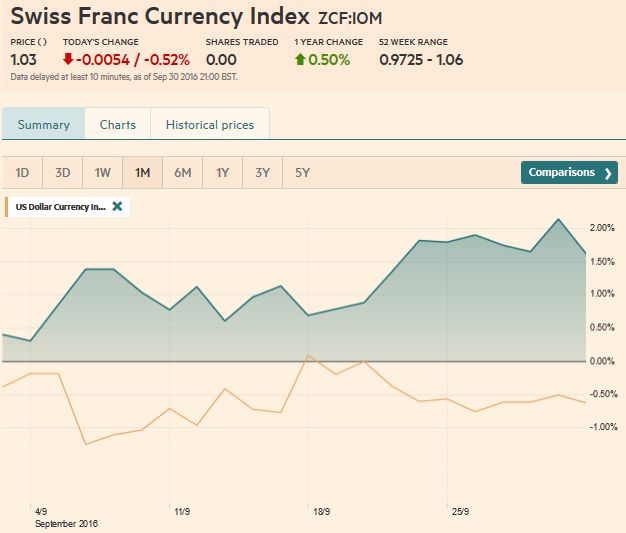 Swiss Franc Index Trade-weighted index Swiss Franc 1 Month, - Click to enlarge |
|
Swiss Franc Currency Index (3 years)The Swiss Franc index is the trade-weighted currency performance (see the currency basket)On a three years interval, the Swiss Franc had a weak performance. The dollar index was far stronger. The dollar makes up 33% of the SNB portfolio and 25% of Swiss exports (incl. countries like China or Arab countries that use the dollar for exchanges). Contrary to popular believe, the CHF index gained only 1.73% in 2015. It lost 9.52% in 2014, when the dollar (and yuan) strongly improved.
|
Swiss Franc Currency Index(see more posts on Swiss Franc Index, )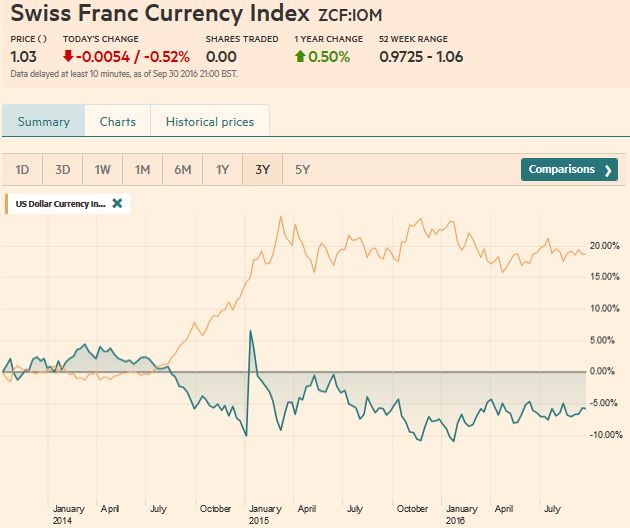 Swiss Franc Currency Index September 30, 2016 - Click to enlarge |
USD/CHF
|
US Dollar - Swiss Franc FX Spot Rate(see more posts on USD/CHF, )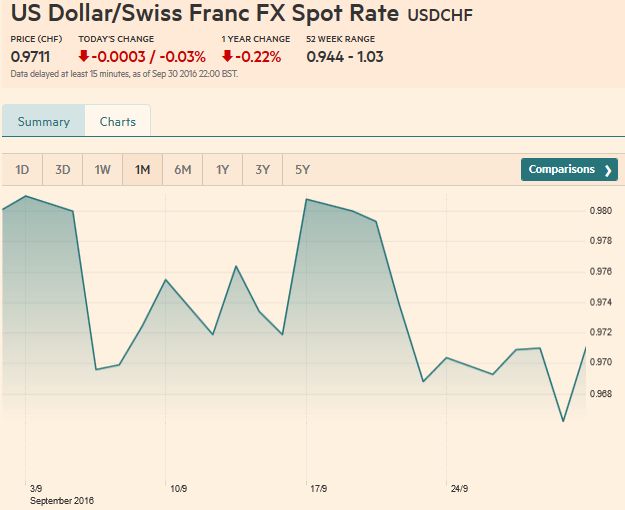 US Dollar – Swiss Franc FX Spot Rate - Click to enlarge |
US Dollar IndexThe most important technical consideration in the Dollar Index is the trendline connecting the early-May low, the late-June low, a couple of lows from the second half of August, the early September low.
That trendline is just below 95.00 at the start of next week and
is rising about one tick a day. The initial target on a break is the September low near 94.45. Resistance is seen around 96.00. The ceiling has frayed but not on sustained basis.
|
US Dollar Currency Index(see more posts on Dollar Index, )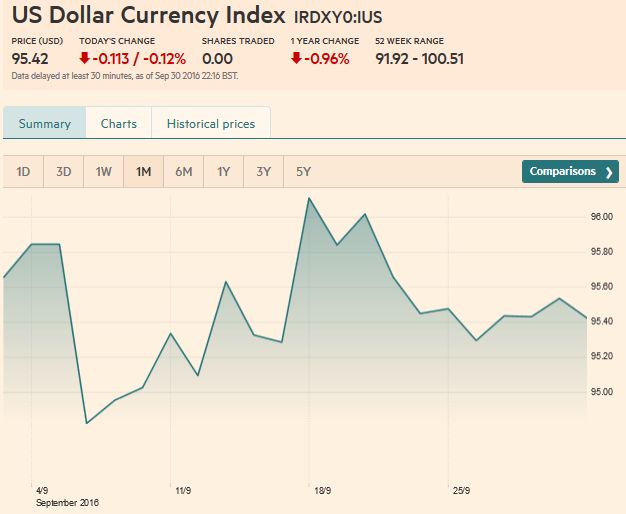 U.S. Dollar Currency Index - Click to enlarge |
EUR/USDHelped by an upside reversal in Deutsche The price action is constructive, but the single currency remains in a two-cent range between $1.1100 and $1.1300 that confined the price action with only one exception in September. Note that the trendline we identified in the Dollar Index can be found in the euro, which is its biggest component. It is found near $1.1270 at the start of next week and falls about three ticks a day. |
Euro/US Dollar FX Spot Rate(see more posts on EUR/USD, )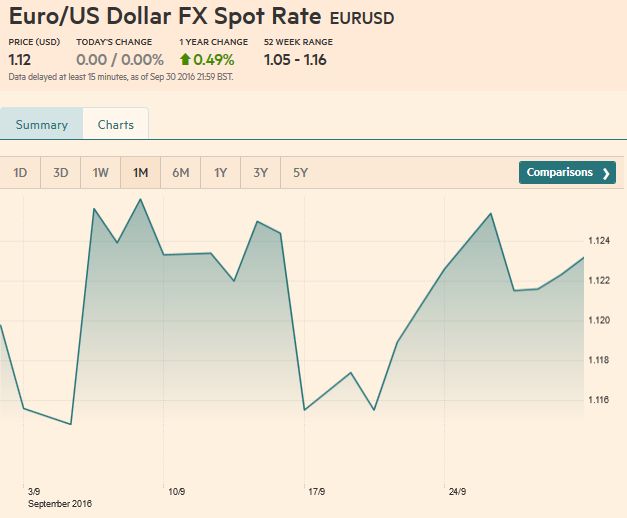 Euro/US Dollar FX Spot Rate - Click to enlarge |
USD/JPYThe dollar looks firm against the yen after the JPY100 level was repeatedly tested. However, the upside may be blocked near JPY102.00. A trendline connecting the September highs comes in just below there at the start of next week and corresponds to the 50-day moving average. The trendline is falling about 10 ticks a day. Of note, the dollar-yen rates appears to have become decoupled from the stock market. The rolling 60-day correlation between dollar-yen and the S&P 500 has fallen to 0.1, the lowest since the middle of 2015. |
US Dollar Japanese Yen FX Spot Rate(see more posts on USD/JPY, )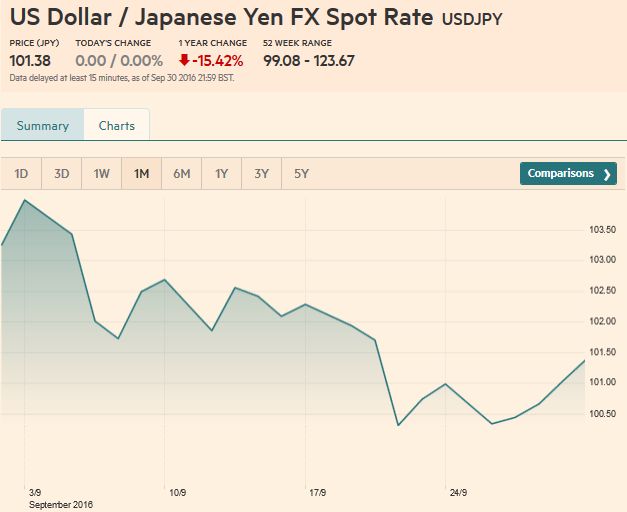 US Dollar Japanese Yen FX Spot Rate - Click to enlarge |
GBP/USD
|
UK Pound Sterling / US Dollar FX Spot Rate(see more posts on British Pound, )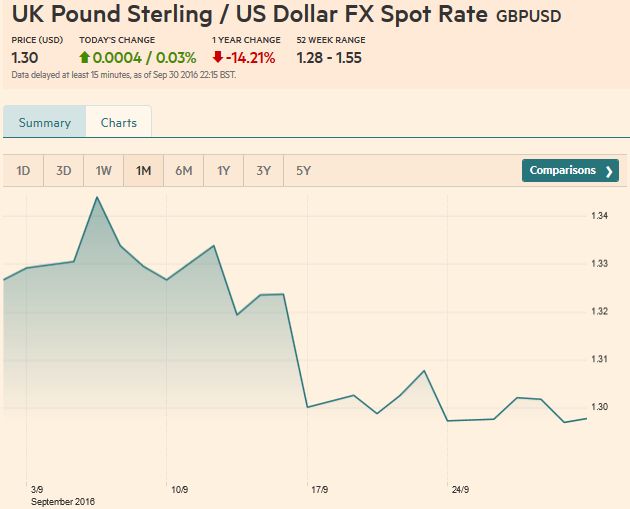 UK Pound Sterling / US Dollar FX Spot Rate - Click to enlarge |
AUD/USDThe Australian dollar posted an outside down day on September 29 after briefly poking through the $0.7700 cap. Follow through selling on September 30 to $0.7590 before rebounding smartly. The challenge in the coming sessions is for the Aussie to establish a foothold above the $0.7700 nemesis. The RBA meeting on October 3, which is the first that Governor Lowe will preside. While rates are on hold, Lowe might express some frustration with the Aussie’s strength. The failure to do so would likely embolden the bulls. |
AUD/USD FX Rate Chart(see more posts on Australian Dollar, )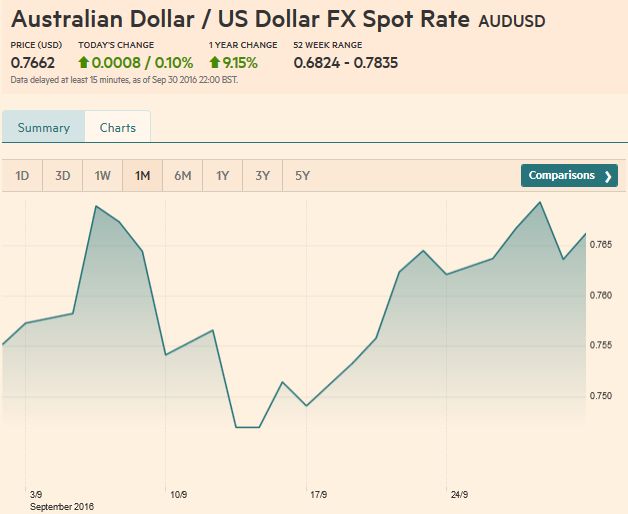 Australian Dollar / US Dollar FX Spot Rate - Click to enlarge |
USD/CADThe US dollar rose to its highest level against the Canadian dollar since March at the start of last week. The unexpected, but vague, OPEC deal helped the Canadian dollar recover. After nearing CAD1.33 in the first half of the week, the US dollar finished near CAD1.3100. There is potential toward CAD1.30. |
USD/CAD FX Rate Chart(see more posts on Canadian Dollar, )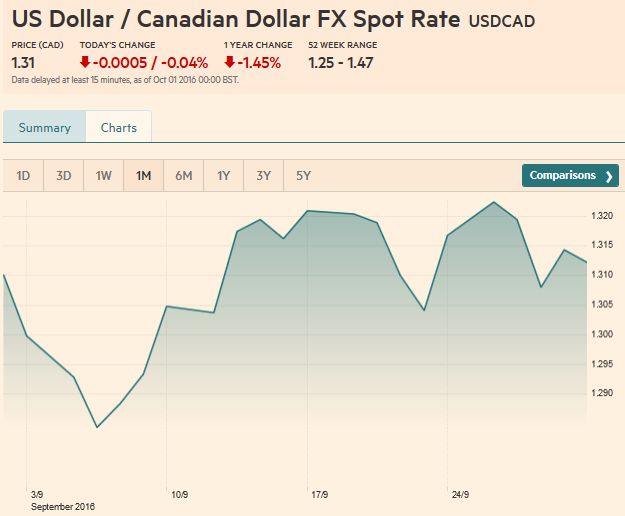 US Dollar / Canadian Dollar FX Spot Rate - Click to enlarge |
Crude Oil
|
Crude Oil Chart(see more posts on Crude Oil, )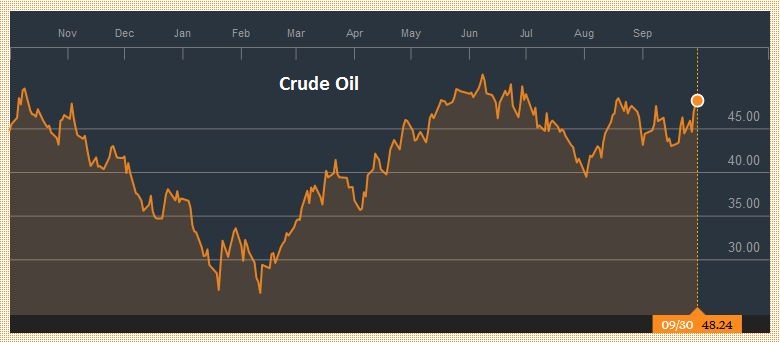 Crude Oil - Click to enlarge |
U.S. TreasuriesThe US 10-year yield fell from 1.75% in mid-September to a low near 1.53% before the weekend.
However, the recovery of bank shares helped lift the yield back to 1.60%. There is scope for the yields to increase next week on the back of data, culminating in what we expected to be a healthy jobs report.
The December note futures made new highs for the move before selling off ahead of the weekend. Initial support is seen in the 130-25 to 131-00 band. A break of 130-16 is needs to suggest a more important high in price (low in yield) may be in place.
|
Yield US Treasuries 10 years(see more posts on U.S. Treasuries, )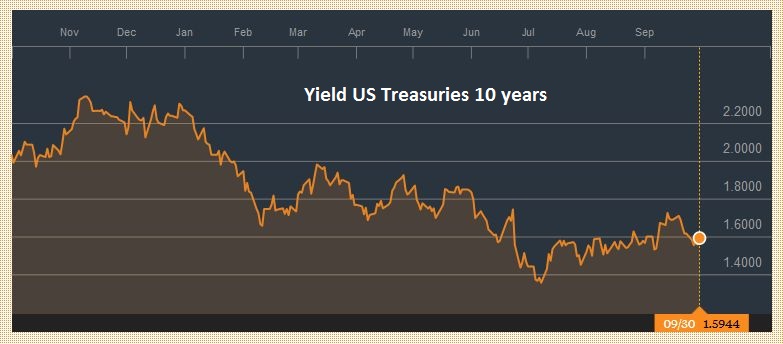 Yield US Treasuries 10 years - Click to enlarge |
S&P 500 Index
|
S&P 500 Index(see more posts on S&P 500 Index, )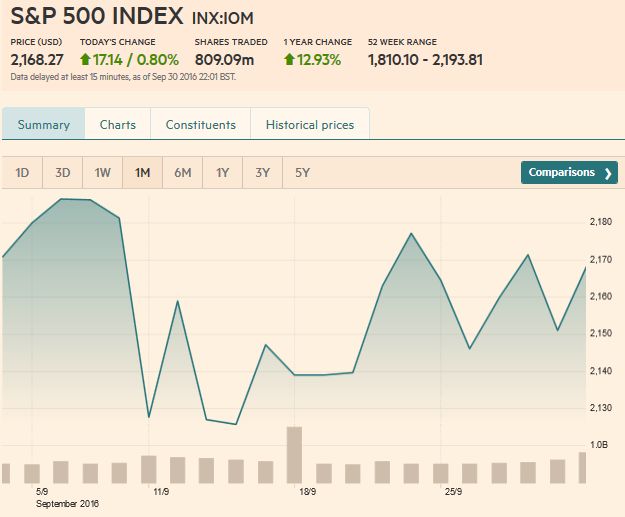 S&P 500 Index September 30, 2016 - Click to enlarge |
Are you the author?
Tags: Australian Dollar,British Pound,Canadian Dollar,Crude Oil,Dollar Index,EUR/CHF,EUR/USD,Euro,Japanese yen,MACDs Moving Average,newslettersent,S&P 500 Index,Swiss Franc Index,U.S. Treasuries,usd-jpy,USD/CHF,USD/JPY


