


George Dorgan
My articles My siteAbout meMy videosMy books
Follow on:LinkedINTwitterSeeking Alpha
CFA SocietyEconomicBlogs
Swiss Franc Currency IndexThe Swiss Franc index was lagging once again compared to the dollar index. The dollar index is up exactly 3% this month, while the CHF index is down 2%. The EUR/CHF has reached the SNB intervention area at the “new floor area of 1.08 to 1.0850. On Monday we will learn about the latest SNB interventions in our weekly sight deposits.
|
Trade-weighted index Swiss Franc, October 22 2016(see more posts on Swiss Franc Index, )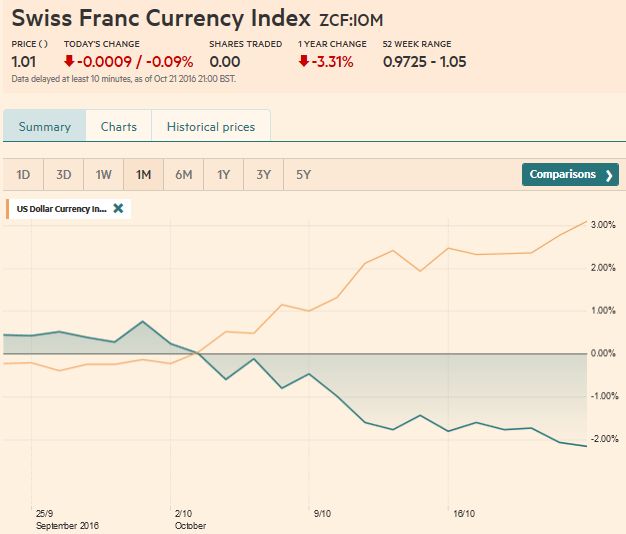 . - Click to enlarge |
|
Swiss Franc Currency Index (3 years)The Swiss Franc index is the trade-weighted currency performance (see the currency basket)On a three years interval, the Swiss Franc had a weak performance. The dollar index was far stronger. The dollar makes up 33% of the SNB portfolio and 25% of Swiss exports (incl. countries like China or Arab countries that use the dollar for exchanges). Contrary to popular believe, the CHF index gained only 1.73% in 2015. It lost 9.52% in 2014, when the dollar (and yuan) strongly improved.
|
Swiss Franc Currency Index, October 22 2016(see more posts on Swiss Franc Index, )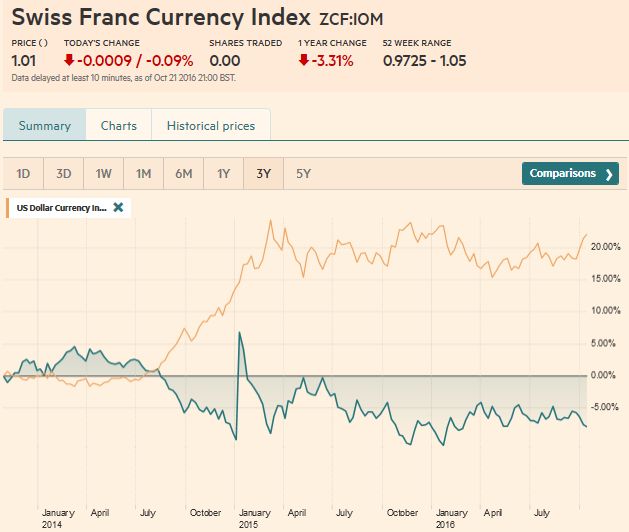 . - Click to enlarge |
Marc Chandler My articles My offerMy siteAbout meMy videosMy books Follow on:LinkedINTwitterSeeking AlphaAmazon The US dollar had another good week; rising against most of the major currencies. Among the majors, the relatively high yield and modest easing of near-term rate cut speculation allowed the New Zealand dollar to shine, rising a little more than 1% last week. The yen also strengthened in the four sessions last week for a 0.4% gain.
|
US Dollar - Swiss Franc FX Spot Rate, October 22 2016(see more posts on USD/CHF, )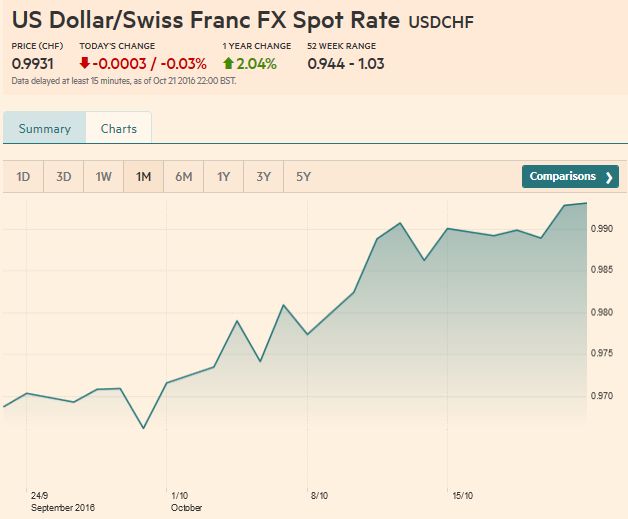 . |
US Dollar IndexThe Dollar Index rallied to seven-month highs ahead of the weekend. It is about one percent from the year’s high set in late-January, a little below 100.00.
A week ago, the Dollar Index was bumping against its upper Bollinger Band. This helped us anticipate the sideways movement at the start of the new week. Now that upper band is found near 99.10. Initial support now is seen near 98.20. We note that the 50-day moving average crossed above the 200-day moving average, which technicians refer to as the “Golden Cross.” Other technical indicators suggest additional upside potential.
In the euro, which is the largest component of
the Dollar Index, the same moving averages will cross to the downside early next week. The crossing of the 50-day moving average below the 200-day moving average is dubbed the “deadman’s cross”.
|
US Dollar Currency Index Dollar Index, October 22 2016(see more posts on Dollar Index, )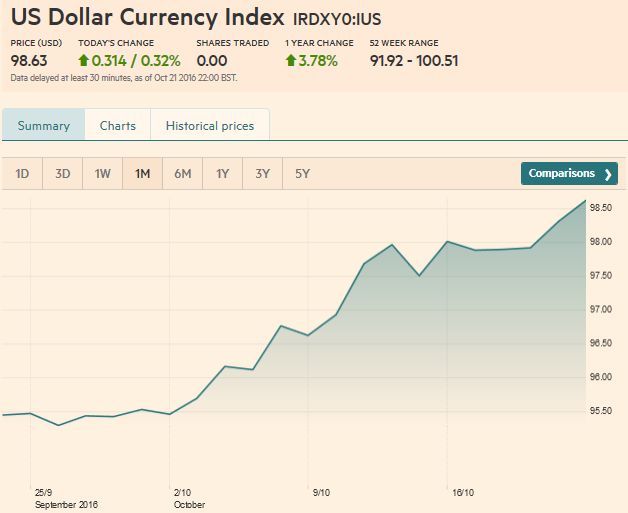 . - Click to enlarge |
EUR/USDAfter briefly consolidating in the first part of the week, the greenback closed the week near its best levels, especially against the European currencies.
The main consideration seems to the
contrast between Fed officials like Fischer and Dudley who have been signaling a rate hike before the end of the year, while the ECB has arguably signaled a likely extension of its asset purchases. The euro broke the trendline off the January, June and July lows on October 12. It retested it from below on seeming confusion during the ECB’s press conference (algos?). After setting new highs
for the week, the euro reversed lower and posted an outside down day. Follow through selling was seen before the weekend. The next immediate target is $1.08 and then $1.0710. There is an increasing chance of seeing a move closer to $1.05 before the end of the year. The RSI and MACDs allow for additional dollar losses, though the Slow Stochastics are set to turn higher. The euro closed the week hugging its lower Bollinger Band ($1.0870).
|
Euro/USDollar FX Spot Rate, October 22 2016(see more posts on EUR/USD, ) . - Click to enlarge |
USD/JPY
The dollar snapped a three-week advance against the yen and fell in four of last week’s five sessions. The greenback rallied from near JPY100 in late-September to JPY104.20 on October 13. It may be tracing out a small head and shoulders top, with an upwardly slowing neckline, found near JPY103.15 on Monday, October 23. The The MACD is poisedto roll-over early next week. The RSI is neutral near 56. |
US Dollar Japanese Yen FX Spot Rate, October 22 2016(see more posts on USD/JPY, )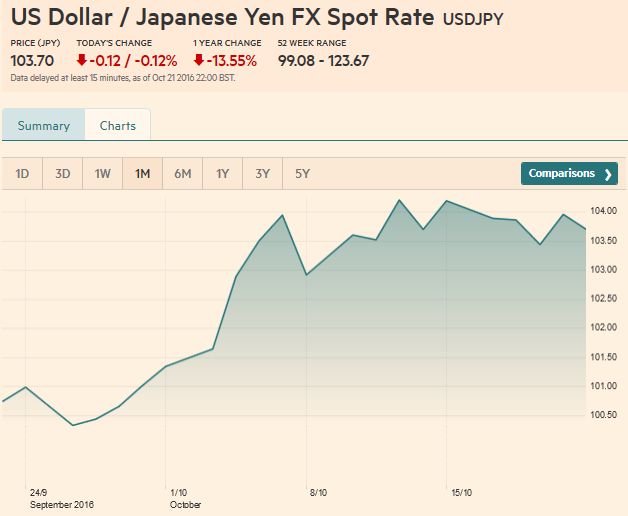 . - Click to enlarge |
GBP/USDSince the flash crash on October 7, sterling has been Having tested the upside a few ,days ago (~$1.2330), it is poised to test the lower end next week. However, the technical indicators warn against expectations of steep losses. The Slow Stochastics have crossed higher, while the MACDs are set to turn up early next week. Choppy, but broadly sideways trading seems like the most likely near-term scenario.
|
UK Pound Sterling / US Dollar FX Spot Rate, October 22 2016(see more posts on British Pound, )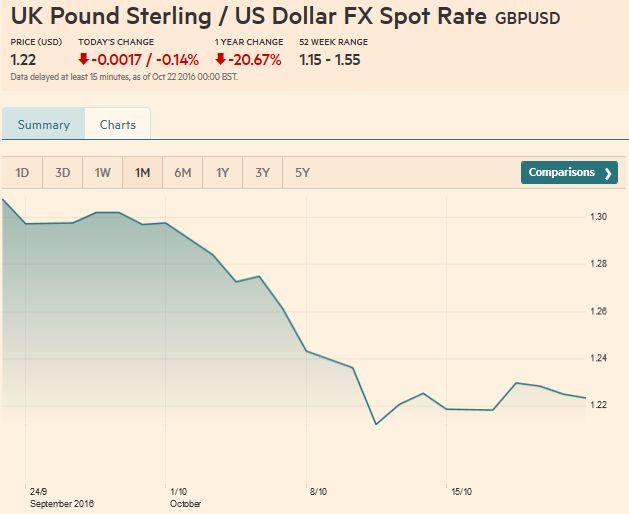 . - Click to enlarge |
AUD/USDPoor employment data reinforced the significance of the $0.7700 ceiling for the Australian dollar. It posted a potential key downside reversal on October 20 and fell further ahead of the weekend. A break of the $0.7590 area warns potential toward $0.7500. The technical indicators are not generating strong signals
|
AUD/USD FX Rate Chart, October 22 2016(see more posts on Australian Dollar, )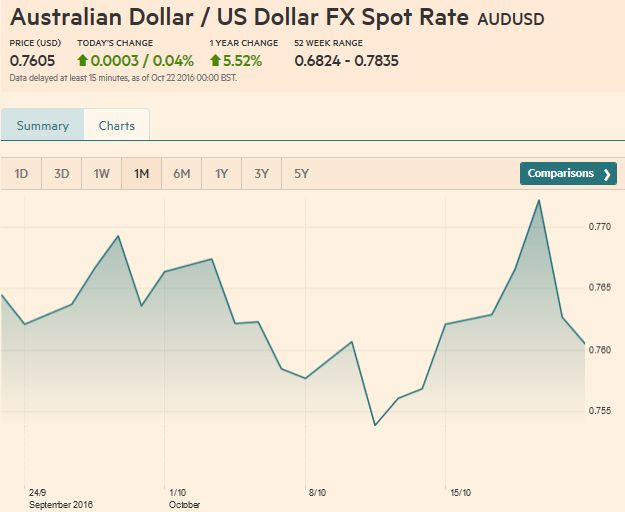 . - Click to enlarge |
USD/CADAfter testing the CAD1.30 level on October 19,
|
USD/CAD FX Rate Chart, October 22 2016(see more posts on Canadian Dollar, )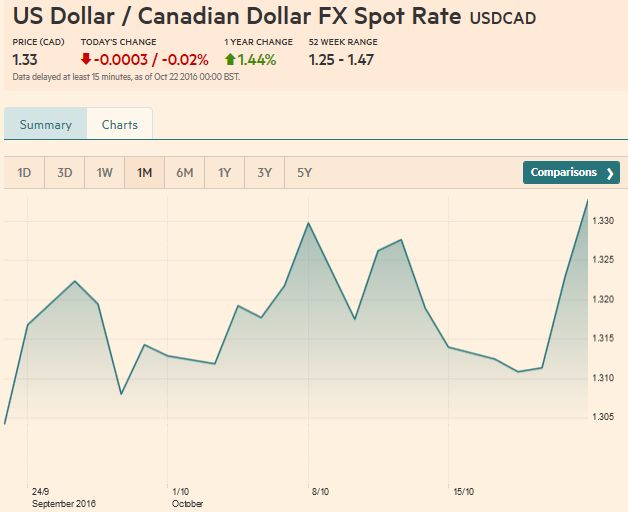 . - Click to enlarge |
Crude OilThe December light sweet crude oil futures |
Crude Oil, October 22 2016(see more posts on Crude Oil, )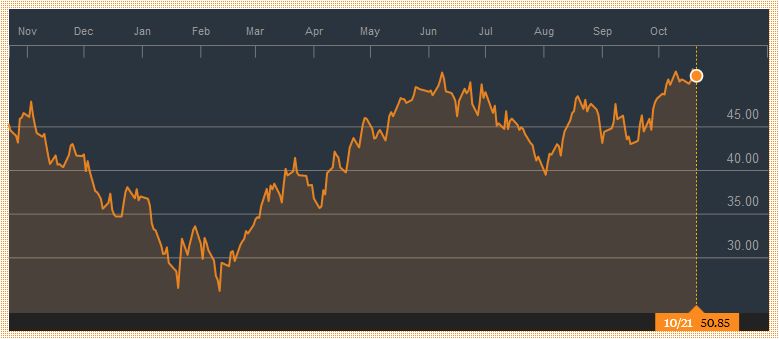 . - Click to enlarge |
U.S. TreasuriesUS 10-year Treasury yields are also moving
|
Yield US Treasuries 10 years, October 22 2016(see more posts on U.S. Treasuries, )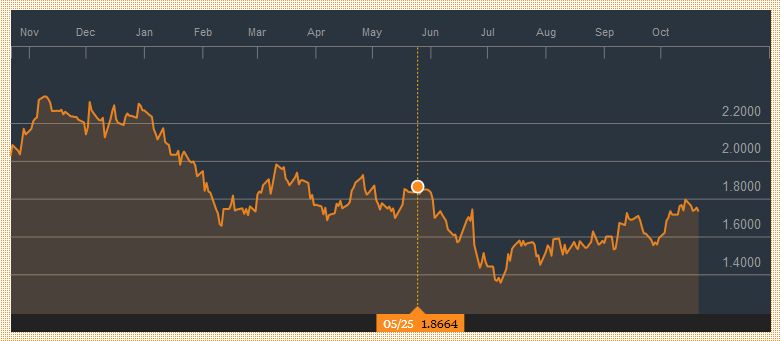 . - Click to enlarge |
S&P 500 Index
|
S&P 500 Index, October 22 2016(see more posts on S&P 500 Index, )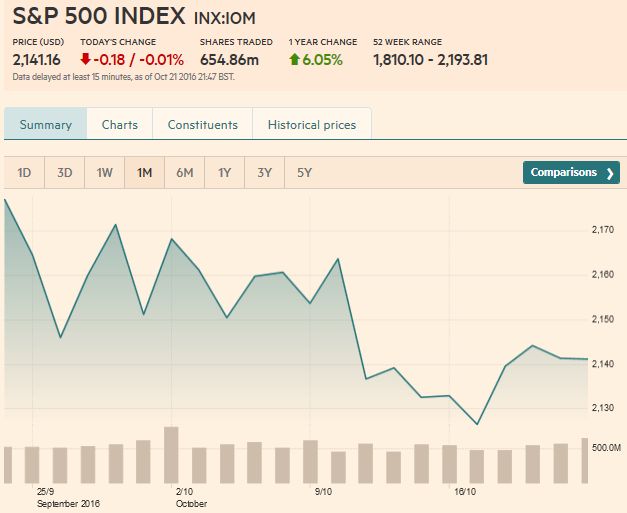 . - Click to enlarge |
Are you the author?
Tags: Australian Dollar,British Pound,Canadian Dollar,Crude Oil,Dollar Index,EUR/CHF,EUR/USD,Euro,Japanese yen,MACDs Moving Average,newslettersent,S&P 500 Index,Swiss Franc Index,U.S. Treasuries,usd-jpy,USD/CHF,USD/JPY


