


George Dorgan
My articles My siteAbout meMy videosMy books
Follow on:LinkedINTwitterSeeking Alpha
CFA SocietyEconomicBlogs
Swiss Franc Currency IndexThe Swiss Franc index had once again a bad stance against the dollar index. The CHF index was down 1%. The dollar index, however, improved.
|
Trade-weighted index Swiss Franc, October 15 2016(see more posts on Swiss Franc Index, )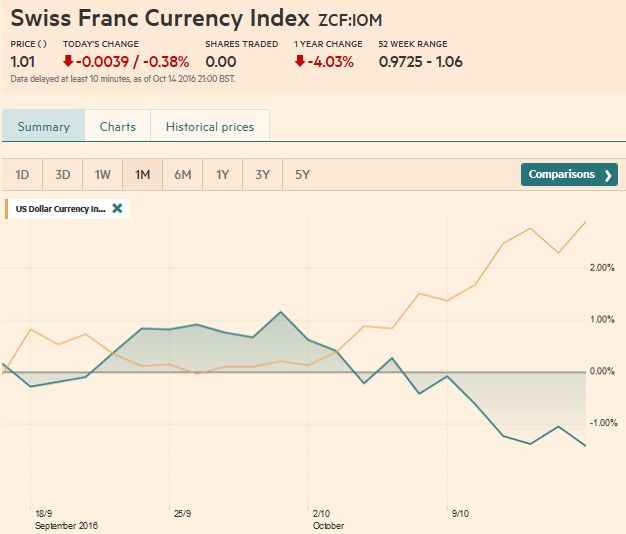 . - Click to enlarge |
|
Swiss Franc Currency Index (3 years)The Swiss Franc index is the trade-weighted currency performance (see the currency basket)On a three years interval, the Swiss Franc had a weak performance. The dollar index was far stronger. The dollar makes up 33% of the SNB portfolio and 25% of Swiss exports (incl. countries like China or Arab countries that use the dollar for exchanges). Contrary to popular believe, the CHF index gained only 1.73% in 2015. It lost 9.52% in 2014, when the dollar (and yuan) strongly improved.
|
Swiss Franc Currency Index, October 15 2016(see more posts on Swiss Franc Index, )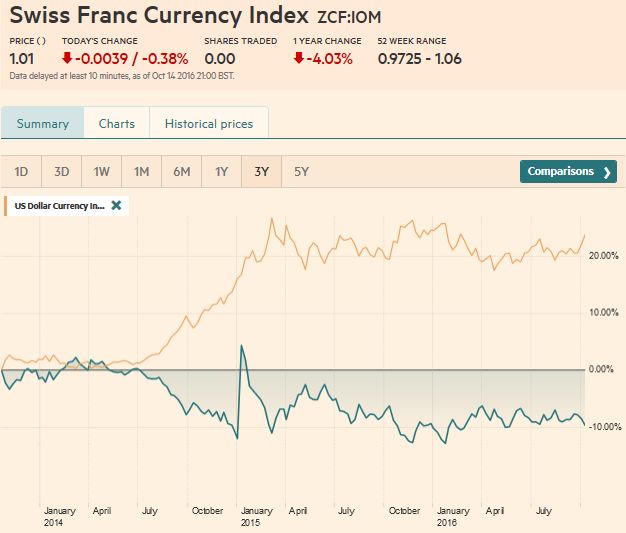 Swiss Franc Currency Index October 15, 2016 - Click to enlarge - Click to enlarge |
Marc Chandler My articles My offerMy siteAbout meMy videosMy books Follow on:LinkedINTwitterSeeking AlphaAmazon
The US dollar rose against the major currencies last week, except the Australian and Canadian dollars, which remained resilient in the face of higher US rates and weaker Chinese imports. Some attribute the Aussie and Loonie’s gains to the fourth consecutive weekly gain in oil and the CRB Index.
The backing up of US rates cannot simply be reduced to expectations of a hike before the end of the year. By Bloomberg’s calculation that odds have risen from 50.6% at the end of September to 56.6% now. Inflation expectations also appear to be rising. The 10-year breakeven (the difference between conventional yield and the TIPS) have risen steadily since mid-September when it was below 1.50%. It almost reached 1.7% last week, a six-month high.
Another market measure is the five-year five-year forward. It too reached a six-month high. It is consolidating after pushing through 1.86%.
|
US Dollar - Swiss Franc FX Spot Rate, October 15 2016(see more posts on USD/CHF, )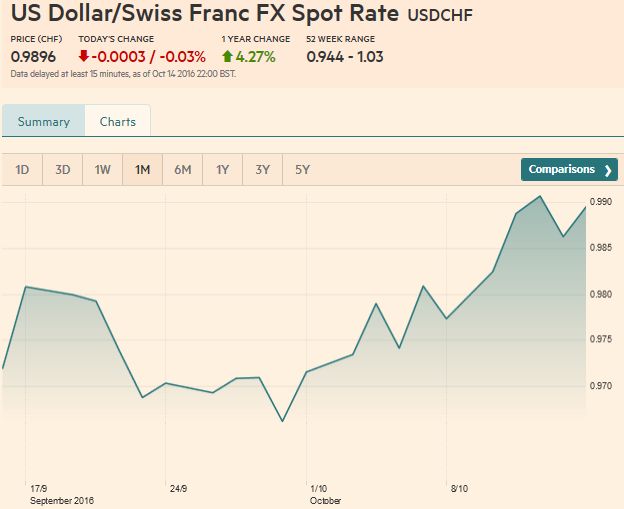 . |
US Dollar IndexThe Dollar Index rose to its best level since March. It reached the high in the second half of last week by briefly poking above 98.00. Initial support is seen near 97.40. Recall that it closed September a little above 95.45. The RSI, MACDs, and Slow Stochastics allow for additional gains, but the levels are getting stretched. The Dollar Index is also bumping up against the upper Bollinger Band that is found near 98.00. In technical analysis the crossing of the 50- and 200-day moving averages have special significance. The 50-day average is set to cross above the 200-day average next week.
|
US Dollar Currency Index Dollar Index, October 15 2016(see more posts on Dollar Index, )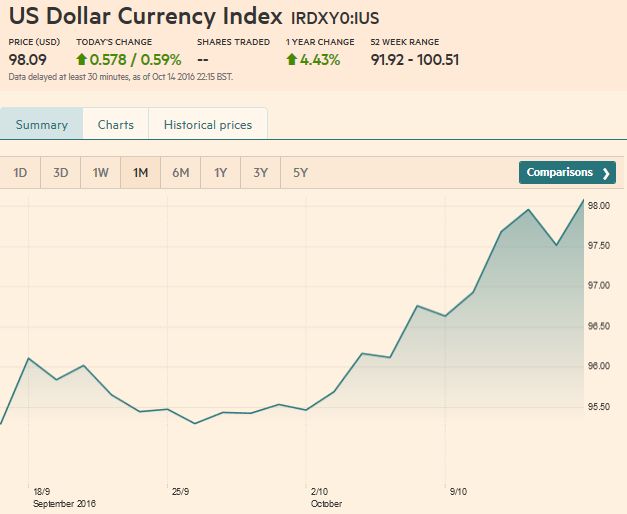 . |
EUR/USDThe euro broke below this year’s uptrend line, which is found by connecting the January, June and July lows. It comes in a little above $1.1035 to start the new week and finishes a little below $1.1050.
Initial resistance is seen in front of previous support near $1.1080. The next immediate target is the July low by $1.0950. Technical indicators give scope for additional euro declines, but the readings are approaching extremes and the lower Bollinger Band is at hand (~$1.1023)
|
Euro/US Dollar FX Spot Rate, October 15 2016(see more posts on EUR/USD, )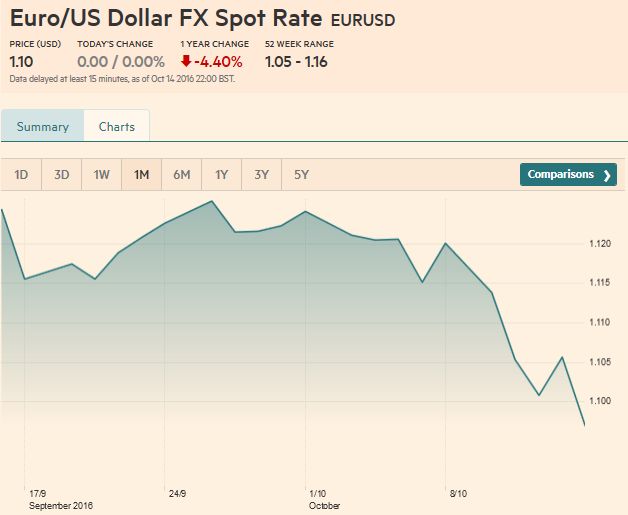 . |
USD/JPYThe dollar has risen against the yen for three consecutive weeks. It is the longest streak in nearly five months. The dollar closed several sessions above the 100-day moving average for the first time since February. The increase in US rates seems to be the driver. The greenback edged above the September high (~JPY104.30), but has not made a clean break, perhaps due to the proximity of the 61.8% retracement (~JPY104.45) of the dollar’s decline since seeing JPY107.50 on July 21. Above here, the next target is JPY105, then JPY105.60. Support is seen near JPY103.20-JPY103.40.
|
US Dollar Japanese Yen FX Spot Rate, October 15 2016(see more posts on USD/JPY, ) . |
GBP/USDUK Prime Minister May may not be able to sell a hard Brexit to the House of Commons or a soft Brexit to other EU countries. Sterling suffers, and its weakness is no longer taking place as interest rates fall and stocks outperform. After the flash crash, sterling spend the week largely consolidating around the middle of the the flash crash range. The spring is coiling. Wednesday’s range was within Tuesday’s. Thursday’s range was within Wednesday’s range. Friday’s range was within Thursday’s. Often this pattern is a continuation pattern. A break of $1.2080 would be significant. On the other hand, a High Court ruling giving Parliament the right to vote on May’s Brexit strategy could see a bout of short-covering. A move above $1.2375 is needed to signify anything of technical importance.
|
UK Pound Sterling / US Dollar FX Spot Rate, October 15 2016(see more posts on British Pound, )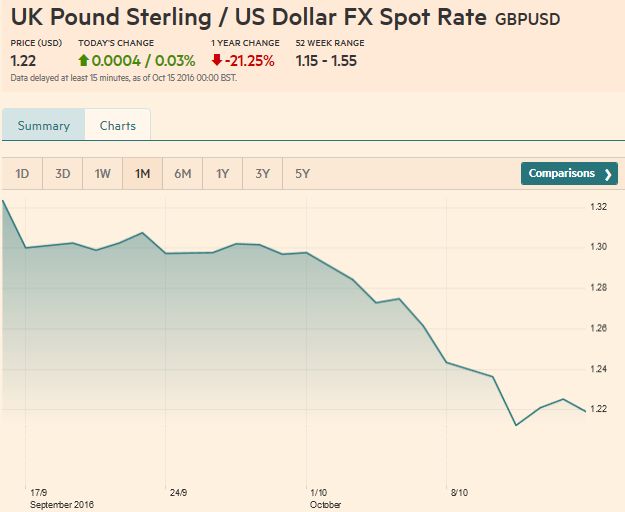 . |
AUD/USDThe Australian dollar remains impressively resilient. It made a new low for the move on October 13 near $0.7500 as buyers emerged after the two cent pullback since the last test on the $0.7700 nemesis. The next day it had completed a 61.8% retracement of this month’s losses (~$0.7630). The technical indicators appear to be consistent with another run at $0.7700.
|
AUD/USD FX Rate Chart, October 15 2016(see more posts on Australian Dollar, )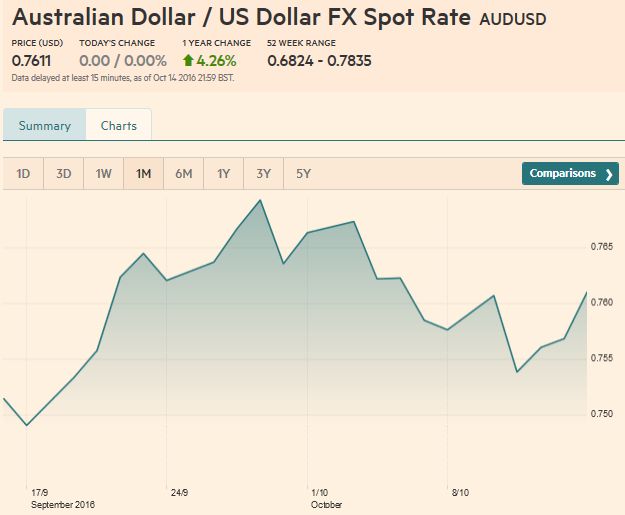 . |
USD/CAD
The US dollar posted a downside reversal against the Canadian dollar on October 13 and saw follow through selling on October 14. For the first time here in October, the greenback closed below its 20-day moving average. Technical indicators warn of additional downside risk in the days ahead. The low thus far in October was set near CAD1.3070. The US dollar has not traded below CAD1.30 since early-September. The risk to this negative technical view comes from the Bank of Canada meeting on October 19. Without easing policy, it may be more dovish than the market expects.
|
USD/CAD FX Rate Chart, October 15 2016(see more posts on Canadian Dollar, )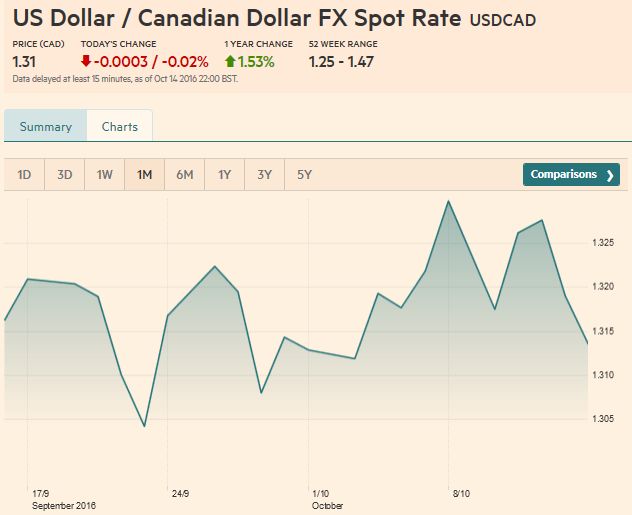 . - Click to enlarge |
Crude Oil
|
Crude Oil, October 15 2016(see more posts on Crude Oil, )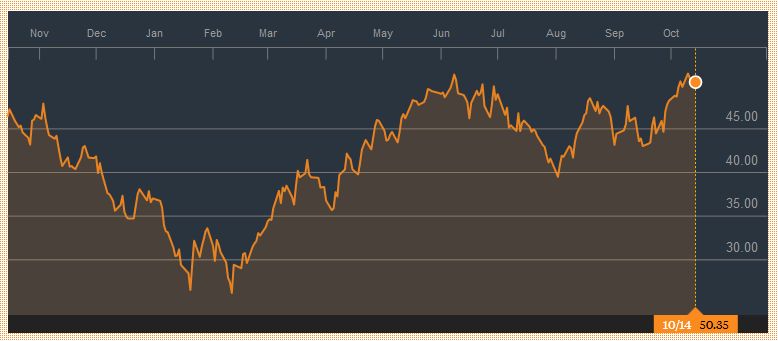 . |
U.S. TreasuriesThe US 10-year yield rose for its second consecutive week. It has from 1.54% at the end of September to 1.80% in the middle of last week before consolidating for the past two sessions. Like the 10-year yield, the two-year yield rose to four month highs near 89 bp. It has risen for three consecutive weeks. The US 10-year yield finished the week just below 1.80%, the highest since early June. The yield has risen for two consecutive weeks. The next target is near 1.90%, but the technical condition warns that the yield is unlikely to make it that far before a correction. The December note futures closed near its session lows before the weekend, after slipping through 130-00. Initial support is seen in the 129-12 to 129-17 band.
|
Yield US Treasuries 10 years, October 15 2016(see more posts on U.S. Treasuries, )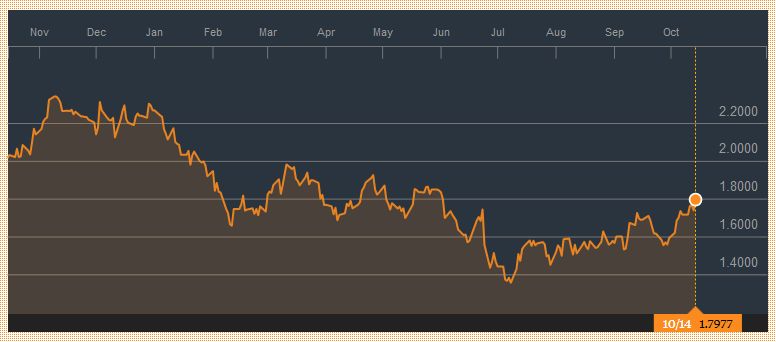 . |
S&P 500 Index
|
S&P 500 Index, October 15 2016(see more posts on S&P 500 Index, )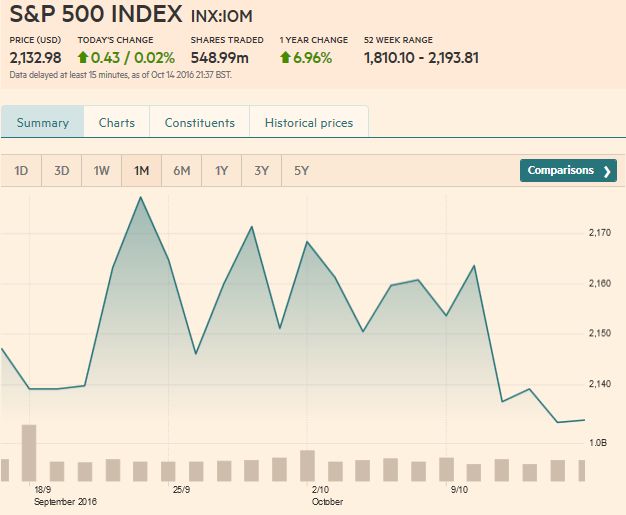 . |
Are you the author?
Tags: Australian Dollar,British Pound,Canadian Dollar,Crude Oil,Dollar Index,EUR/CHF,EUR/USD,Euro,Japanese yen,MACDs Moving Average,newslettersent,S&P 500 Index,Swiss Franc Index,U.S. Treasuries,usd-jpy,USD/CHF,USD/JPY


