How to Decipher the News“Markets make opinions,” says the old Wall Street adage. Perhaps what this means is that when stocks are going up, many consider the economy to be going great. Conversely, when stocks tank it must be because the economic sky is falling. For both scenarios the opinions range far and wide. A rising NASDAQ may compel a tech aficionado to proclaim we’re on the cusp of a new digital revolution. Falling manufacturing stocks may compel a protectionist to proclaim it is NAFTA’s fault. So if markets make opinions, do opinions make markets? Over the last decade or so, Fed dithering has midwifed a new opinion based form of market forecasting. From what we can tell, it involves taking economic data reports, interpreting how this will impact Fed policy, and then projecting out how this will influence the stock market. If we’ve pieced it all together correctly, the relationship between economic reports and markets goes something like this: Good news is bad news. So, too, bad news is good news. Indeed, this is always true, except, of course, the unexpected occasion when good news is really good news or bad news is really bad news. These relationships are always obvious, some of the time. And as might be expected, there are many exceptions to the rule. That’s why you should not use your brain; but rather, use your gut. That way, even when you’re wrong, you’re always right. |
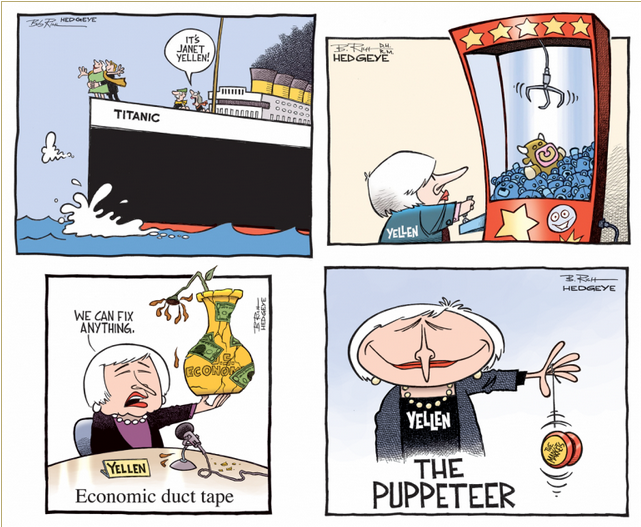
 The observer-participant feedback loop in action. What does the market really “know”? Often it is far less than one would think… Photo credit: Univers beeldbank |
How to Invest AccordinglyFor example, one government department reports the economy stinks. Stocks go up. Why? Bad news is good news, of course. The popular wisdom says that slack in the economy will compel the Fed to hold rates lower for longer. Stocks and other assets should balloon out even further, goes the thinking. Do you follow the logic? Should you front run your investments accordingly? This week, for instance, the Conference Board Consumer Confidence Index was reported to have increased 4.4 points to 101.1 in August. Consumers haven’t been this confident in the current business and labor market in nearly a year. Additionally, the Commerce Department reported this week that consumer spending rose for the fourth straight month in July. Consumers, if you recall, account for 70 percent of GDP. Increases in consumer spending should, conceivably, translate into higher GDP. Perhaps this means the Fed will raise rates when they meet later in September. According to the new logic that means you should sell stocks, right? For if the Fed raises rates, there will be less liquidity pushing up stocks. Therefore, you should sell, right? |
 Conference board consumer confidence index (blue) and the NFIB small business confidence index (red). Consumers seem slightly overconfident… – click to enlarge. |
Shrewd Financial Analysis in the Year 2016Naturally, the answer is never as clear cut as it seems at first glance. What we mean is things don’t always work out the way one thinks they should. For instance, rising consumer spending, it would seem, should result in rising price inflation. More money chasing the same amount of goods should pull up prices. Yet, according to economic reports, this isn’t happening. Specifically, the personal-consumption expenditure price index, the Fed’s preferred inflation measure, was flat in July. What’s more, over the last year, the index was up only 0.8 percent. Inflation of just 0.8 percent doesn’t come close to the Fed’s 2 percent target. Maybe this will mean the Fed will hold off on raising rates until December. In this case, it’s risk on, and you should buy. Alas, here we have two apparently contradictory economic reports. One says consumers are spending money. The other says there’s no price inflation. So which report it right? Which is wrong? Obviously, this line of thinking is rooted in hogwash. Yet, somehow, it passes for shrewd financial analysis by the talking heads on CNBC in the year 2016. We merely bring it up to highlight the fact that 99 percent of popular market analysis – which makes inferences from economic data reports, and draws conclusions of how this will impact Fed policy, and, hence, the stock market – is merely an exercise in the esoteric. The other half isn’t much better either. |
 PCE headline index, year-on-year change rate. This index has been in a volatile downtrend since 2008 (note: energy has had a lot of influence on the headline PCE in recent years) – click to enlarge. |
Charts by: Doug Short / Advisorperspectives, St. Louis Federal Reserve Research
Chart an image captions by PT
Full story here Are you the author?
Tags: newslettersent,On Economy,On Politics,U.S. Consumer Confidence,U.S. Consumer Spending