Which indicators are the leading ones?
Manufacturing PMIs are considered to be the leading and most important economic indicators.
Jim O’Neill, Chairman of Goldman Sachs Asset Management, believes the PMI numbers are among the most reliable economic indicators in the world. BlackRock’s Russ Koesterich thinks it’s one of the most underrated indicators.
They are often driven by exporters, especially in countries with strong trade balances and currencies, whereas services PMIs are determined more by local consumers. In most countries these ones follow the manufacturing PMIs with a delay of some months: at least historically this was the case.
During a global downturn or slowing, the services PMIs might be stronger than the manufacturing PMIs. Examples are Germany and the UK, where services PMIs (July: 50.3 and 51.0) were far higher than manufacturing PMIs (June: 43.0 and 45.4). Generally services PMIs show less volatility, because the manufacturing counterparts depend more strongly on investment, which slows during downturns.
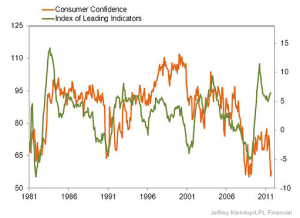
For the US, however, we consider the non-manufacturing PMI (the main component are services) and the Chicago manufacturing PMI to be the leading indicators. The reason is that the US consumer is still the main driver of the global economy. The ISM non-manufacturing PMI reflects future spending better than the University of Michigan or the Conference Board indicators.
In September/October 2011 the non-manufacturing PMI was in positive territory whereas both consumer sentiment numbers saw very bad values. Stock prices were down because they often correlate more with consumer sentiment and less with the leading indicators.
Commodities are more strongly correlated with leading indicators. As suggested by the leading indicators, the US came later into a recovery phase, last but not least thanks to cheaper gas (GAS) prices. The Chicago PMI is strongly associated with the Chicago car producers. The indicator often ticks upwards after a strong fall in gas prices, like seen recently. The ISM manufacturing PMI (here on Bloomberg) follows the Chicago PMI, often with a lag of one month. As opposed to the Chicago PMI that reflects the US consumer demands for cars, the ISM manufacturing PMI depends more strongly on global demand and exports.
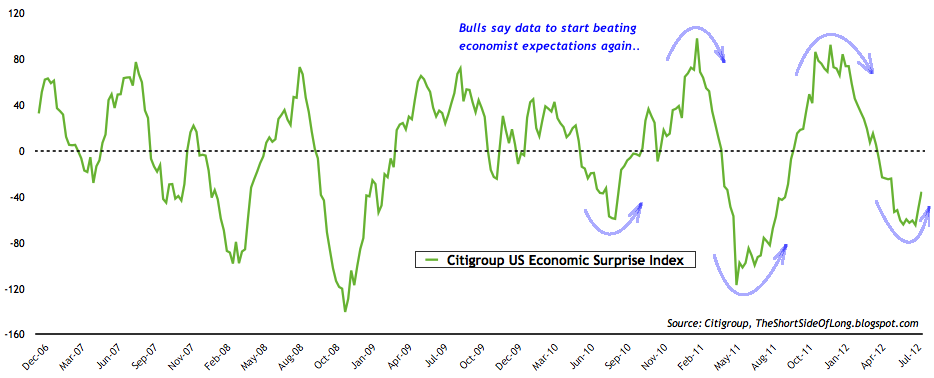
The Citibank Economic Surprise Index compares economic data with investor expectations. It turned upwards from October 2011 onwards, when data was actually better than what investors expected.
After a downturn in June 2012, the surprise index move was upwards again. More on seasonality effects and the implications for the SNB can be found here.
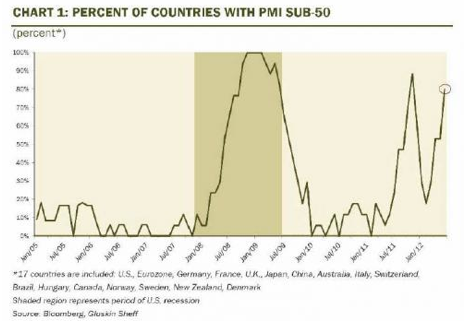
The global slowing in the middle of 2012
Next page: the history of PMIs and further links
Are you the author? Previous post See more for Next postTags: Australia,Brazil,Brent Oil,China,Composite PMI,Copper,Eurozone,France,Germany Exports,Greece,India,Ireland,Italy,Japan,Markit,Mexico,Netherlands,PMI,Poland,Purchasing Manager,Russia,Saudi-Arabia,SMI Swiss Market Index,Spain,Surprise Index,Sweden,Switzerland,Taiwan,Turkey,U.K.,U.S. Chicago PMI,U.S. ISM Manufacturing PMI,U.S. ISM Non-Manufacturing PMI,United States


