A history
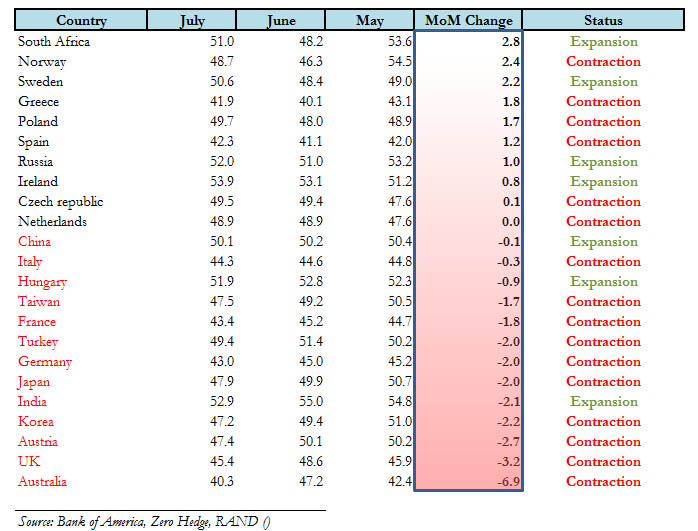
July:Global Manufacturing PMIs July 2012
PMI positive/negative change ratio: 12:15
Expansion/Contraction ratio: 7:20
Risk Indicators
August 2:
S&P500 1361
Copper 3307
Brent 106
AUDUSD 1.0465
EURUSD 1.2179
DAX 6606
SMI 6407
Switzerland: 48.6 (June 48.1, May 45.4)
Brazil: 48.7 (June 48.5)
Poland: 49.7 (June 48.0)
United States/ISM: 49.8 (June 52.5, May 54.0) (ISM is listed in June/May below)
additionally: United States/Markit: 51.4 (June 51.9, May 52.5)
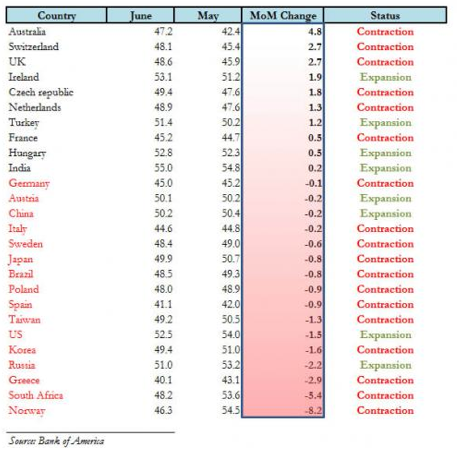
June: Global Manufacturing PMIs June 2012
PMI positive/negative change ratio: 10:17
Expansion/Contraction ratio: 8:19
Risk indicators per July 2:
S&P500 1357
Copper 3466
Brent 97
AUDUSD 1.023
EURUSD 1.2580
DAX 6578
SMI 6109
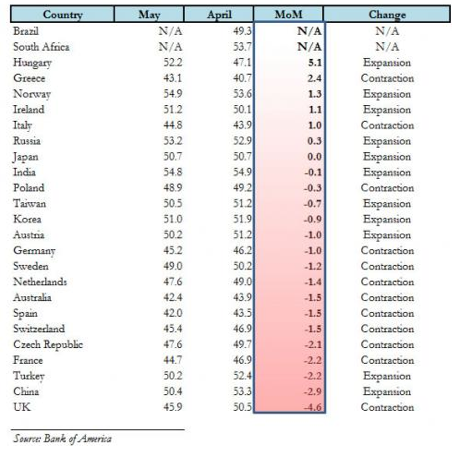
May: Global Manufacturing PMIs May 2012
PMI positive/negative change ratio: 6:16
Expansion/Contraction ratio: 12:13
Risk indicators per June 3:
S&P500 1263
Copper 3289
Brent 98
AUDUSD 0.964
EURUSD 1.2398
DAX 5978
SMI 5713
History JPM global composite PMI
History JPM global services PMI
History JPM global manufacturing PMI
The July update appeared in Seeking Alpha.
Are you the author? Previous post See more for Next postTags: Australia,Brazil,Brent Oil,China,Composite PMI,Copper,Eurozone,France,Germany Exports,Greece,India,Ireland,Italy,Japan,Markit,Mexico,Netherlands,PMI,Poland,Purchasing Manager,Russia,Saudi-Arabia,SMI Swiss Market Index,Spain,Surprise Index,Sweden,Switzerland,Taiwan,Turkey,U.K.,U.S. Chicago PMI,U.S. ISM Manufacturing PMI,U.S. ISM Non-Manufacturing PMI,United States


