Tag Archive: U.S. Consumer Spending
Consumer Spending measures the inflation adjusted amount of money spent by households in the US economy.
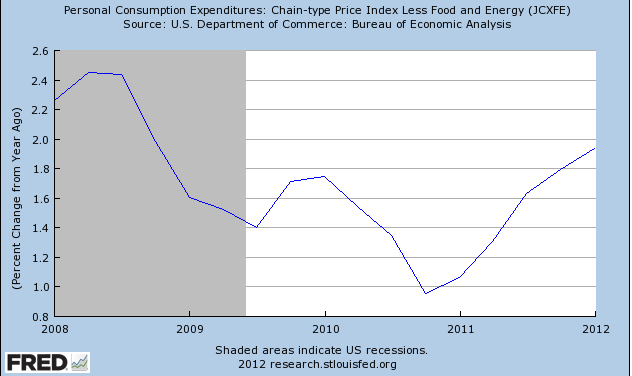
Great Graphic: The Decline in Durable Goods Prices
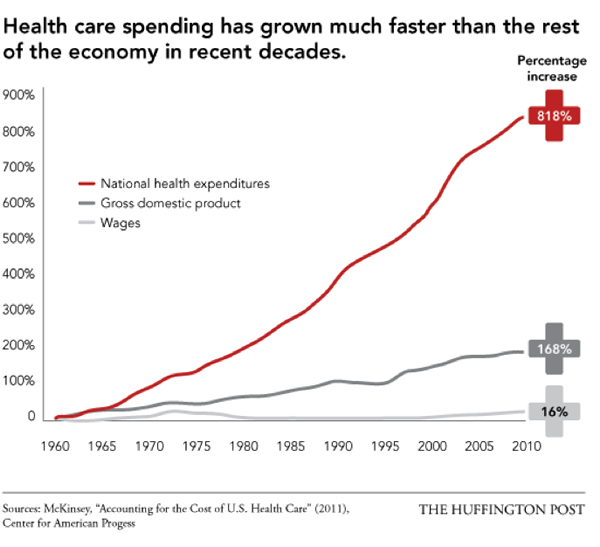
This economic graph is maybe the most important in the last decade. Service prices are rising, while goods prices have steadily fallen. The main reason for us is the possibility to outsource big parts of the durables supply-chain to China and East Asia. This is where productivity growth happens. Prices of services, however, are ever increasing. …
Read More »
Read More »
Switzerland UBS Consumption Indicator June: Summer tourism inspires confidence
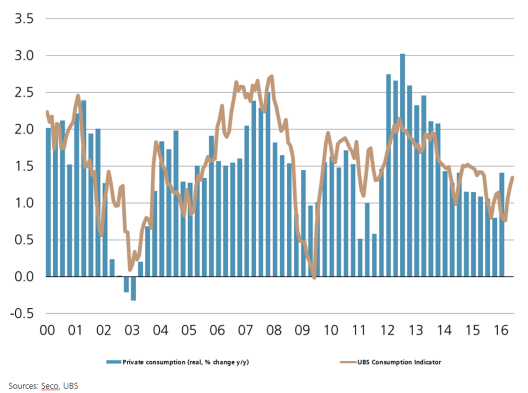
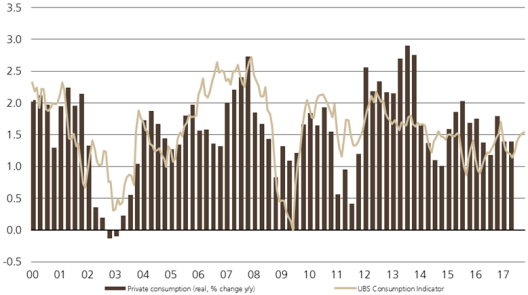
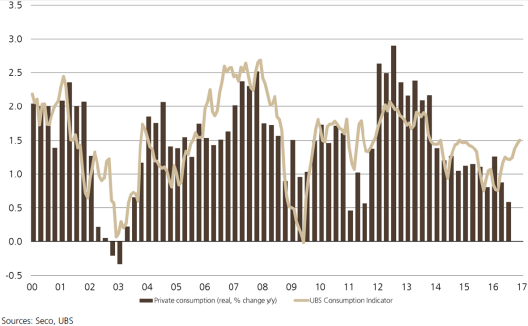
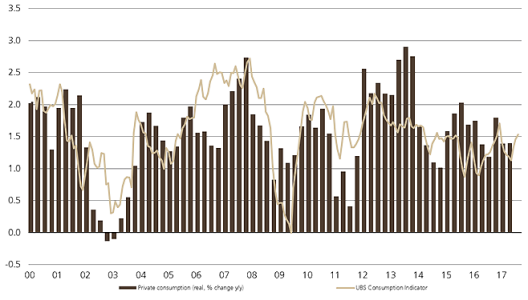
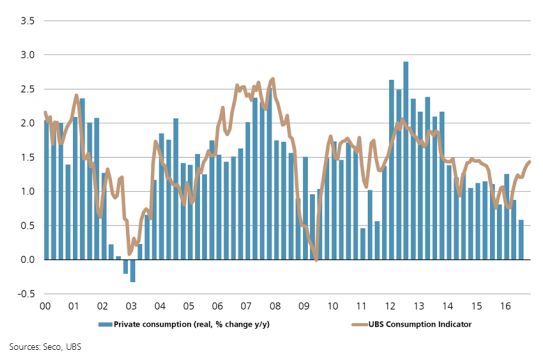
In June, the UBS consumption indicator rose from 1.24 to 1.34 points. This was mainly due to a better performance in the tourism industry as well as a slight improvement in sentiment in the retail trade. However, the situation in the labor market is still strained and is weighing on consumer sentiment.
Read More »
Read More »
FX Daily, June 28: Markets Stabilize on Turn Around Tuesday
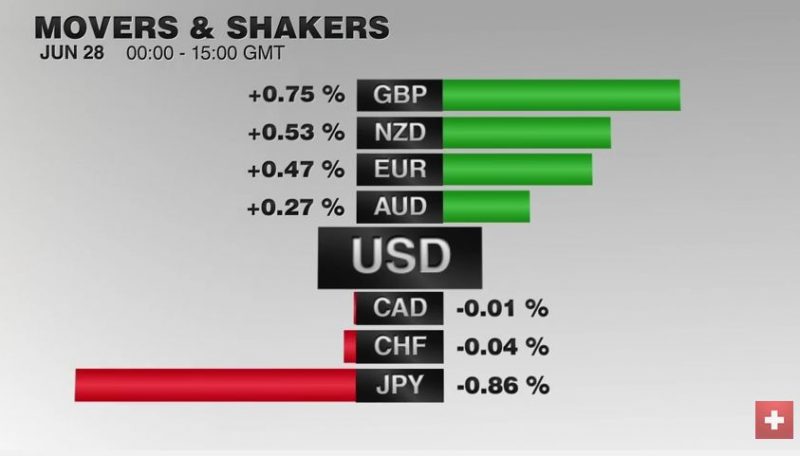
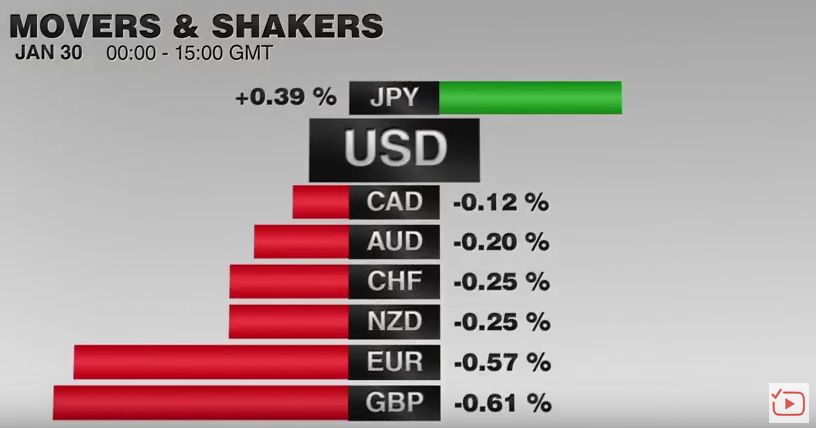
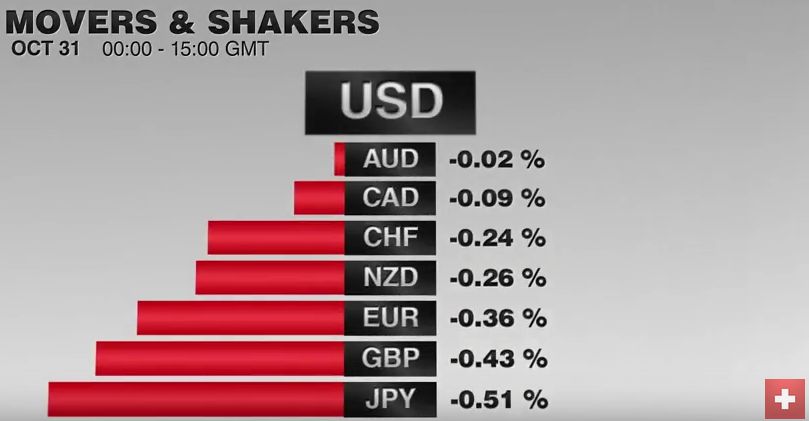
The global capital markets are stabilizing for the first time since the UK referendum. It is not uncommon for markets to move in the direction of underlying trends on Friday's; see follow-through gains on Monday, and a reversal on Tuesday. That is what is happening today.
Read More »
Read More »
What Drives the Economy: Consumer Spending or Saving/Investment?
The concerted actions in September 2012 between the two big central banks reflected two fundamental economic principles: The Fed opted for Keynes' law, the ECB for Say's Law with conditionality. And apparently the ECB was successful.
Read More »
Read More »
Will the Dollar Appreciate on higher U.S. Savings and a Smaller Trade Deficit?
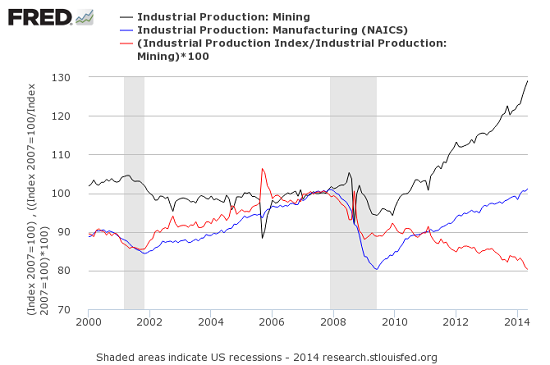
In summer 2013, even the sceptical and "gold-friendly" economist John Mauldin followed the mainstream thinking that fracking and other technology could reduce OPEC's and the Chinese advantage in global trade and reduce the U.S. trade deficit. Recently both claims got refuted: the first with WTI crude oil prices rising to nearly 108$ despite enhanced supply. Detailed data showed that rising U.S. industrial production was not caused by more...
Read More »
Read More »
GDP: Switzerland Enters Boom and.. incredibly.. SNB is Still Printing Money
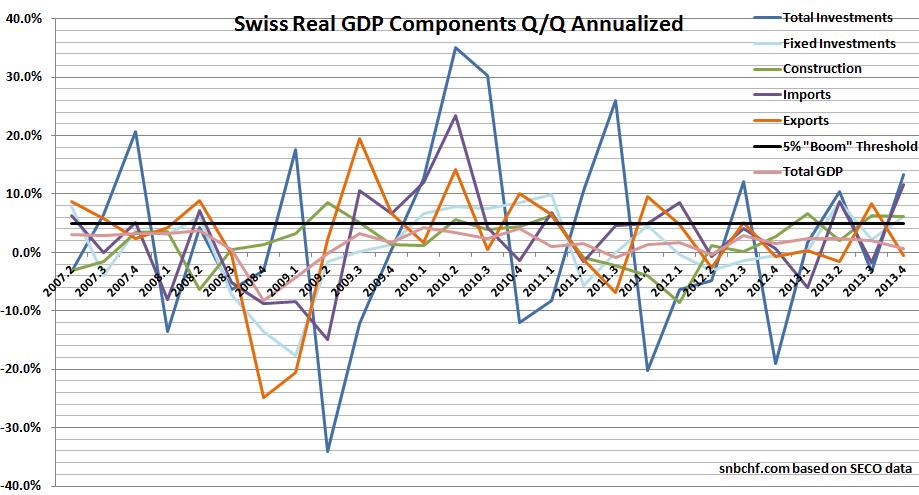
According to the latest data from the SECO,Swiss GDP rose by 0.2% in Q4/2013. Despite the relatively weak headline, the detailed data showed a couple of characteristics that speak for an upcoming boom. At the same time, the Swiss National Bank is printing money again: both the monetary base and money supply are increasing.
Read More »
Read More »
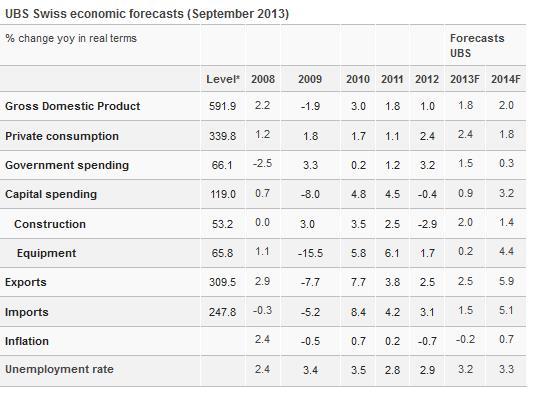
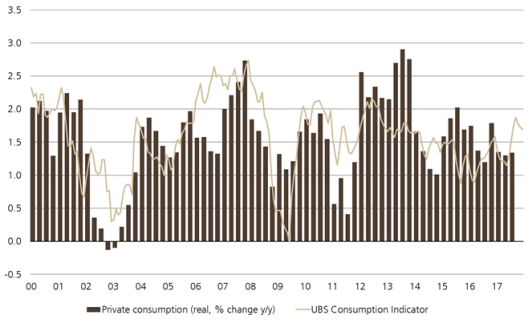
UBS Consumption Indicator Points to 2.5 Percent Swiss GDP Growth in 2014
FacebookShare As usual, the Swiss economy seems to be better than economists thought. After 1.40 still in December, the UBS consumption indicator has risen to 1.81, a value higher than the ones in 2012, when private consumption increased by 2.4%. Similarly as last year, the latest reading contradicts UBS’s own growth forecasts, albeit this year …
Read More »
Read More »
How European Leaders Are Successfully Implementing Say’s Law
The concerted actions in September 2012 between the two big central banks reflected two fundamental economic principles: The Fed opted for Keynes' law, the ECB for Say's Law with conditionality. And apparently the ECB was successful.
Read More »
Read More »
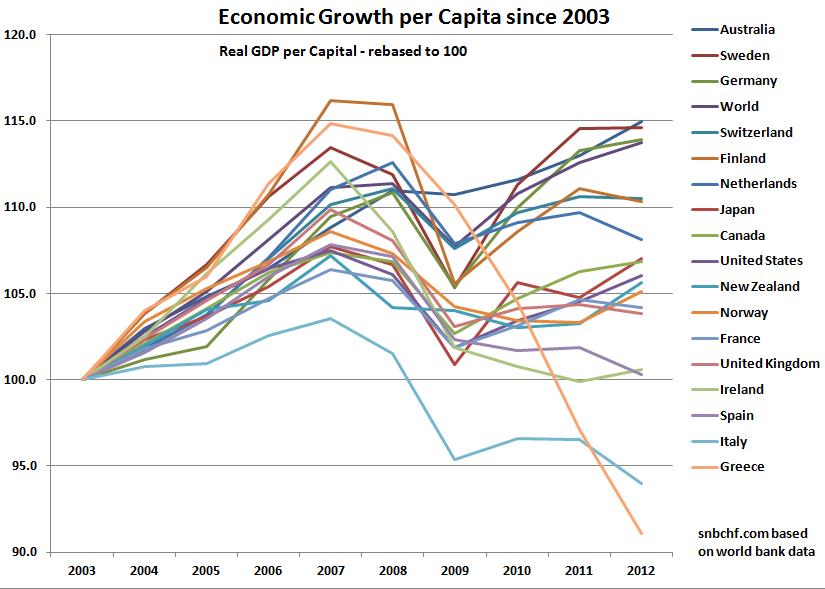
Japan Beats the United States in GDP Growth per Capita for Last Decade
GDP Growth per Capita in Developed Nations in the following order: Australia Sweden Germany Switzerland Netherlands Japan Canada United States France United Kingdom Ireland Spain Italy Greece
Read More »
Read More »
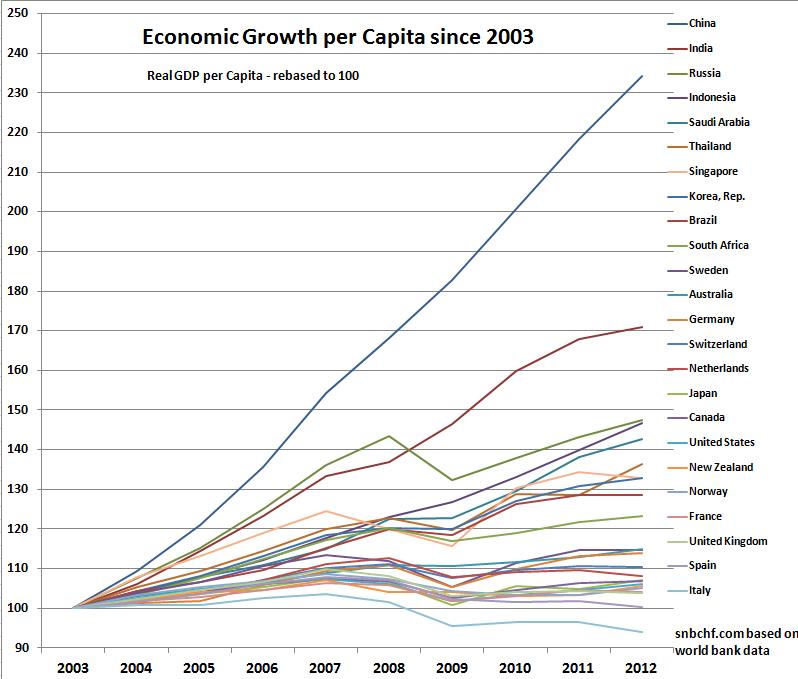
Japan Beats the United States in GDP Growth per Capita for Last Decade
Mainstream economists speak of two Japanese lost decades(s) between 1990 and 2009. Often the United States and the UK are seen as leader in growth. Some statistics might confirm this: When we look on a more subtle criteria, namely GDP growth per capita, available at the world bank, we see a different picture. China and … Continue reading...
Read More »
Read More »
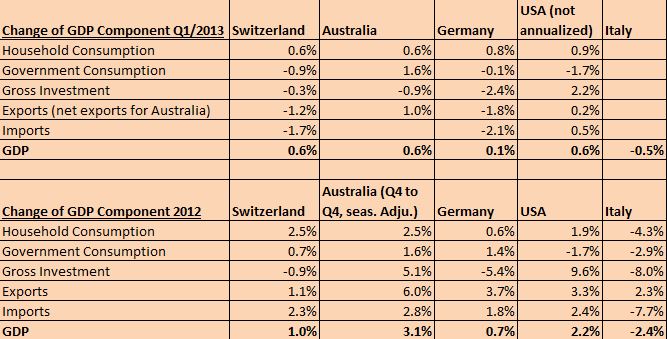
Swiss Q2 GDP Details Compared to Japan, Germany, Australia and U.S.
The Swiss GDP for Q2/2013 was in line with its peers in developed countries. The quarterly (not annualized) change was +0.5% compared to 0.6% for Japan and the United States, +0.7% for Germany and +0.5% for Australia. Swiss and Japanese growth was driven more by consumption, while the U.S. advances were based more on …
Read More »
Read More »
Q1 GDP: Japan +1.0%, AUS, Swiss +0.6%, US +0.45%, Germany +0.1%, Italy -0.5%
Update June 26: The Swiss economy has grown more quickly than the United States in Q1 2013. Japan is in the lead of the global comparison with 1.0% quarterly growth, Australia and Switzerland follow with 0.6%, the US has 0.45% QoQ (or 1.8% annualized), Germany 0.1% and Italy slowed by -0.5%. Weakest currency, strongest … Continue...
Read More »
Read More »
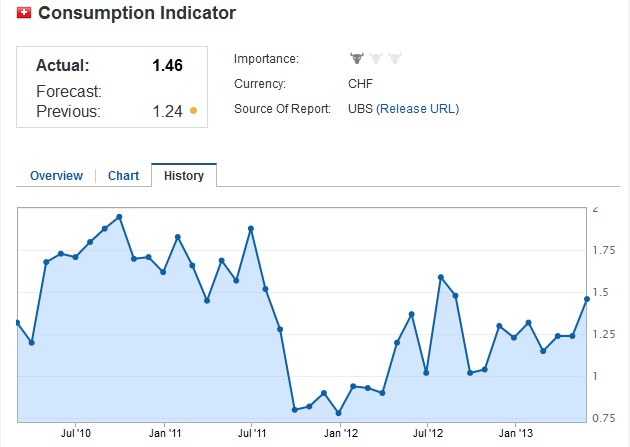
UBS’s Consumption Indicator 1.46 Contradicts UBS’s Swiss GDP Forecast
UPDATE, February 2014 According to the latest data from the SECO,Swiss GDP rose by 2% in 2014 and not by 0.9% as the UBS predicted. Once again the Swiss economy seems to be stronger than expected. UBS’s consumption indicator for April came out at 1.46 (details). This number seems at odds with the weak private … Continue reading...
Read More »
Read More »
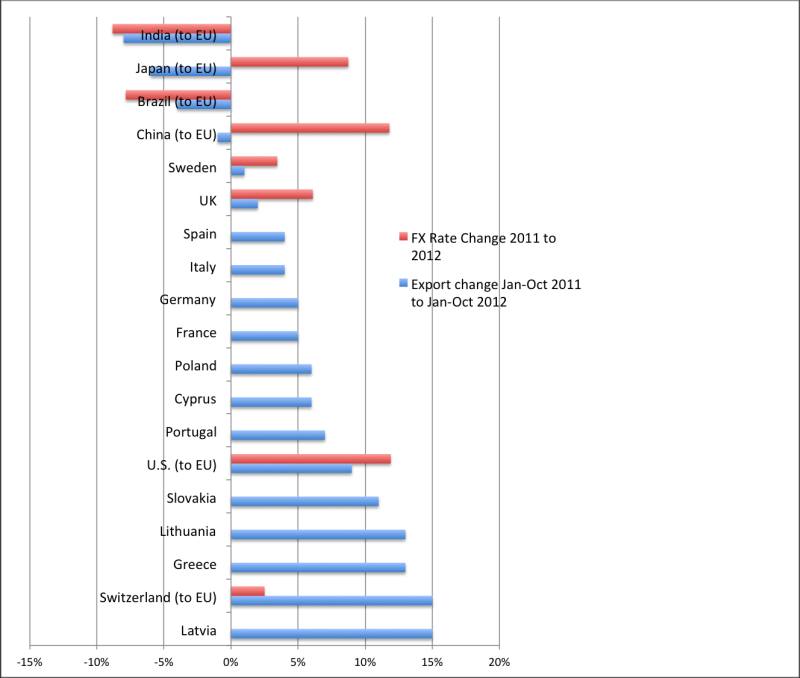
Comparing Trade Balances with FX Rates: Will the European Miracle End?
Eurostat recently published the European exports, imports and trade balance for the first ten months of 2012 compared to 2011. These show heavy improvements for the Southern member states but also a strong dependency on a weak euro.
Read More »
Read More »
The vicious cycle of the US economy or why the US dollar must ultimately fall again
Just some simple words about the vicious cycle of the US economy and the consequences on the US dollar: A stronger USD will not rescue the US economy, quite the contrary. US companies will not hire in the US, but outsource or hire overseas. If they hire in the US, due to the high number …
Read More »
Read More »


