Lance Roberts
My articles My offerMy siteAbout meMy videosMy books
Follow on:TwitterSeeking AlphaFacebookAmazon
This past weekend, Adam Taggart and I discussed what happens to Treasury bond yields when the United States enters a military conflict. The conventional wisdom is reflexive and tidy. A conflict triggers a flight to safety, money floods into U.S. government bonds, and yields fall. It’s a clean narrative. Unfortunately, it is wrong more than right, for reasons that have very little to do with the conflict itself, as shown, yields tend to rise about 60% of the time.

The U.S.-Iran war that began on February 28, 2026, has already exposed the flaw in that thinking. Rather than falling on safe-haven demand, the 10-year Treasury yield climbed from 3.96% at the end of February to as high as 4.26% within the first week of fighting. While Treasury bond yields defied the textbook, the flight to safety was into the US. Dollar, something we discussed in mid-February.
"Currency markets move on expectations more than anything else. Yes, interest rates, economic growth, and inflation can all impact the dollar, but it is more about the “expectations” of those variables for the dollar, trade, etc., that move the price. Therefore, investors need to be on the lookout for factors that could reverse expectations. Currently, several conditions are forming that could begin to reverse those expectations."
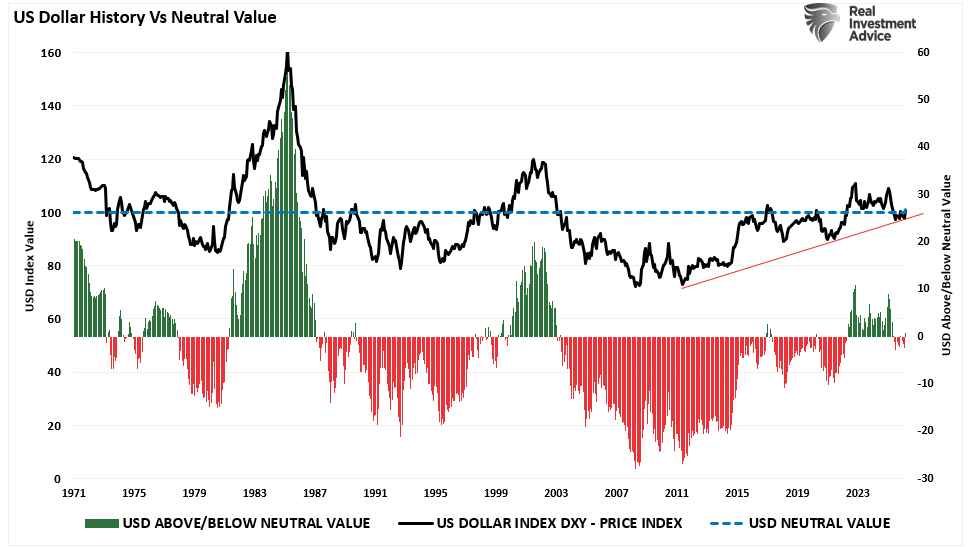
The US-Iran conflict certainly adjusted those expectations. However, Treasury bond investors who understood the transmission mechanism were not surprised at all. A rise in oil prices feeds into inflation expectations, which in turn drive yields.
The reason Treasury yields behave the way they do during military conflicts has almost nothing to do with the conflict itself. It has everything to do with what oil prices are doing, what inflation expectations are pricing, and what macro regime those forces are operating within. Wars don’t drive Treasury yields. Oil, inflation, growth, and fiscal dynamics drive them. However, military conflicts can provide the ignition.
The Transmission Mechanism: Oil → Breakevens → Yields
Before examining specific conflicts, it is worth establishing the mechanical link between military events and Treasury bond yields. The chain has three links, and understanding each one explains why the bond market’s reaction to war is almost never as simple as “flight to safety.”
- Link One: Oil as the primary mechanism for conflict transmission. Nearly every major U.S. military engagement in the modern era has involved a region of significant energy production or a critical chokepoint in global oil logistics. The Persian Gulf, the Strait of Hormuz, and the broader Middle East collectively control a decisive share of global crude oil supply and distribution. When conflict threatens that supply, oil prices move immediately and sometimes violently as the market reprices a real-world supply risk.
- Link Two: Oil prices directly drive inflation breakeven rates. The TIPS (Treasury Inflation-Protected Securities) breakeven rate, or the spread between nominal Treasury yields and real yields on inflation-protected bonds, is the bond market’s forward-looking forecast for inflation. Energy is the single largest volatile component of the Consumer Price Index. Oil prices rapidly transmit price changes into gasoline, transportation, airfares, and manufacturing input costs. When crude surges, breakeven inflation rates typically rise alongside it.
- Link Three: Inflation expectations drive nominal Treasury yields. The nominal 10-year Treasury yield can be decomposed into three components: the expected real interest rate, inflation expectations (breakevens), and the term premium. The term premium is the extra compensation investors demand for holding longer-duration bonds. When oil prices push breakeven inflation rates higher, the nominal yield must follow, absent an offsetting collapse in real growth expectations. In the current environment, with the ISM Manufacturing prices-paid component surging 11.5 points to 70.5 in February 2026, the growth-side offset was simply not available.

“The focus is on higher oil prices and feed-through to headline inflation. Whether that persists will depend on how long this conflict lasts.” — Subadra Rajappa, Head of U.S. Rates Strategy, Societe Generale, March 2026
This three-link pipeline is the essential framework that explains why the Gulf War produced a brief Treasury bond yield spike before ultimately falling. The Gulf War conflict was brief, and oil disruption was largely contained. Contrarily, the Russia-Ukraine conflict produced a sustained yield surge as the energy shock was structural, not transient. Understanding the differences explains what is happening with Treasury bond yields in the Iran conflict today.

The February Setup: Why 3.96% Was a Vulnerable Level
To understand the Iran conflict’s impact on Treasury yields, you must first understand what drove yields to 3.96% in the days before the first strikes. That level did not reflect the structural inflation and fiscal reality of the U.S. economy. It reflected a short-term confluence of weak data, falling oil prices, and an overbought bond market that had overshot to the downside.
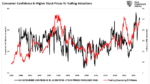
Through January and into February 2026, a series of softer economic readings, weakening consumer confidence, a cooling labor market, and ISM Manufacturing data stuck in contractionary territory, fed a narrative that the Federal Reserve would need to resume cutting interest rates sooner than expected. Simultaneously, crude oil prices had been weak, removing a key inflationary tailwind. With both growth expectations and energy prices softening, the bond market rallied sharply, driving the 10-year yield down to 3.96%.
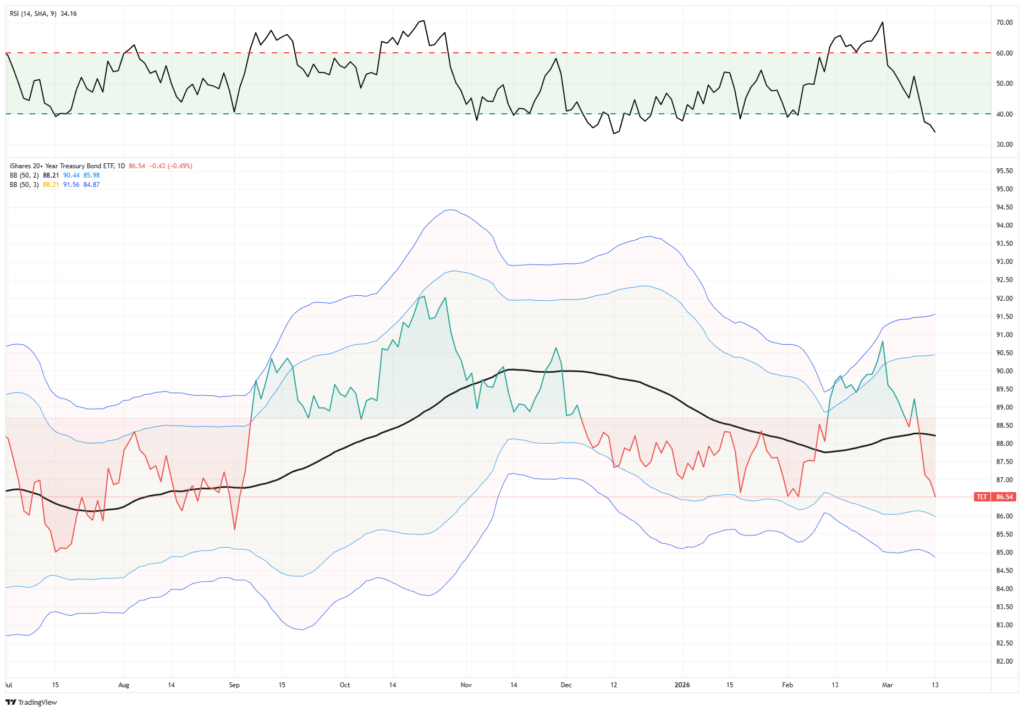
However, as we discussed on TheRealInvestmentShow in mid-February, there was a critical technical reality bond bulls were ignoring: at 3.96%. The rally in Treasury bond yields had pushed yields to levels that were technically very oversold. Since bond prices and Treasury yields move inversely, when yields fall sharply, bond prices rise sharply. That appreciation attracts more investors to bonds. However, as with any market, that crowding creates conditions ripe for pullbacks and corrections to rebalance buyers and sellers. The February rally had pushed bond prices to levels that implied near-perfection: continued disinflation, a weakening economy, and aggressive Fed easing. The spike in oil prices reversed those assumptions, creating meaningful downside risk to bond prices and upside risk to yields.
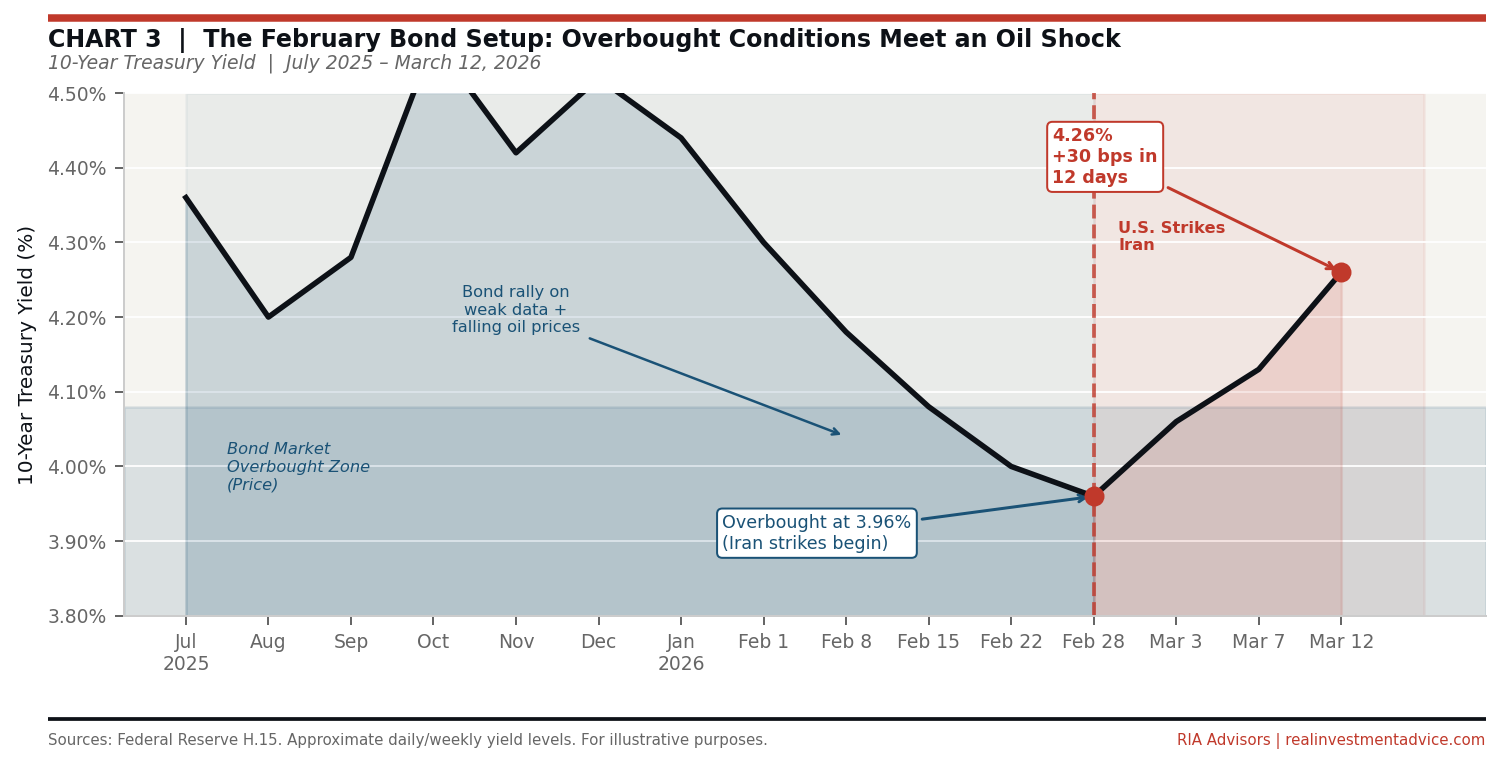
This is the setup that mattered. The Iran conflict did not find a bond market priced for geopolitical risk. It found a market priced for a soft landing with rate cuts, a falling oil price, and a benign inflation trajectory. The Strait of Hormuz disruption shredded that narrative in a matter of hours.

The Macro Regime: Why the Era Matters More Than the War
Across the full sweep of U.S. military history, the dominant determinant of Treasury yield behavior during conflict has not been the war itself, it has been the inflationary and growth regime in which the war occurred, and whether the conflict’s oil price impact amplified or contradicted that existing backdrop.
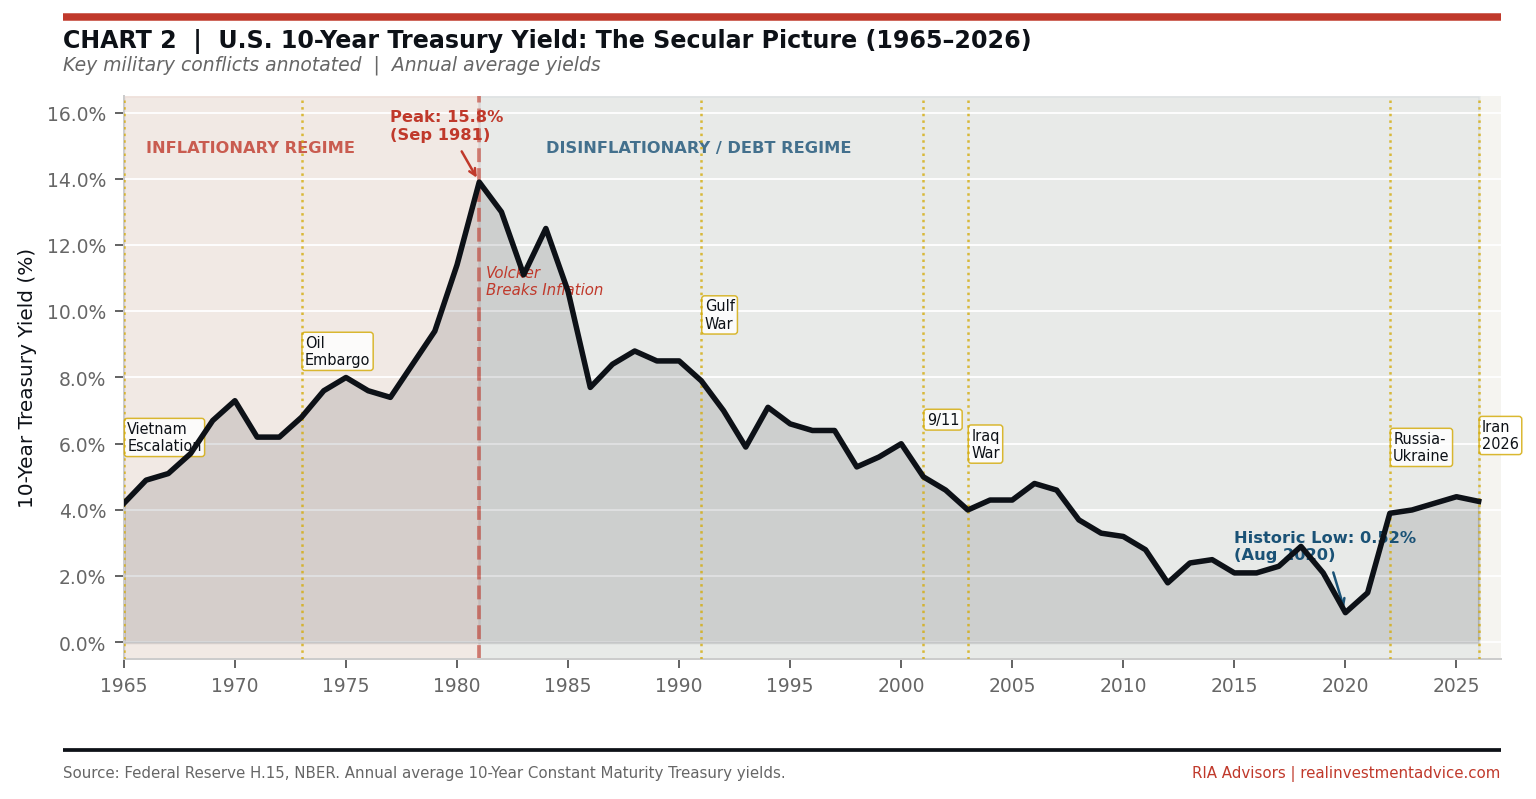
During World War I and the Korean War, yields rose because the underlying economies were already running hot, strong demand, commodity shortages, and wartime fiscal expansion created genuine inflationary pressure that bond investors demanded compensation for. Vietnam was the defining case: President Lyndon Johnson’s refusal to raise taxes to finance both the Great Society and the war, the “guns and butter” policy, detonated a structural shift in the inflation regime. The 10-year yield nearly doubled from 4.2% to 6.5% between 1964 and 1973, not because of the war per se, but because the war provided the fiscal and commodity shock that ignited inflation already primed by an overheating economy. The oil embargo that followed reset the entire game.
World War II, however, is the great exception. The Federal Reserve imposed explicit yield curve control, pegging the 10-year at 2.5%, within weeks of Pearl Harbor. Market-determined yields were suspended. The peg held until the 1951 Treasury-Fed Accord. WWII yield data tells you nothing about bond market behavior and everything about wartime government override of price discovery.
Of course, everything changed after Paul Volcker broke the inflation cycle in the early 1980s. The 10-year yield peaked at approximately 15.8% in 1981 and then began a four-decade secular decline, reaching a historic low of 0.52% in August 2020. Three structural forces drove that decline:
- Persistent disinflation as globalization and technology suppressed price pressures;
- Slowing economic growth as the national debt-to-GDP ratio climbed from roughly 30% to over 120%; and
- An increasingly activist Federal Reserve that used rate cuts to offset every cyclical downturn.
In this post-1980 disinflationary regime, military conflicts produced a very different yield response. The Gulf War’s initial oil spike briefly pushed yields up, but the swift military victory and the accompanying U.S. recession overwhelmed the inflationary impulse—yields fell 80 basis points by the ceasefire. After 9/11, the 10-year yield collapsed 100 basis points over the following year because the conflict reinforced a pre-existing disinflationary, Fed-easing backdrop. The Iraq War’s yield arc over its full lifespan was entirely explained by the business cycle, particularly the Global Financial Crisis—the war itself became background noise.
“More than geopolitical shocks, higher oil prices can significantly lift yields. The oil price is the transfer mechanism of conflict into the global economy.” — Allspring Global Investments, March 2026
The Russia-Ukraine conflict of 2022 marked the first break in that post-1980 pattern. The invasion occurred amid inflation already at 40-year highs, and the energy and commodity price shock it delivered was structural, not transient. The 10-year yield surged from 2.0% to 5.0% between the invasion and October 2023, not because of the war, but because the war’s oil and gas price shock amplified inflation that was already forcing the Fed’s hand.

Iran 2026: An Oil Shock Meeting a Technically Vulnerable Bond Market
The current U.S.-Iran conflict is the clearest real-time example of the oil-breakeven-yield transmission mechanism operating at full force, made more powerful by the technical vulnerability of the bond market at the moment of impact.
When the first U.S. strikes were confirmed on February 28, the bond market briefly caught a flight-to-safety bid, the 10-year yield dipped to a weekend low of 3.93%. That lasted less than 48 hours. Once the Strait of Hormuz disruption risk became real, with Iran reportedly warning it would fire on vessels attempting to pass through, WTI crude surged, and the inflation calculus changed instantly. The 10-year yield closed at 4.285% on Friday, March 13th.
Simultaneously, TIPS breakeven inflation rates rose sharply. The five-year breakeven reached near its one-year high. The 10-year breakeven hit its highest level since September 2025. The ISM Manufacturing prices-paid component, already printing 70.5 in February before the conflict began, had established that inflationary pressures at the producer level were intensifying even before a single barrel of Gulf crude was disrupted.
The bond market’s overbought technical condition going into the conflict amplified the yield move. Bonds that had rallied strongly on weak economic data were now being sold by investors who recognized that the entire thesis behind that rally, disinflation, weak growth, and early Fed cuts, had just been materially challenged by an oil price shock. However, just as bond investors were "overly bullish" in late February, they are now becoming "overly bearish." If higher energy prices reverse the recent growth spurt in the economic data, bond prices will likely rise from more technically oversold conditions.
The Federal Reserve’s position has been directly compromised for now. Inflation was already running at 2.4% year-over-year in February 2026, slightly above the 2% target. However, the potential for an energy-driven inflation impulse is pushing the next anticipated rate cuts into September 2026 at the earliest.
With this in mind, how should investors position for whatever happens next?

Investor Positioning: What the Transmission Mechanism Demands
For investors, the practical implication of understanding the oil-breakeven-yield transmission is crucial. Above all, the reflex of “buy bonds during a conflict” requires a critical precondition:
"The conflict must not generate a sustained oil price shock in an environment where inflation expectations are already elevated."
That precondition does not exist today.
- Reduce long-duration Treasuries on any yield dip. The flight-to-safety impulse will produce brief rallies in 10- and 30-year Treasuries. Each one should be treated as a selling or underweighting opportunity for now. The oil shock has reset inflation breakevens upward, and as long as the Strait of Hormuz remains under threat, that reset will persist. The technical rally from the February overbought condition has been fully reversed, increasing the probability of a near-term rebalance rally.
- Favor the 2- to 5-year part of the curve. If the conflict produces increased prices and slows economic growth, the Fed will be constrained from cutting rates even as growth weakens. Intermediate maturities offer the best risk-reward: meaningful yield relative to cash with materially less duration exposure than long bonds.
- Add TIPS exposure as an explicit inflation buffer. With five-year TIPS breakeven rates already near one-year highs and oil as the direct transmission mechanism, TIPS provide the most targeted protection against the specific risk this conflict is generating. However, TIPS investors need to be mindful of a risk-off reversal if tensions quickly cool.
- Watch the Strait of Hormuz as the yield pivot signal. The single most important variable for Treasury yields in this conflict is not military progress, but whether the Strait of Hormuz remains open. If the disruption proves temporary and oil retreats from current levels, the inflationary shock will fade. Consequently, breakeven rates will recede, and yields could drift back toward 4.0%. If the closure persists, the 10-year has room to test 4.5% or slightly higher.
- Maintain elevated cash and liquidity buffers. The range of outcomes in this conflict is genuinely wide. Committing fully to a directional Treasury trade before the conflict’s duration is known is a risk management failure, not an investment strategy.
The Iran conflict is continuing to unfold, with many variables that both stock and bond investors must carefully consider. The narrative that "war drives investors into safety" is far too simplistic. The reality always lies somewhere in between. Therefore, investors must consider the macro and technical backdrops to navigate volatile markets safely.
References
- Federal Reserve Board. H.15 Selected Interest Rates, Historical Data.
- Reinhart, Carmen M., and Kenneth S. Rogoff. This Time Is Different: Eight Centuries of Financial Folly. Princeton University Press, 2009.
- Bureau of Labor Statistics. Consumer Price Index, February 2026.
- Institute for Supply Management. Manufacturing ISM Report on Business, February 2026.
- Schwab Center for Financial Research. “What Iran Conflict Could Mean for the Bond Market.” March 13, 2026.
- Morgan Stanley Wealth Management. “Iran Conflict: Oil Price Impacts and Inflation.” March 2026.
- Allspring Global Investments. “Market Impacts: Iran Conflict.” March 2026.
- Bloomberg / Yahoo Finance. “Treasuries Rout Shows Iran Conflict Reigniting Inflation Worry.” March 2026.
- CNN Business. “Iran War Threatens to Upend Stocks, Bonds and the U.S. Dollar.” March 12, 2026.
- CNBC. “10-Year Treasury Yield Tops 4.06% as Surging Oil Prices from Iran Conflict Raise Inflation Angst.” March 3, 2026.
- CNBC. “As Iran War Heightens Affordability Issues, Don’t Expect the Fed to ‘Ride In.’” March 12, 2026.
- TreasuryDirect. Historical Treasury Rates.
- Becker Capital Management. “Market Implications of the Iran Conflict.” March 7, 2026.
- AAA. Daily National Average Gasoline Prices, March 2026.
- Friedman, Milton, and Anna J. Schwartz. A Monetary History of the United States, 1867–1960. Princeton University Press, 1963.
The post Treasury Bond Yields Don’t Lie: But Wars Don’t Drive Them appeared first on RIA.
Full story here Are you the author?You Might Also Like
 Speculative Narrative Unwinds
2026-02-09
For nearly two years, markets were driven by the same speculative narrative that “this time is different.” Bitcoin, precious metals, and AI-linked equities rose not only because of robust fundamentals, but also because investors clung to powerful narratives about inflation, disruption, and monetary collapse. Those speculative narratives are not only seductive but also contribute to …
 The Market Cycles Potentially Driving 2026 Returns
2026-02-02
Market cycles are once again at the center of the investment narrative as we head into 2026. The optimism is familiar as earnings held up in 2025, the economy avoided recession, and big tech lifted the indexes. However, those victories are already reflected in the price. As we head into 2026, with valuations extended, the …
 The South Park Market Of 2026
2026-01-23
I have been a “South Park” fan for as long as I can remember, and while the show isn’t a market guidebook, its brutal satire cuts through nonsense better than many Wall Street commentaries. Just like on the show, characters make absurd decisions and face absurd consequences, which is familiar to investors today. For example, …
 Market Bubbles: A Rational Guide To An Irrational Market
2025-11-24
We’re hearing it everywhere: AI is in a bubble. The surge in capital, the parabolic stock charts, and the bold claims from CEOs all have a familiar rhythm. Nvidia’s valuation has soared, along with AI-related startups raising billions with little to no revenue. Investment in data centers, chips, and infrastructure is happening at a scale …
Tags: Bear Market,Featured,Investing,Lance Roberts,newsletter,recession,S&P 500,Technical Analysis