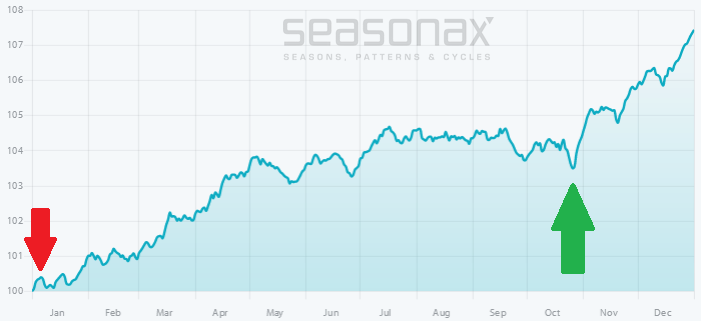
An Old Seasonal Truism
|
|
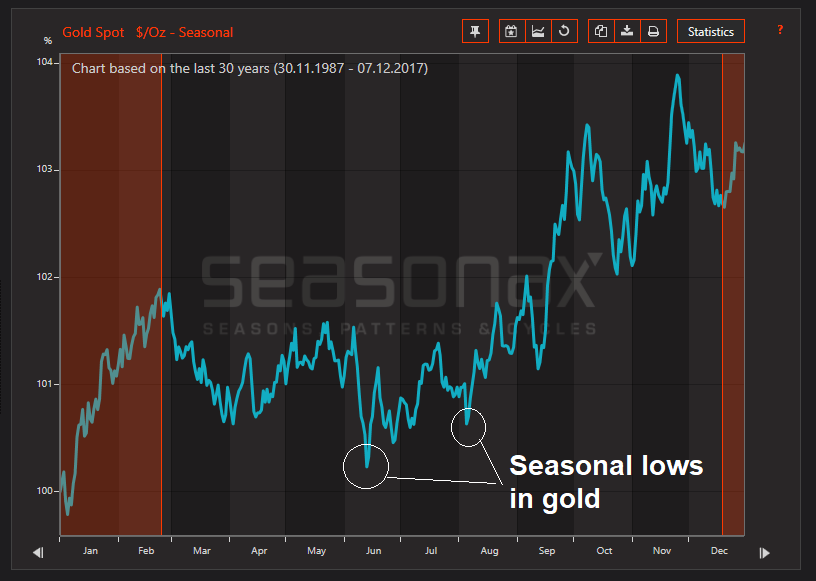
The Eleven Largest Markets in the World Under the Seasonal MicroscopeI have taken a look at the popular benchmark stock indexes of the eleven countries with the largest market capitalization from 1970 onward, or starting from the earliest year as of which continuous price data are available. The comparison divides the calendar year into a summer half-year from May to October and a winter half-year from November to April. The position is assumed to be closed out on the first trading day of the following month. In the respective half-year in which no position in stocks is taken, a cash position that earns no interest is assumed to be held, so as to avoid any distortions in the depiction of the stock market’s seasonal returns by including interest income. This much I will say in advance: The results are clear, in all eleven countries the winter half-year outperformed the summer half-year significantly. In the majority of these eleven countries one would actually have lost money during the summer half-year on average! These countries are:
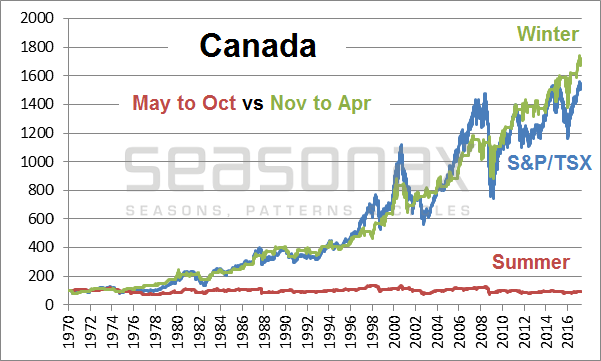
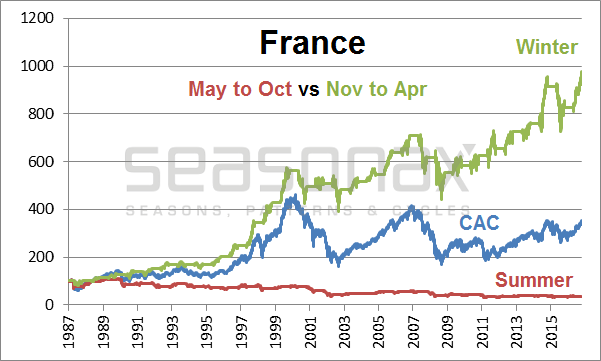
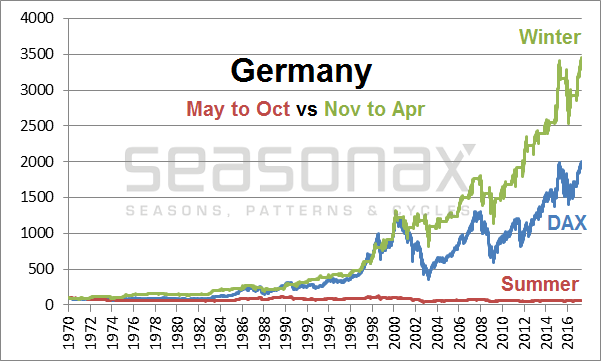
In other words, in these countries it would have been definitely better to go on vacation in the summer months – or to invest elsewhere. The Half-Year Patterns of Nine Selected CountriesThe charts below show the chained stock market performance in nine of the eleven countries during the summer months in red, during the winter months in green, as well as the full year returns in blue (=actual performance of the indexes). Note: the scale of the charts is linear, as a result of which the performance patterns of the summer and winter half-year periods visually don’t appear to add up to the full year performance (but they do arithmetically). Canada: Summer Half-Year vs. Winter Half-Year |
Market Performance In Canada, 1970 - 2017 |
| China: Summer Half-Year vs. Winter Half-Year |
Market Performance In China, 1991 - 2017 |
| France: Summer Half-Year vs. Winter Half-Year |
Market Performance In France, 1987 - 2017 |
| Germany: Summer Half-Year vs. Winter Half-Year |
Market Performance In Germany, 1970 - 2017 |
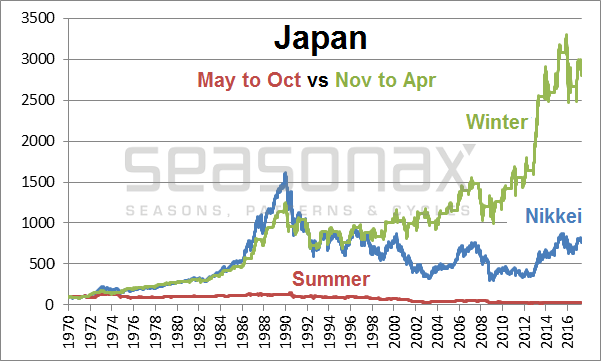
| Japan: Summer Half-Year vs. Winter Half-Year |
Market Performance In Japan, 1970 - 2017 |
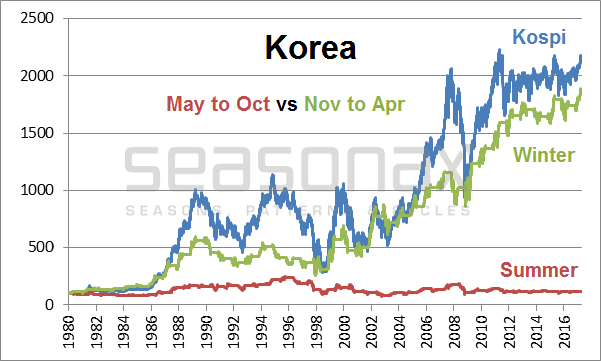
| Korea: Summer Half-Year vs. Winter Half-Year |
Market Performance In Korea, 1980 - 2017 |
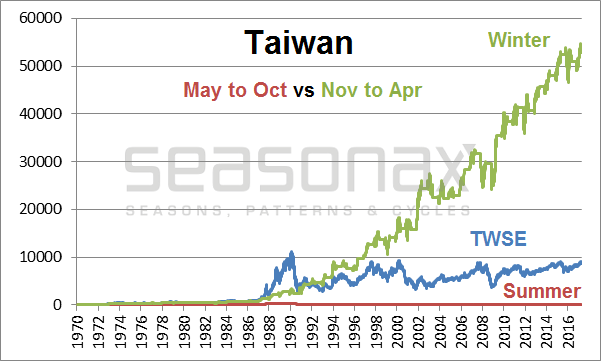
| Taiwan: Summer Half-Year vs. Winter Half-Year |
Market Performance In Taiwan, 1970 - 2017 |
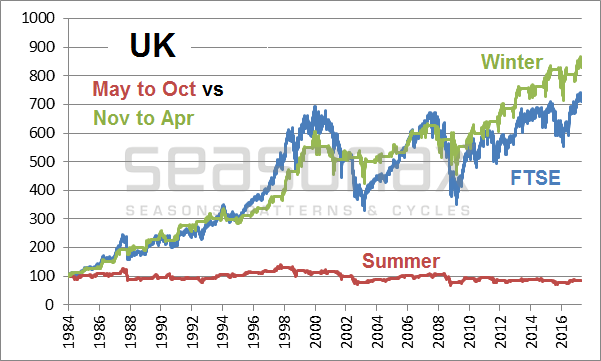
| United Kingdom: Summer Half-Year vs. Winter Half-Year |
Market Performance In United Kingdom, 1984 - 2017 |
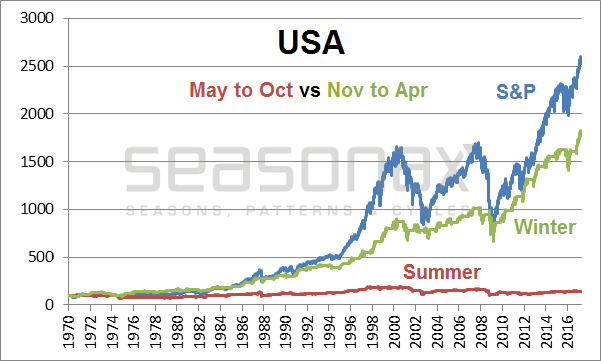
| US: Summer Half-Year vs. Winter Half-Year |
Market Performance In USA, 1970 - 2017 |
In all of the markets shown here it was sensible to sell in early May – as the markets either posted losses or gains of less than one percent in the summer months in these countries. Investing in these markets during the summer was barely worth it: After all, by employing the “sell in May” strategy, one is also exposed to less risk because one is only invested half of the time.
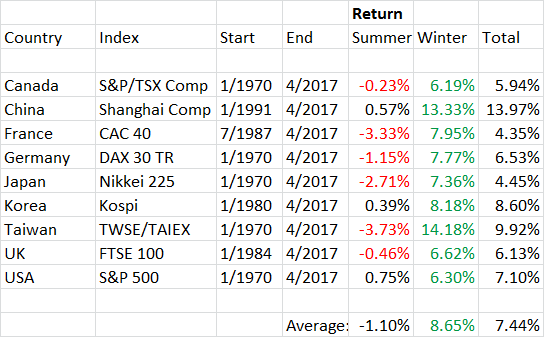
Detailed Results by CountryThe following table shows the half-year results of the nine countries shown above in detail. Half-year periods in which it was profitable to be invested on a risk-adjusted basis are highlighted in green. Half-year periods that generated losses are highlighted in red. Overview of Country Selection: Half-Year Results |
Overview Of Country Selection |
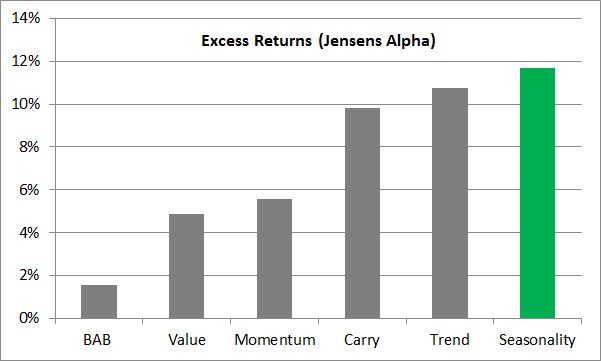
Conclusion – Sell In May WorksThe table underscores that the summer weakness (a.k.a. the “Halloween Effect”) does indeed exist. Although it is a very simple and well-known rule, the pattern still works. Apparently a far too small number of investors is actually taking action based on their knowledge of the pattern and there is almost no arbitrage activity either. The stability and persistence of the pattern suggests that “sell in May” will continue to work in the future. Sometimes the simple rules are the best!
|
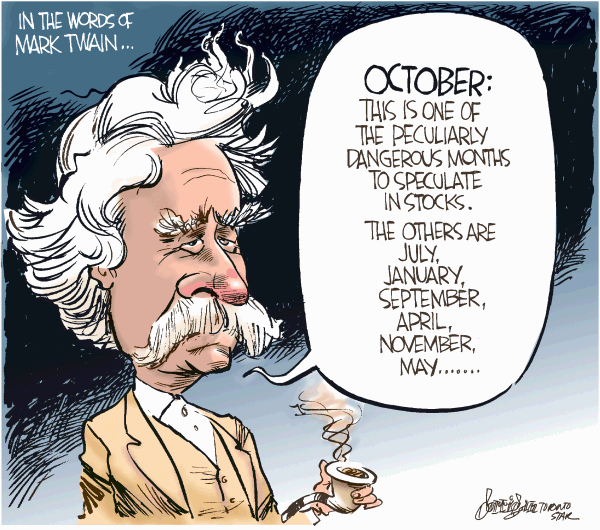
Mark Twain On Stock Market |
Full story here Are you the author? Previous post See more for Next post
Tags: Chart Update,newslettersent,The Stock Market


