Pater Tenebrarum
My articles My siteAbout meMy videosMy books
Follow on:TwitterSeeking AlphaFacebook
The Guessers ConvocationOn Wednesday the socialist central planning agency that has bedeviled the market economy for more than a century held one of its regular meetings. Thereafter it informed us about its reading of the bird entrails via statement (one could call this a verbose form of groping in the dark). A number of people have wondered why the Fed seems so uncommonly eager all of a sudden to keep hiking rates in spite of economic data in Q1 indicating surprising weakness in economic output (of course they once again didn’t hike rates, this time). We have long suspected that the real reason for the urge to hike is to accumulate “ammunition” for the next downturn. After all, it really shouldn’t make much of a difference where the federal funds rate is; the federal funds market is basically dead anyway, and the Fed continues to refrain from shrinking its balance sheet (i.e., bank reserves will remain elevated, and the Fed won’t actively exert pressure on money supply growth). |
 Modern economic forecasting rituals. - Click to enlarge |
Then again, the statement is actually in keeping with the orthodox (largely Keynesian) view of the economy and the central bank’s presumed tasks. There is actually no need to take it at anything but face value. The complete statement can be seen here, but we want to focus on one particular excerpt – which follows an enumeration of various data points in paragraph one:
|
Unemployment Rate, PCE Deflator and Gross Domestic Product, March 2015 - May 2017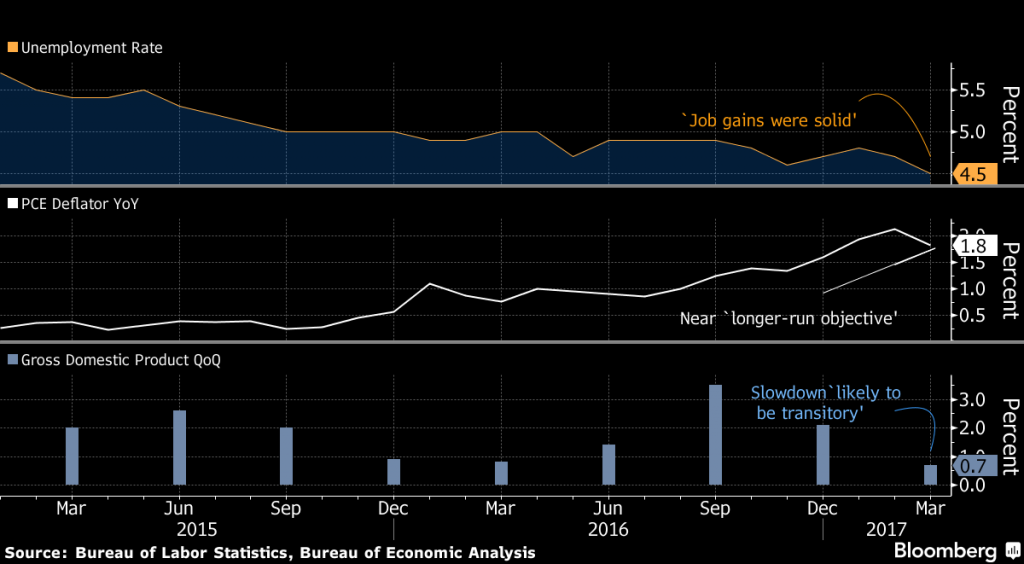 So why are they saying that? Here is a snapshot of the data points that are held to be important to the Fed - Click to enlarge |
| If we look superficially at the unemployment rate and the PCE deflator, then the Fed has every reason to hike rates. Its mandated targets have been reached and short term rates remain historically extremely low.
The only seeming fly in the ointment is the “transitory” weakness in GDP. As far as we can tell, there is a consensus on this point that was mentioned in nearly every mainstream financial press article reporting on the FOMC statement. Here is an example:
Of course, economists always expect a “bounce-back” after a weak quarter – except at the actual bottoms of recessions, which is pretty much the only time when the consensus becomes negative. In essence, such statements are completely meaningless, because that’s what they will say every time. Given continuous monetary inflation, GDP will of course “grow” 75% of the time or more (we are just making a rough guess here, this is about the principle rather than a precise figure). Predicting a “bounce-back” after a weak quarter is therefore the statistically safest forecast – this is very similar to bullish stock market forecasts being being correct around 67% of the time on average. These people are merely guessing of course, just as the members of the FOMC are guessing. In reality, none of them have the foggiest idea of what is going to happen. If that were not the case, the “consensus” and/or the Fed would correctly forecast every major turning point – but they have yet to forecast even a single one. If one wants to know when a serious economic downturn is about to begin, it is probably better pick a few housewives at random and ask them – chances are they will beat these experts at the forecasting game. Consider also all the “excellent data” shown above (ex GDP), which the experts tend to extrapolate to eternity. Did these data look any less excellent at the previous major business cycle peaks? Of course not – in fact, they often look even better. The reason why we even mention all of this is that there is an additional twist to the “Q1 weakness” story. In several reports it was asserted that the Fed is looking beyond this datum, because the “first quarter is always weak, and everybody knows it”. The reason, so the story goes, are seasonal adjustment kinks which appear to be operative since 2013 and have yet to be ironed out (so it’s not the “bad weather” after all! That was the story told in previous years as we recall…). So if everybody knows it, surely the consensus was looking for a very weak Q1 from the outset, right? Not really. Here is the evolution of the Atlanta Fed’s Q1 GDP Now model, including the consensus range. |
GDP Forecast Range, December 22 2017 - April 13 2017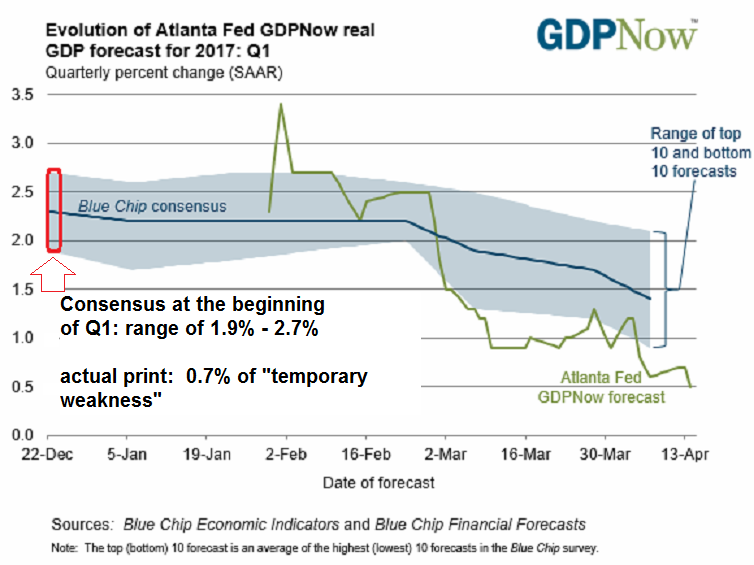 In spite of what “everybody knows”, the blue chip consensus on Q1 GDP growth at the beginning of the quarter ranged from 1.9% to 2.7%. But they all know what’s going to happen next! - Click to enlarge |
| Perhaps we should also mention that one of the two data series the FOMC is fixated on, namely the unemployment rate, is not without its problems at present. The labor force participation rate is currently at a level last seen in 1978, after a free-fall that has by now lasted 18 years. Employment has indeed improved in recent years, but the official U3 unemployment rate is flawed in a great many respects (participation is just one).
Now, we will admit, it is easily possible that the second quarter will turn out to be stronger than the first. GDP is such a malleable and imprecise (not to mention fundamentally useless) datum, that quarter-on-quarter guesses are like flipping coins. We are only talking about all of this because we were struck by how quickly a consensus has formed around the view expressed by the FOMC. |
Civilian Labor Force Participation Rate, 1970 - 2017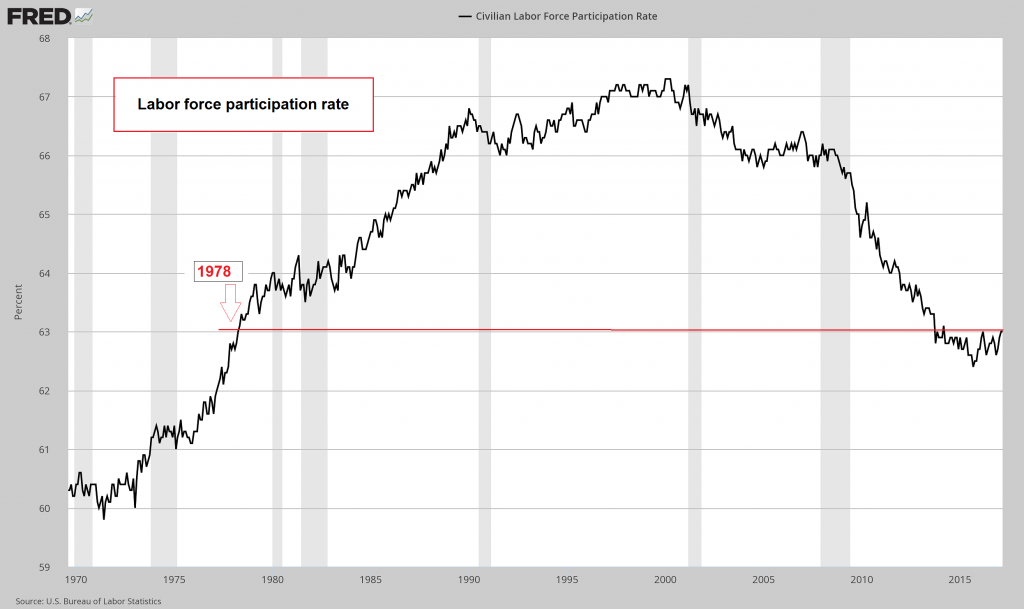 Labor force participation rate – back at 1978 levels - Click to enlarge |
The Real Flies in the OintmentEven so, it would not be worth mentioning any of this if not for the next several charts. We have shown some of these charts before, but we believe it is worth doing so again. These data strongly suggest that something more serious than a “transitory” slowdown in economic activity may be in the offing. For instance, the recent decline in credit growth, which did get a little bit of attention in the mainstream media a few weeks ago, continues – y/y bank lending growth rates are still hitting new lows. First, here is the most recent chart of the money AMS again (adjusted money supply, essentially the narrow version of TMS-2): |
Year On Year Rate Of Change Of US Money, January 2006 - January 2017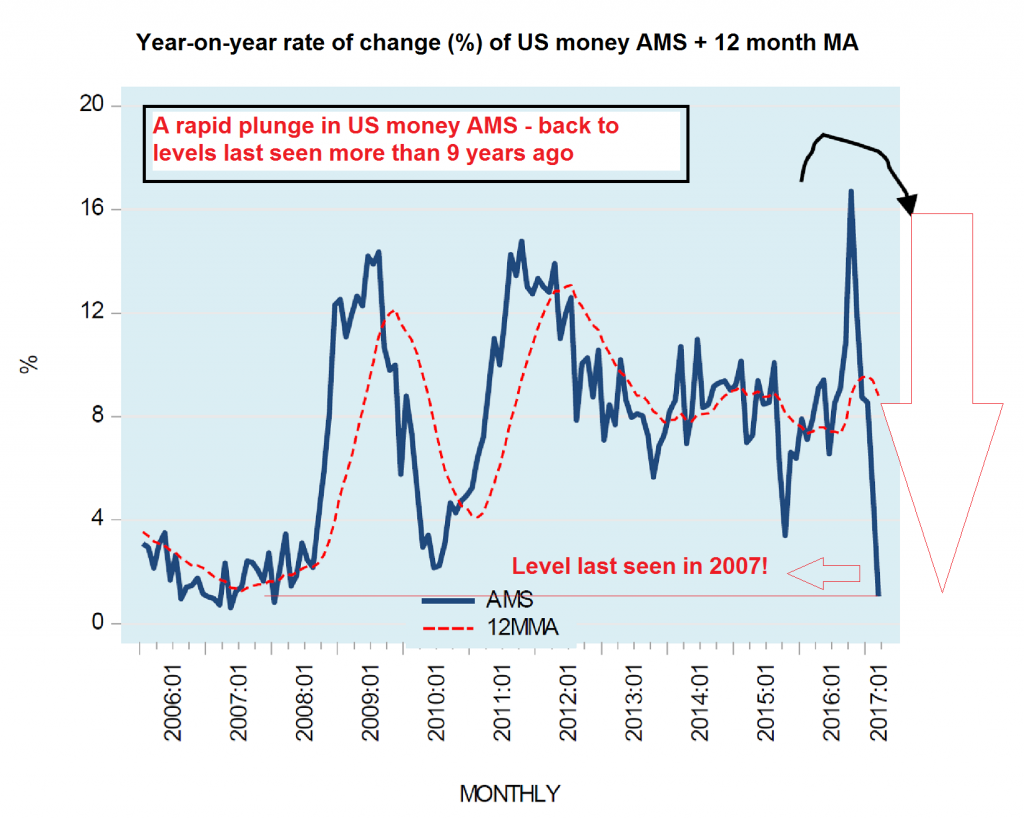 Money AMS growth has gone all the way from a peak well above 16% y/y in November 2016 to the low single digits recently – a level last seen in 2007 - Click to enlarge |
| The broad money supply TMS-2 has followed suit, with its y/y growth rate falling to 6.12% recently, which is the lowest since October 2008. We include the growth rate in total bank lending again (at 4.73% from a recent peak at 8.12%) but have added the annual growth rate in commercial and industrial loans, which is updated more frequently.
The latter data series shows that bank lending growth has continued to slow rather noticeably in recent weeks. C&I loan growth has now fallen from an interim peak of 13.43% to a mere 2.24% y/y as of late April. |
TMS Total Loans, July 2007 - May 2017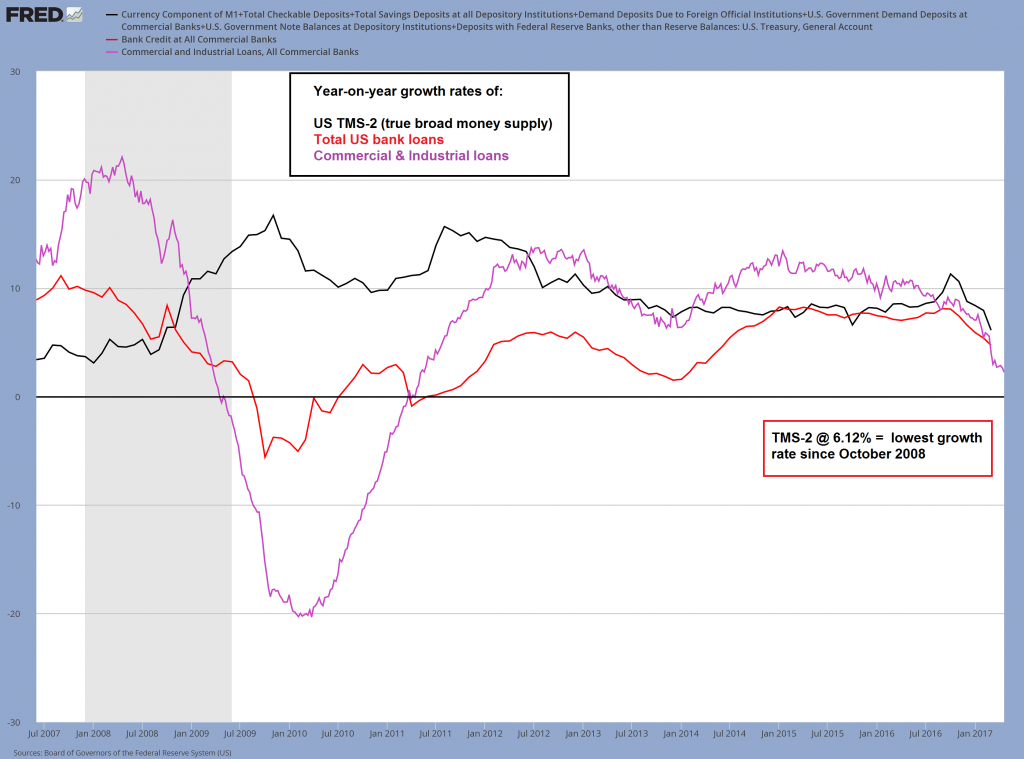 Y/y growth of money TMS-2, total bank loans & commercial and industrial loans. Note the continued slowdown in C&I loans (purple line) - Click to enlarge |
| And here are two more chart that should give everyone pause. Both show the y/y growth rate in federal tax receipts. First a shorter term one:
It is remarkable that federal tax receipts are slowing so dramatically with the stock market still near an all time high (usually asset bubbles tend to boost tax revenues noticeably). Here is a longer term version of the same chart. The point of this is to show that this is a fairly reliable signal – since the mid 1960s the ratio between recession signals that were valid and those that weren’t was seven to three (the current decline is not included in this count). However, of the three false signals, one coincided with the 1987 stock market crash, and the other one with the S&L crisis about 18 months later. |
Federal Tax Receipts And Recessions, 1980 - 2017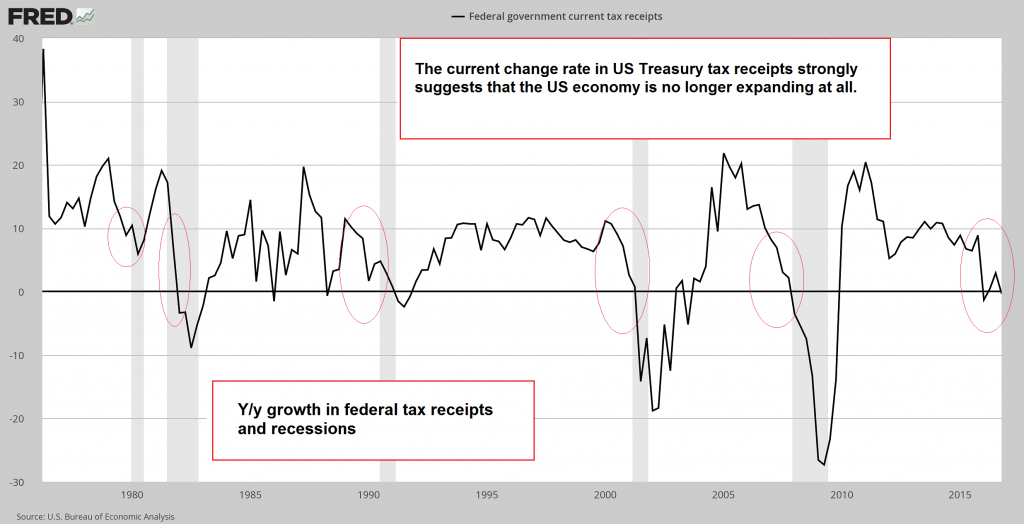 - Click to enlarge |
ConclusionAll is probably not well. That may not become obvious just yet in the very near term, but if the trends depicted above continue, various bubble activities will get into severe trouble as the year progresses. It may finally be time to batten down the hatches. |
Federal Tax Receipts Long Term, 1965 - 2017 Long term chart of the y/y growth rate in federal tax receipts. Declines into negative territory are often a sign that the economy is about to step off a cliff. - Click to enlarge |
Full story here Are you the author?
Tags: central-banks,Chart Update,newslettersent