


Lance Roberts
My articles My offerMy siteAbout meMy videosMy books
Follow on:TwitterSeeking AlphaFacebookAmazon
The S&P 500 is down roughly 7% from its January 27 all-time high. Unsurprisingly, the media is full of "red" headlines discussing the seemingly "endless" correction we are in. Unsurprisingly, previously complacent investors are now anxious, as nothing seems to be working. But that index-level headline conceals something far more alarming: stock market breadth has collapsed. According to Morgan Stanley, approximately 42% of S&P 500 members are already down 20% or more from their 52-week highs. More than 200 companies are in their own private bear markets, even as the index itself is not.
This was a point we noted in this past weekend's Bull Bear Report:
"J.P. Morgan captured the paradox: the S&P 500 is down only ~9% despite oil rising 70% and the Fed shifting from pricing two cuts to a 50% probability of a hike, and software falling 20%. As we noted recently, a much larger correction is underway in the market."

While "times have been tough lately," this is not a new phenomenon. Stock market breadth deterioration almost always precedes index-level damage, not the other way around. On March 9th, we noted in Technical Deterioration: Risk Management Is Key:"
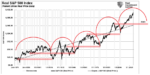
"More importantly, the RSI exhibited a textbook bearish divergence at the all-time high: price made a new peak, but momentum did not confirm. We repeatedly discussed that divergence was the earliest signal of the distribution phase now unfolding. With the RSI not in oversold territory below 30, there is room for more pressure before a technical bounce becomes probable."
Here is an updated chart showing that previous divergence. Along with waning stock market breadth, relative strength is now in oversold territory.

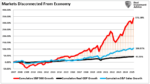
What's unusual today is the degree of divergence between individual stocks and the cap-weighted index. When a handful of stocks carry enough weight to paper over widespread internal damage, investors holding diversified portfolios feel the pain long before the headlines acknowledge it.
Furthermore, as detailed in The 200-DMA Just Broke, the deterioration is not uncommon of corrective markets. That break, combined with deeply oversold momentum readings and AAII bearish sentiment, creates a historically specific setup.

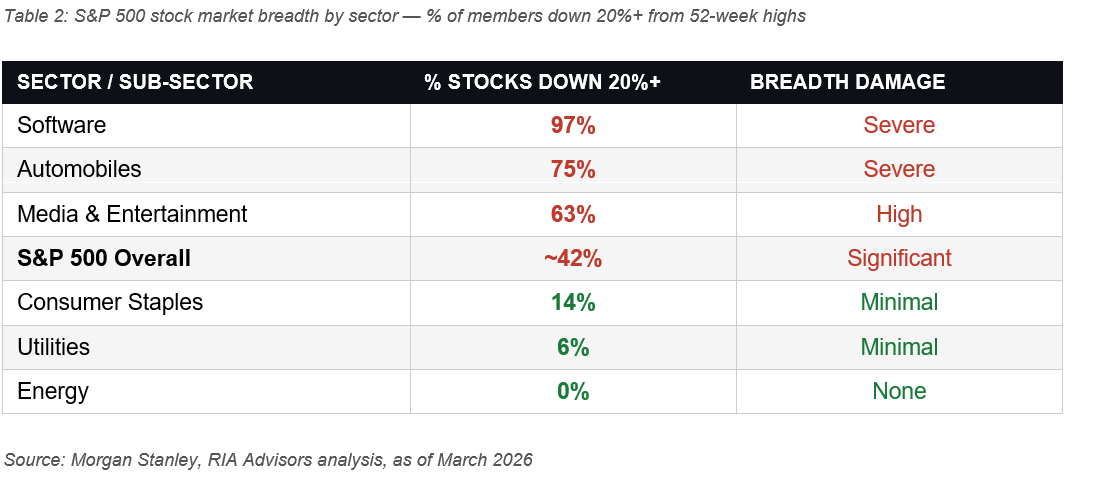
The breadth story is quite fascinating. The software sector has 97% of its S&P 500 members 20% of more below their respective 52-week highs. Automobile stocks follow at 75%, with media and entertainment at 63%.
The other end of the distribution is equally instructive. Energy stocks have zero members in bear territory. Utilities sit at just 6%, and consumer staples at 14%. Those numbers confirm the rotation that's been underway since January.
"Significant rotation trades, characterized by heavy trading activity in and out of various sectors and factors, have led to large daily divergences in the performance of certain sectors. The market's surface may look calm, but beneath it, passive investors are actively shifting between narratives, valuations, and risk exposures." — RIA Advisors, February 2026
So, what likely happens next?

Reading the 200-DMA Break: Six Signals, Mixed Picture
Since 2000, the S&P 500 has broken its 200-DMA on a sustained basis seven times. The average one-month return following those breaks was -5.3%, and none produced a positive first-month return. The average 12-month return after a sustained break was -4.0%.
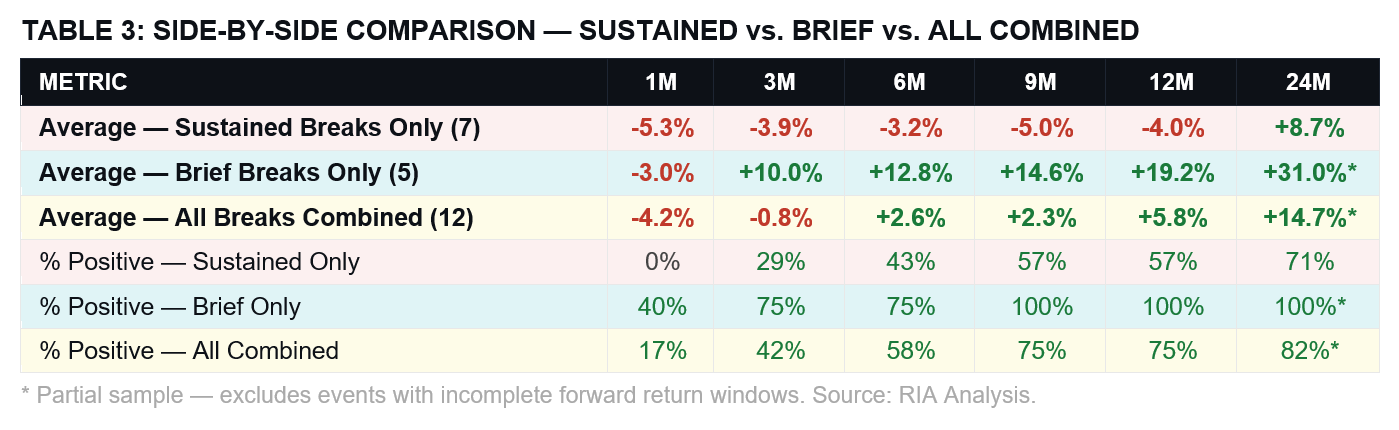
But the distinction between a sustained break and a reflexive whipsaw matters enormously. When the 200-DMA was already flat or declining before the price crossed below, every major bear market since 2000 followed: 2000, 2008, 2022. When the 200-DMA was still rising at the break, as it is currently, the average 12-month return was +19.8%, with a 100% hit rate for positive returns at 3, 6, 9, and 12 months.
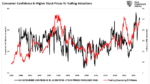
Today's scorecard is mixed. The 200-DMA is still rising, RSI is now below 30, and AAII bearish sentiment has risen sharply. and well above the 45% contrarian threshold. These are all still bullish. Against that, the weekly MACD had already turned negative before the price break, which has preceded every sustained bear since 2000. Stock market breadth, measured by the percentage of S&P 500 stocks above their 200-day moving averages, has dropped sharply and is below the 60% level that historically characterizes whipsaw recoveries.
Bank of America's Michael Hartnett described the current environment as approaching a "buyable washout." He is probably correct, but until the Iran situation is resolved, or at least a path to resolution is visible, the risk of a deeper decline can not be discounted. However, investors shouldn't panic-sell this correction. As JPMorgan's global market strategist, Jack Manley, noted:
"When there's a bad sell-off, that bad sell-off is typically followed by a strong bounce back. Given the nature of this sell-off, the likelihood for that bounce back, whenever it occurs, to be pretty concentrated and pretty powerful is that much higher."
In that previous article, we examined every instance since 2000 where all three conditions aligned simultaneously: stock market breadth deterioration with 40% or more of S&P 500 members in bear territory, the index trading below its 200-DMA, and both MACD and RSI in oversold territory. Six comparable episodes emerged:
- October 2002,
- March 2009,
- February 2016,
- December 2018,
- March 2020, and
- October 2022.
If those dates don't mean anything to you, those were the months that previous corrections and bear markets ended...not began.
Yes, the near-term picture is uncomfortable, and the average one-month return in these setups is -2.1%, with only 42% of periods producing positive outcomes. While pain tends to extend, and a lower low within one to three months is the historical norm rather than the exception, it serves to wash out weaker hands.
It is the medium- and long-term data that convey the real message. By 12 months, the average return climbs to +14.6%, with 75% of comparable periods producing positive outcomes. At 24 months, average returns reach +26.3%, and the positive hit rate rises to 83%. The investor who stayed positioned through the fear, in all six of these episodes, came out far ahead of the investor who sold into it.

The Permanent Cost of Panic Selling
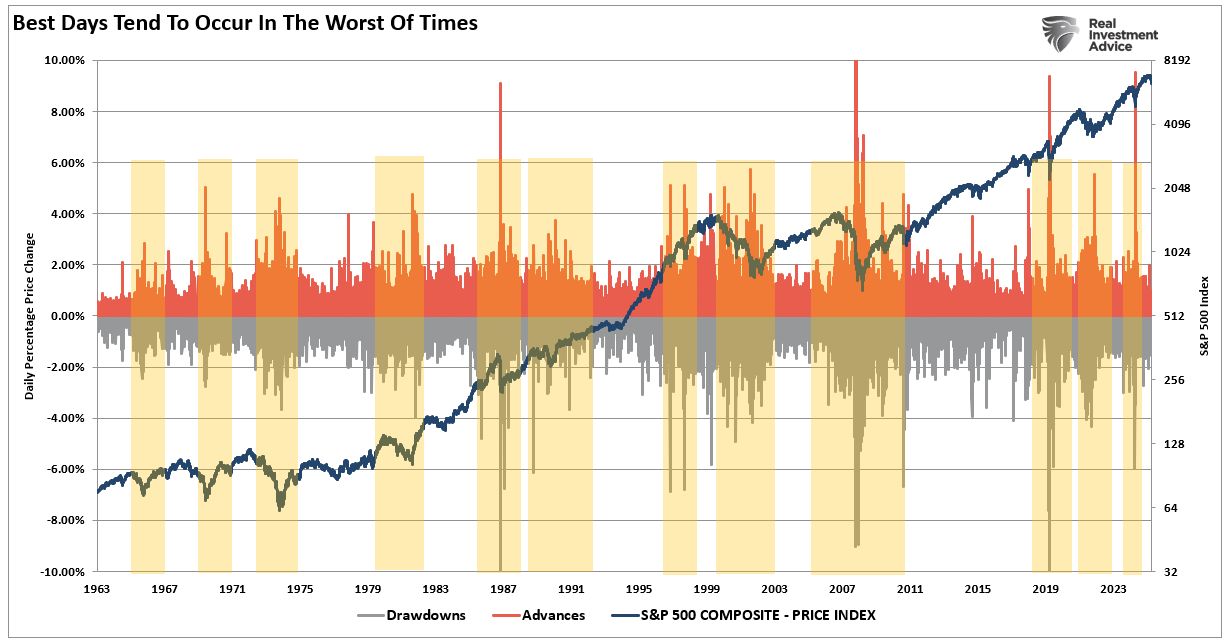
The single most damaging decision most investors make during periods of falling stock market breadth is selling. The data on this is unambiguous. Seven of the market's 10 best days in any given 20-year period occur within two weeks of the 10 worst days, according to JPMorgan Asset Management research. The best days follow the worst days because fear-driven selling creates dislocations that are rapidly corrected. You can see this in the chart below, that the best and worst days are clustered together.
In other words, while investors are always told to just "buy and hold" because they will miss the 10-BEST days if they don't, investors should focus on mitigating the risk of significant capital losses during those periods.
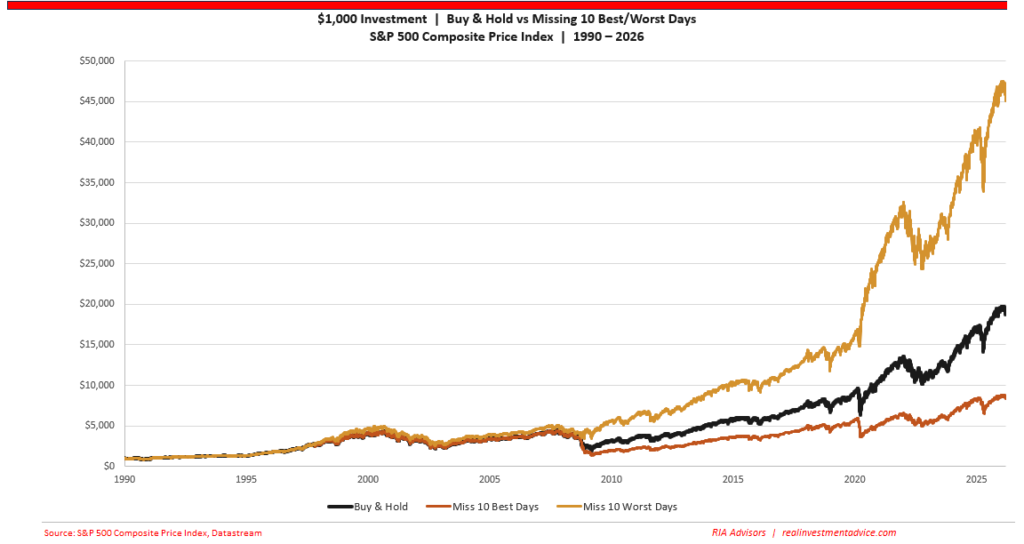
This doesn't mean you can effectively miss all the bad days; however, given that higher-volatility periods tend to cluster, understanding when to reduce exposure can significantly improve outcomes over time. Even if you miss the 10-best days along the way. That math applies with particular force in setups like the current one. Since 1974, according to data compiled by Clear Perspective Advisors, the S&P 500 has returned more than 24% on average following a market correction. Only 25% of the 48 corrections since World War II have progressed into full bear markets. In other words, there is a 75% chance this correction will not turn into a bear market. However, dismissing that 25% entirely is just as foolish for future outcomes.

The One Variable That Changes Everything
The honest caveat to all this data is the recession. The two worst outcomes in the six-episode dataset, 2002 and 2008, were both accompanied by genuine economic contractions that extended the drawdown far beyond what the averages suggest. In those cases, forward returns at 12 months were still negative.
Today's macro environment doesn't yet show the classic recessionary signatures that preceded those two episodes. The 200-DMA is still rising, not declining, but time will change that. The Fed retains room to cut rates, but higher sustained oil prices could curtail that. Furthermore, deeply oversold sentiment indicators have historically correlated more with fear peaks than with the beginning of prolonged selling cycles. But oversold markets can, and have, become even more so previously.
Whether the Iran conflict and its oil price transmission into consumer spending and corporate margins eventually tips the economy into contraction remains the central unresolved question. That question is the one thing that investors need to guard against the most.
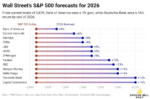
Goldman Sachs has held its 7,600 year-end S&P 500 target through the recent sell-off, anchored by projections of roughly $309 per share in 2026 earnings and $342 in 2027. That base case rests on 12% earnings growth and an economy that continues to expand despite the headwinds from the Iran conflict. Goldman's own bear cases are sobering: a moderate growth shock takes the index to 6,300, while a severe oil-driven disruption could push it as low as 5,400, with the forward P/E compressing from 21x to 16x in the worst case.
JPMorgan has moved more decisively in the other direction, cutting its year-end target to 7,200 from 7,500 on March 19, citing oil supply shut-ins of 8 million barrels per day, the highest on record, and warning that markets are dangerously underestimating the demand destruction risk. JPMorgan strategist Dubravko Lakos-Bujas explicitly flagged near-term downside to 6,000–6,200, noting that four of five oil shocks since the 1970s have preceded a recession. Neither bank is calling for 2008. But the spread between their base cases and their downside scenarios has rarely been this wide.
Here is the most important point.
"Stock market breadth will eventually resolve, either by individual stocks recovering toward the benchmark level, or by the index itself catching down to the damage that's already been inflicted."
History says the former is far more likely given the current configuration of indicators. Given that backdrop, here are some steps to consider with respect to your own personal situation, goals, and objectives.

Stock market breadth, by any measure, is at levels historically associated with significant forward returns for patient investors. Three of the six key indicators that separate a brief, recoverable 200-DMA break from a sustained bear market are currently bullish, not bearish. That doesn't mean the pain is over, as near-term data suggest a lower low is possible. However, for investors who can navigate the storm, clearer skies and calmer tides will eventually prevail
The goal isn't to time the bottom. Nobody does that consistently. The goal is to avoid permanent capital impairment from panic selling, reduce risk through disciplined rebalancing, and be positioned to participate in the recovery. Based on every comparable episode in the modern era, that recovery has come, and it has come faster than the fear of the moment would suggest.
SOURCES & METHODOLOGY
Forward return data: RIA Advisors analysis of six comparable historical episodes (Oct 2002, Mar 2009, Feb 2016, Dec 2018, Mar 2020, Oct 2022) where all three conditions — 40%+ of S&P 500 stocks in bear territory, index below 200-DMA, and RSI/MACD oversold — were simultaneously present. Sector breadth data: Morgan Stanley, via RIA Advisors, "The Bear Market Hiding Beneath the Calm Surface" (March 2026). 200-DMA break analysis: RIA Advisors, "The 200-DMA Just Broke: What Every Investor Should Know" (March 23, 2026). JPMorgan best-days data: CNBC, April 2025, citing JPMorgan Asset Management. AAII sentiment: aaii.com. Fear & Greed Index: feargreedmeter.com. Goldman Sachs and JPMorgan price target data: TheStreet, March 2026. Corrections history: Carson Wealth, Ned Davis Research, Hartford Funds.
This article is for informational and educational purposes only and does not constitute investment advice. Past performance does not guarantee future results. Investing involves risk, including the potential loss of principal.
The post Stock Market Breadth: Warning Or Opportunity? appeared first on RIA.
Full story here Are you the author?You Might Also Like
2026-03-02
A specter is haunting Wall Street—the specter of the “SaaSpocalypse.” Since the iShares Expanded Tech-Software Sector ETF (IGV) peaked on September 19, 2025, it has fallen roughly 30%. For context, the broad technology indexes like XLK and QQQ are essentially flat over the same period, and the semiconductor ETF (SMH) is up 30%. Between mid-January …
 Speculative Narrative Unwinds
2026-02-09
For nearly two years, markets were driven by the same speculative narrative that “this time is different.” Bitcoin, precious metals, and AI-linked equities rose not only because of robust fundamentals, but also because investors clung to powerful narratives about inflation, disruption, and monetary collapse. Those speculative narratives are not only seductive but also contribute to …
 The South Park Market Of 2026
2026-01-23
I have been a “South Park” fan for as long as I can remember, and while the show isn’t a market guidebook, its brutal satire cuts through nonsense better than many Wall Street commentaries. Just like on the show, characters make absurd decisions and face absurd consequences, which is familiar to investors today. For example, …
 Bull Market Genius Is A Dangerous Thing
2025-12-15
During extended upward-trending markets that reward risk-takers and punish caution, everyone is a “bull market genius.” That dynamic flips investor psychology and, over time, creates a false sense of control. As the market continues to climb, risk appears to vanish, and investors believe that nothing can go wrong, leading them to take on increasing levels …
 The DPI Link To Margin Debt
2025-12-08
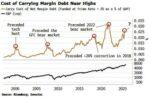
A recent article by Simon White, via Bloomberg, discussed the rising cost of margin debt for investors. While his analysis below compares the cost of debt to GDP, we will also consider a more critical comparison to disposable personal income (DPI). Here is Simon’s point. “Yet, where history does raise a red flag is if …
 A Bear Market Is A Good Thing.
2025-12-01
One of my favorite writers for the WSJ is Spencer Jakab, who recently penned an article explaining why a bear market is not necessarily a bad thing. He starts with a quote from “The Godfather.” ““These things gotta happen every five years or so, ten years. Helps to get rid of the bad blood…been ten …
Tags: Bear Market,Featured,Investing,Lance Roberts,newsletter,recession,S&P 500,Technical Analysis


