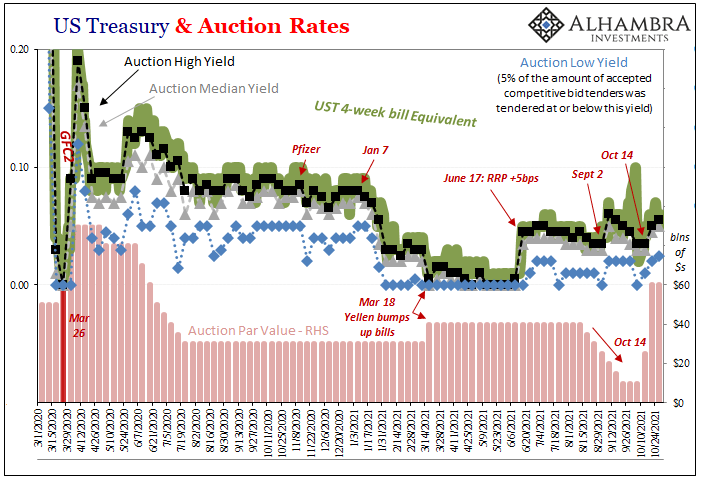
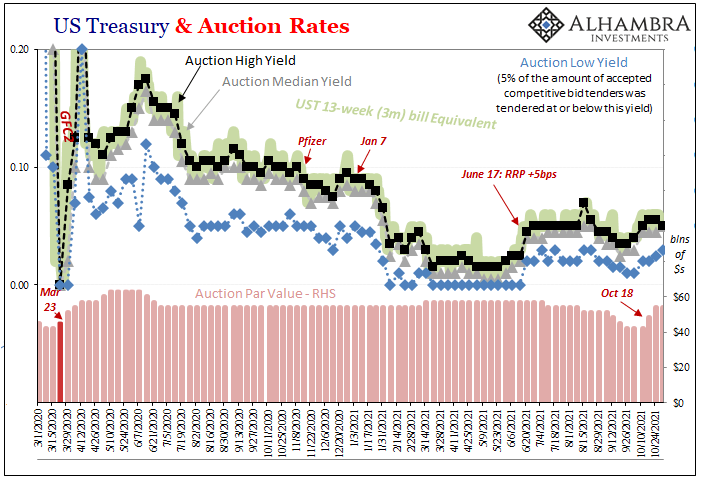
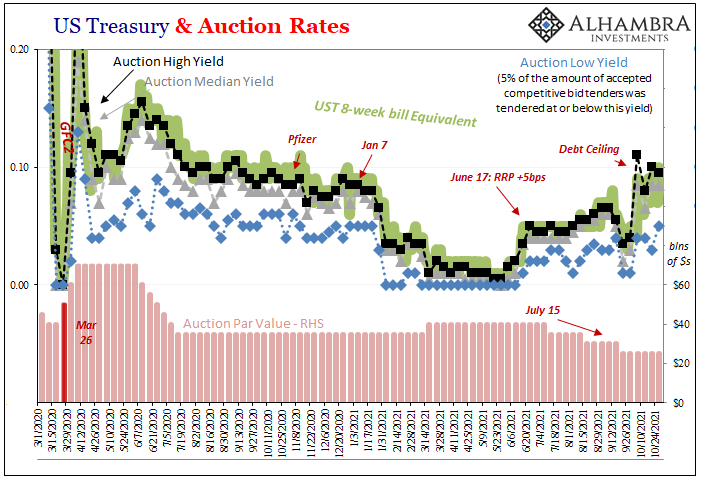
| Treasury Secretary Janet Yellen hasn’t just been busy hawking cash management bills, her department has also been filling back up with the usual stuff, too. Regular T-bills. Going back to October 14, at the same time the CMB’s have been revived, so, too, have the 4-week and 13-week (3-month).
Not the 8-week, though. Of the first, it’s been a real tsunami at this tenor, too. Up to early August, Treasury had regularly (weekly) sold $40 billion in one-month paper. From then to the end of September, that schedule was pared back to just $10 billion weekly, a dramatic decline of what was available. The first auction on October 14 got it back to $25 billion, then each of the last two at an incredible $60 billion! |
|
| Three-month bills had been scaled back from $57 billion weekly down to $42 billion, and now the past couple are up to at least $54 billion.
It’s only the 8-week maturity which is being avoided – both in the secondary market as well as both sides, bidders and seller, in the primary auction process. This, then, indicates that the high yields for this particular security have everything to do with the December debt ceiling rather than the deluge of the other T-bills and their CMB cousins. |
|
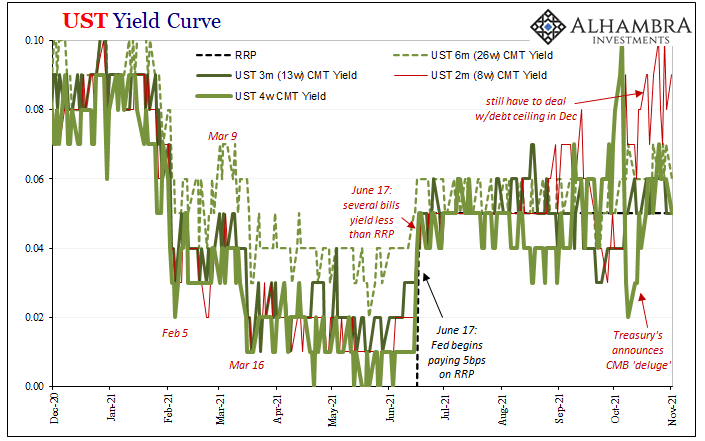
| But if it is only the 8-weeker which is losing price for that reason, isn’t it fair to ask why the other bill yields are not substantially higher given just how much of them and those like them have been sold off in a very short period of time? In other words, why didn’t this torrent of supply lead to a more noticeable difference in prices? The only higher rates are for the one whose supply hasn’t come back.
While money market funds eat up a lot of issuance normally for their own purposes, given some of the primary market prices (yields substantially less than RRP) as well as, particularly the past few days (below; there were even a couple “scrambles for collateral” visible on the chart both last Wednesday and Thursday, too), the secondary market, too, it’s just not economical without a return at least a dependable bp or two greater than five. |
|
| And, again, the only T-bill issue there is the 8-week (or the 42-day CMB) which are the very maturities MMF’s are purposefully avoiding (at the margins). | |
| This, then, helps us identify demand for bills as something other than MMF’s. Yep, collateral.
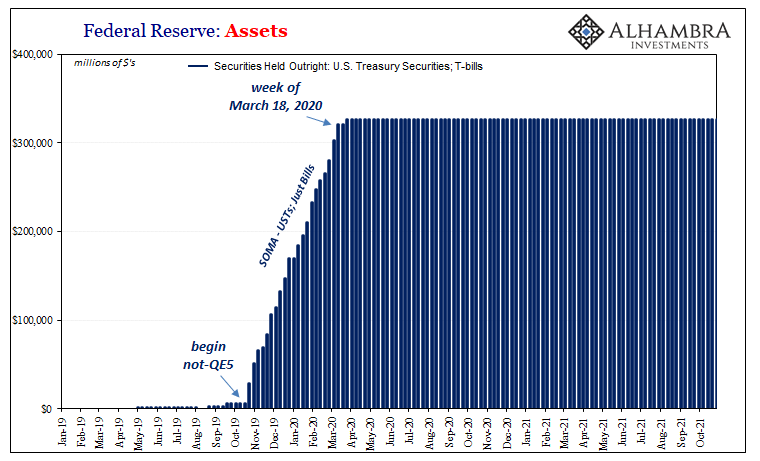
When it comes to collateral, there are only two primary factors; or, at least two primary categories of factors. The first is supply, which begins with what Treasury issues and then can get subtracted from what the Federal Reserve steals back (QE). In our current case, strictly speaking T-bills, the government has sold a boatload more of them, better than $300 billion in a matter of weeks, and demand has been steady to increasing. Since QE hasn’t changed – Jay Powell quietly but wisely keeps avoiding bills apart from reinvestment – this leaves us with only the other factor: dealers and the effects of risk aversion on balance sheet constraints. Supply can go up, and even if the Fed doesn’t spoil it the dealer system can (and has) by reducing the collateral multiplier even considering that jump in supply. |
While we can’t observe this in practice, these bill prices and how they’ve behaved during the huge bump in what’s been offered (factoring MMF’s and debt ceiling) provides us a pretty sizable clue.
Eurodollar University’s Making Sense; Episode 91: Almost Perfect Example of Collateral Scramble
It might be reasonable to consider that the multiplier has dropped somewhat, probably somewhat more than enough to slightly offset what positive, reflationary impacts should have been exhibited from supply alone (another lesson in how there is no such thing as ceteris paribus). All things equal, that huge burst of new issuance really should have produced a noticeable reflationary trend (beyond a small move in CNY), not just rising bill yields but across-the-board in fixed income.
All things are never equal, and the yield curve outside of bills keeps flattening – another crucial indication of risk aversion to go along with the behavior of bill markets currently.
More supply but less multiplier, then what could/might happen when December comes along and we have to do this debt ceiling stuff to restrict supply all over again? Will the collateral multiplier expand to offset or partially offset it?
It doesn’t seem likely at all, not the way things stand right now. On the contrary, we have to more seriously consider whether the global funding system is being set up for potentially another landmine scenario?
We aren’t there yet, yet it is already a question worth beginning to consider.
The ingredients are all here: “growth scare”; curve mechanics; indicative collateral side; the further implications of “rising dollar stuff” globally. The next few weeks will be interesting, to put it mildly, in how this all works out together (which wouldn’t necessarily mean everything goes to Hell should we see the landmine effects, just that the next dollar shortage would be confirmed requiring a whole lot more work to then interpret what this might mean going forward).
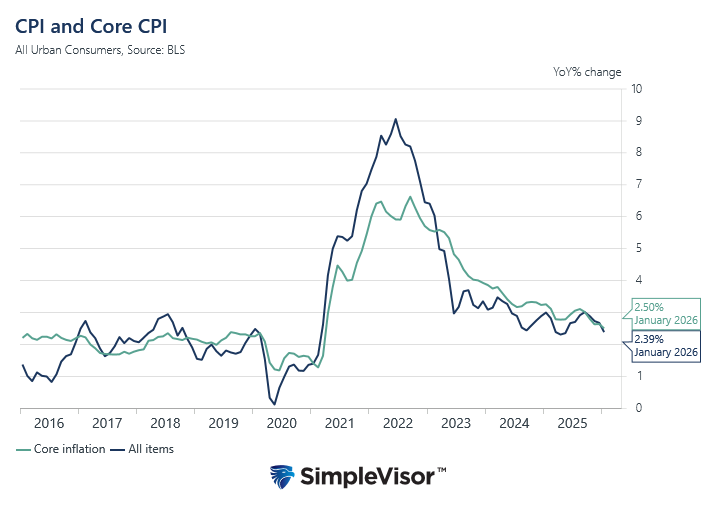
Like previous times, the whole world’s being told to get all on one side, “inflation”, while in reality the potential really is all on the other.
Tags: Bonds,collateral,currencies,economy,Featured,Federal Reserve/Monetary Policy,federal-reserve,Markets,newsletter,Primary Market,QE,reverse repo,supply,T-Bills,treasury bills,U.S. Treasuries,Yield Curve


