


Joseph Y. Calhoun
My articles My siteAbout meMy videosMy books
Follow on:LinkedINTwitterSeeking AlphaAmazon
A couple of weeks ago the 10 year Treasury note yield rose 16 basis points in the course of 5 trading days. That move was driven by near term inflation fears as I discussed last week. Long term inflation expectations were and are well behaved. I wrote nearly 2000 words last week about that change in inflation expectations and I’m so glad you took the time to read it. And now you can forget it because over the next four days all but 2 basis points of the move in the nominal 10 year was reversed. And 10 year TIPS yields were actually up 2 bps last week so inflation expectations fell back to where they were. So, do we now have a growth scare instead? Maybe. Or maybe we’re just guilty of a little myopia.
The idea of a growth scare was reinforced by the release last week of some weak economic data. The Chicago Fed National Activity index, released on Monday, fell into negative territory but barely at -0.13. The change was negative but a miniscule change from the previous month’s reading of 0.05. And all it means is that economic growth changed from growing very slightly above trend to growing very slightly below trend. We actually prefer to use the 3 month average to smooth out the month to month changes and that still stands at 0.25. So, yes, a negative development on growth but mostly just noise and the bond market barely budged.
The big move of the week for bonds came on Wednesday after the release of the trade data on goods which showed a rather sizable contraction in exports and a small rise in imports. The drop in exports was mostly in the industrial supplies category which fell 9.9%. I have not yet determined what exactly fell so much so I can’t comment on whether it really means anything. But the bond market didn’t care as the 10 year note yield fell 10 basis points on the day – the market took it as a negative surprise. Maybe but a further deterioration in our trade balance, given our current budget deficit, is hardly a surprise or certainly shouldn’t be. And over the balance of the week the 10 year yield recovered some of what was lost. Still, the 10 year yield fell on the week by about 10 basis points reversing almost entirely the “inflation scare” of the previous week.
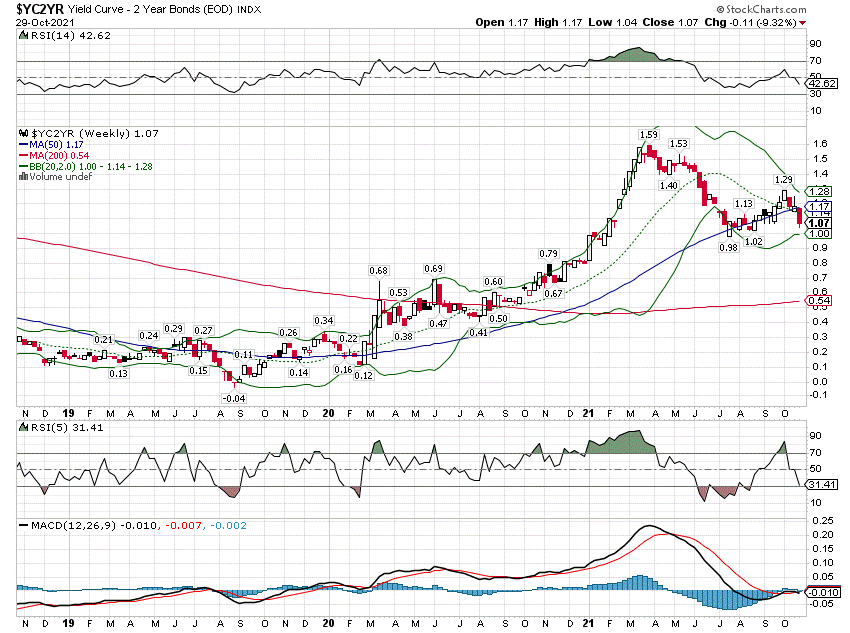
One indicator that continued to show concern about growth last week was the yield curve. The curve has been flattening lately because the 2 year yield has been rising while the 10 year yield has stalled. Actually, if you measure from the beginning of October, what’s really going on is that long term yields are just rising at a slower pace than short term rates. They were both higher in October. Nevertheless, a flattening yield curve is widely accepted as a negative sign for economic growth. The steeper the curve the better future growth will be and the flatter it is, the worse. Growth and the yield curve are inversely correlated.
It is not only widely accepted but well documented in economic research. Heck it’s even widely accepted and widely known by laymen. Everyone knows (and everyone knows that everyone knows) that if the yield curve inverts, you get a recession. And for most of the post-WW2 period that has certainly been true. There were a couple of false signals but overall the yield curve is one of our better recession indicators. You might remember that the 10 year/2 year Treasury yield curve inverted in August of 2019 and we certainly got a recession after that. And that’s my point about myopia. We did get a recession. 8 months later. At the onset of a pandemic. Now, it may be that we would have had a recession anyway so maybe that doesn’t mean anything. And the true perma-bears out there will probably tell you we were already in recession when COVID hit. But, with all due respect to the ursa permanens, we really don’t know that. What we do know is that yield curve inversions generally happen prior to recession but the time lag can be considerable. And the 7 months between the inversion in August of 2019 and the onset of recession in February 2020 is actually on the short side.
In the previous recession, the yield curve first inverted in February 2006 and the recession officially started in December of 2007 or 20 months later. In the millennium recession the curve first inverted in February of 2000 and the recession started in March of 2001. The one before that the curve inverted in January of 1989 but the recession didn’t start until July of 1990. The correlation between the yield curve (10/2 curve) and future economic growth (using payrolls as a proxy because it prints monthly instead of quarterly like GDP) peaks at about 30 months. Historically, the inversion of the yield curve comes 6 to 24 months prior to recession. And we aren’t even close to inverted by the way, so if you’ve read any articles or blog posts recently warning about imminent recession because the curve is flattening, I’d suggest that maybe those sources ought to be purged from your reading list. A flattening curve today is an indication of falling growth expectations but those expectations will take some time to be realized and they are subject to change.
| The economy slowed over the summer and we got the Q3 GDP report last week to confirm it. Frankly, I thought the 2% reported growth rate wasn’t that bad. We weren’t going to keep growing at 6%+ like we did in Q1 and Q2 so a slowdown was inevitable. And the market told us pretty loud and clear – in real time – that the economy was slowing as bond yields fell all summer. Maybe that was just a natural reaction after the surge early in the year or maybe it was due to delta or probably some of both. But the weak data we got last week tells us only about the past, not the future and the trend in bond yields is still up and the trend of the yield curve is toward steeper. You just need a little perspective: |
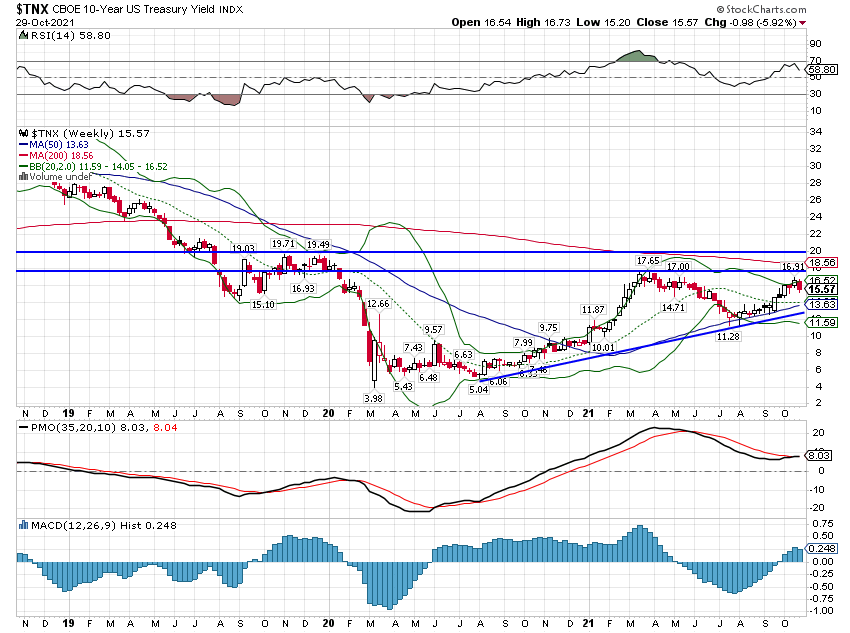 . |
| And there were good economic reports released last week too even if you had to read the details to find it. The personal income report headline was a drop of 1% but that was entirely due to the end of the COVID economic supports such as extended unemployment benefits. Wages and salaries were actually up 0.8% month to month and 9% in Q3 which was more than Q1 and Q2. Durable goods orders were down 0.4% but within that report, core capital goods orders were up another 0.8% (13.2% yoy), an indication that companies continue to invest. Jobless claims continued their fall, down to a post pandemic low of 281K. Personal consumption expenditures were up 0.6% with 2/3s of the gain in services (health care, food service and accommodations) which is consistent with the idea of an acceleration in Q4 growth, post delta. |
 . |
| The Dallas, Richmond and KC Fed surveys were all better than expected and significantly improved from last month. The Chicago PMI, which includes services, was better than expected and up from last month too.
We also saw an improvement in the Conference Board’s Consumer Confidence index from 109.8 to 113.8 which by the way is higher than it was in 2010, 2011, 2012, 2013, 2014, 2015, 2016 and 2017. Both the present situation and expectations indexes were higher. The U of Michigan consumer sentiment survey also improved. Everything isn’t perfect as even the “good” reports contain data points that don’t look all that great. But overall, most of these more forward looking reports have been pretty positive. I will warn though that I don’t put a lot of emphasis on sentiment survey style information. It is not hard data and is subject to all kinds of biases by the respondents and the questioners. I’m not saying that all is well, the slowdown is over, kumbaya and party on. But I do think we all need to stop obsessing over the little day to day, week to week movements and get more perspective. And maybe just leave open the possibility that there are some positive things going on. We know there are a plethora of changes going on in the labor market. I have said previously that I think some of the changes are potentially quite positive but we won’t know that for some time. One thing I am pretty sure of though is that at least for now, workers have some bargaining power and they are using it. This is the quarterly change in the Employment Cost Index: |
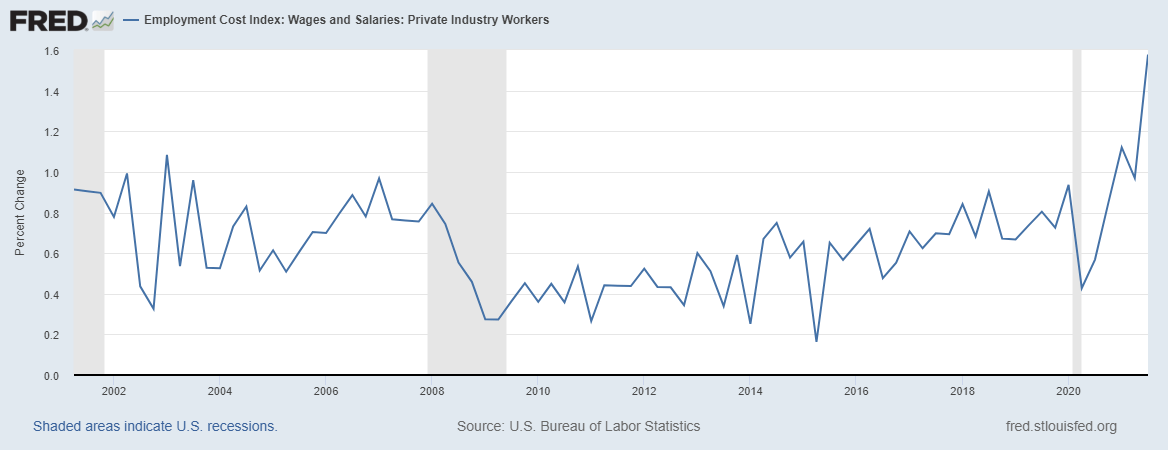 . |
| Wages and salaries are rising at a rate not seen in 20 years. Whether that is good or bad depends on how companies respond to it. If they are able to raise prices and make them stick, then the impact could be inflationary. If they can’t, it might be reflected in weaker profit margins. There is one way for it to be neither. Think about it and I’ll write about it soon.
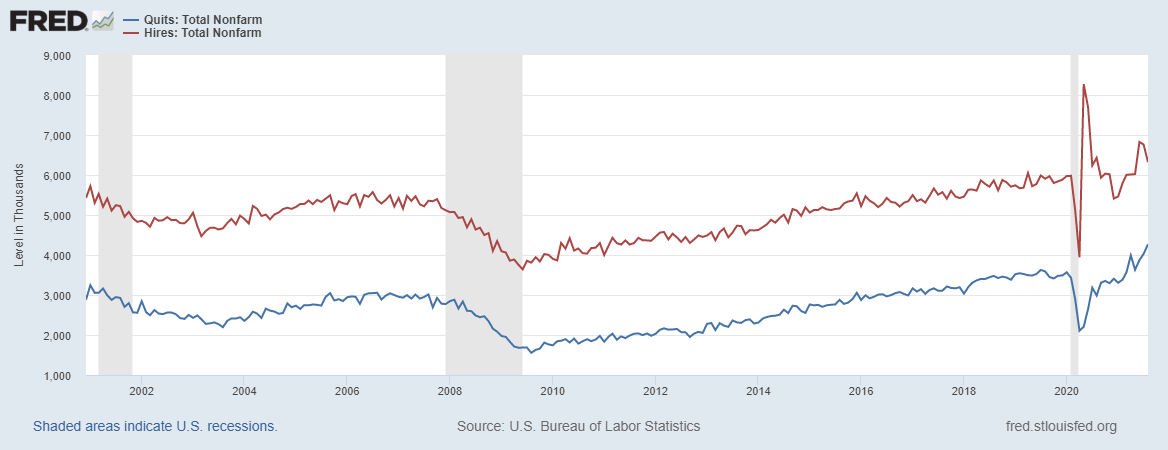
One last item I thought about last week while reading multiple articles about the Great Resignation. It is now common knowledge that workers are quitting their jobs at record rates. And the reasons are varied, some of them positive, some of them negative. But I don’t think most people know that hires are also rising and, despite a recent pullback, are still above the pre-COVID trend. So, yes, people are quitting their jobs….and getting hired too. |
 . |
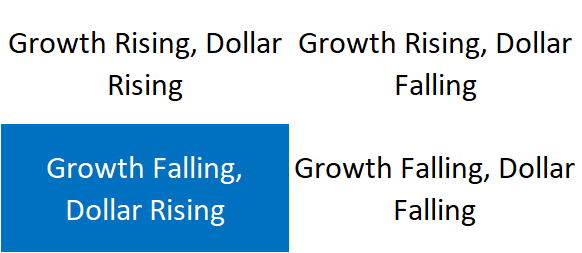
| After all that happy talk you might think I would make a change to the economic environment to rising growth….but you’d be wrong. 10 year TIPS yields are still stuck at nearly -1% and have barely budged off their lows. The low was in early August at -1.19% and we’ve only been able to rise by 23 basis points since then to -0.96%. That just doesn’t say anything good about future economic growth and until it starts to show more improvement I’ll keep the environment at falling growth where it has been. In reality it has stopped falling but not falling isn’t the same thing as getting better. The dollar is still in a short term uptrend in the context of a long term trading range. |
 . |
|
I covered most of this above so I won’t rehash but two other potentially positive items is that new home sales appear to be recovering after slumping in the first half of the year and house price rises may be moderating. |
 . |
|
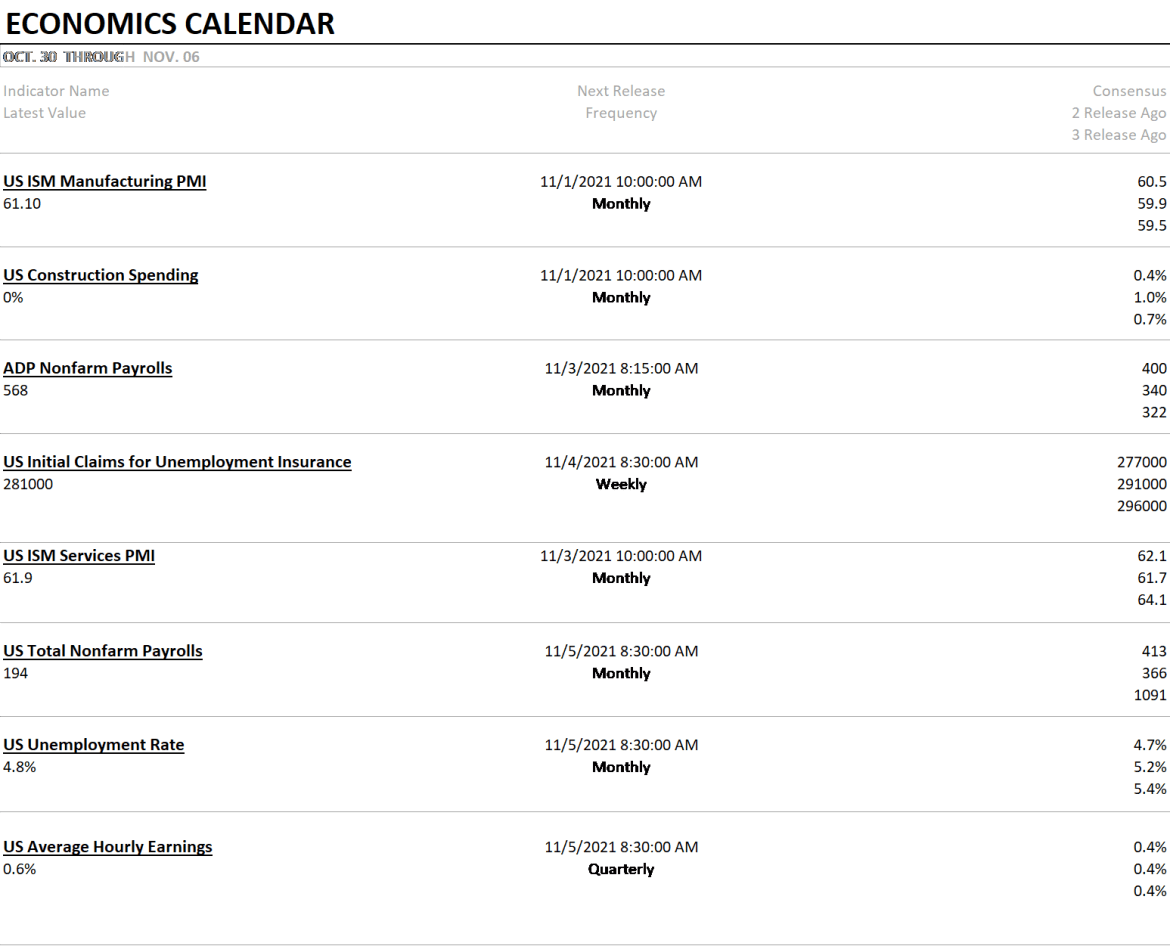
We get October payrolls next week so we’re going to get a clean read on the impact of ending extended unemployment benefits. I suspect it will be a mild positive. We also get the ISM reports next week which should be pretty good based on the recent regional Fed surveys.
|
 . |
|
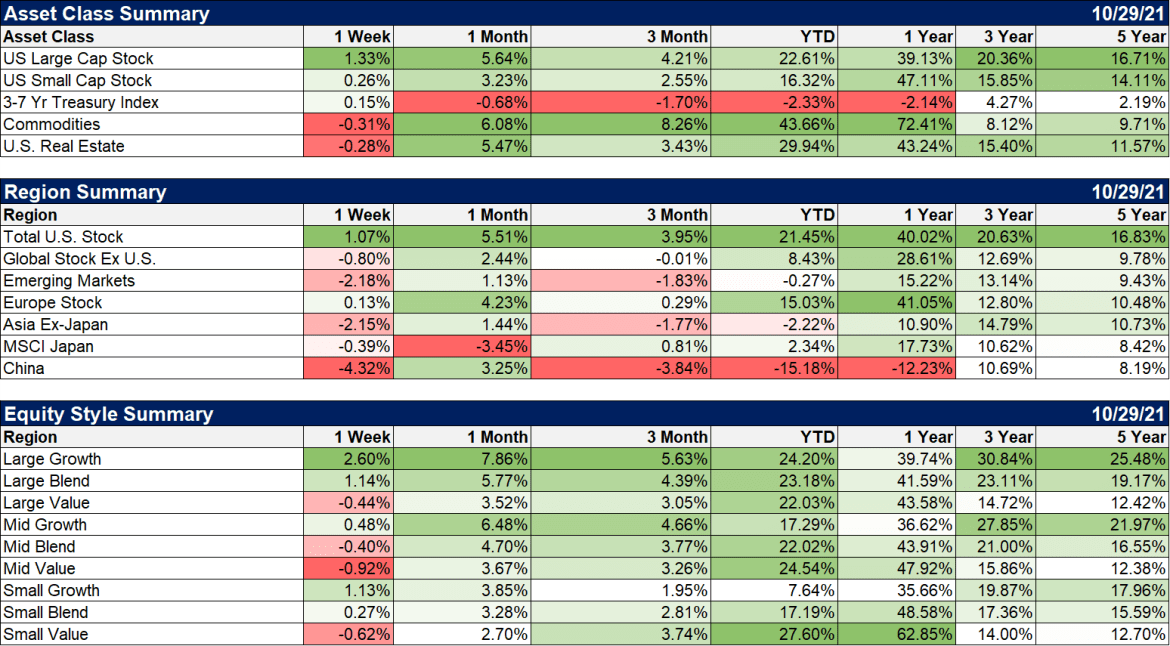
US stocks were up some last week but it was a decidedly growth stock affair. Growth is now leading for the year by a couple of points. Non-US markets were mostly down last week with the exception of Europe which managed a tiny gain.
|
 . |
|
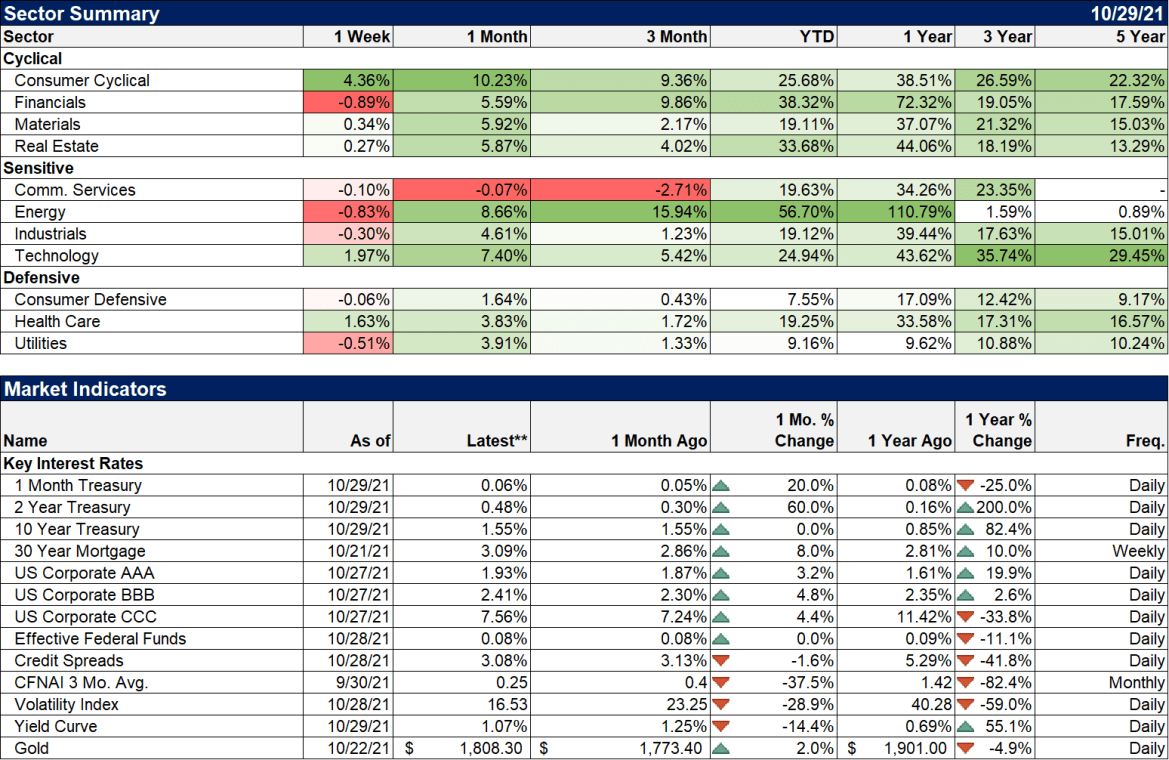
The gain in consumer cyclicals is a function of the sector ETF we use to track that category. We use the SPDR Consumer Discretionary sector ETF but we may have to look for a replacement. Tesla is now the largest holding and Amazon is second. Those two stocks now make up over 40% of the fund. Tesla had a pretty good week, up 22.5%. Not sure that ETF is providing us with the information we want. If we change it I’ll let you know. Other than that, it was technology and healthcare leading the way. |
 . |
The reasons to worry about global growth are pretty well known from China’s crackdown and return to its socialist roots to high energy prices to potential tax changes. But things that are well known don’t move markets and with everyone concentrating on the bad news, it probably makes sense to look for the good. Don’t waste your time worrying about things that are already well worried.
Last week’s market movements were no more a growth scare than the previous week’s were an inflation scare. Tune out the noise so you can hear what the market has to say. And realize that on many days, in many weeks, it says nothing at all.
Full story here Are you the author?Tags: Alhambra Portfolios,Alhambra Research,Amazon,Bonds,cfnai,commodities,Consumer Confidence,currencies,dollar,economic growth,economy,employment cost index,Featured,GDP,growth stocks,hires,inflation,inflation expectations,Interest rates,Markets,newsletter,Real Estate,stocks,TIPS,US dollar,value stocks,Yield Curve


