| Initially, the dots got all the attention. Though these things are beyond hopeless, the media needs them to write up its account of a more fruitful monetary policy outcome because markets continue to discount that entirely. Dots look like inflationary success if possibly even now more likely, whereas yields and especially bills have (re)taken a more skeptical approach pricing almost no chance for it.
Buried in the FOMC minutiae on Wednesday was an upward adjustment first to IOER and then the RRP (each by 5bps, bringing the former to 15 and the latter to 5). Supposedly, “abundant” reserves continue to be “printed”, becoming awfully more abundant still, leaving policymakers the task to make sure “too much money” doesn’t spoil their policy range. |
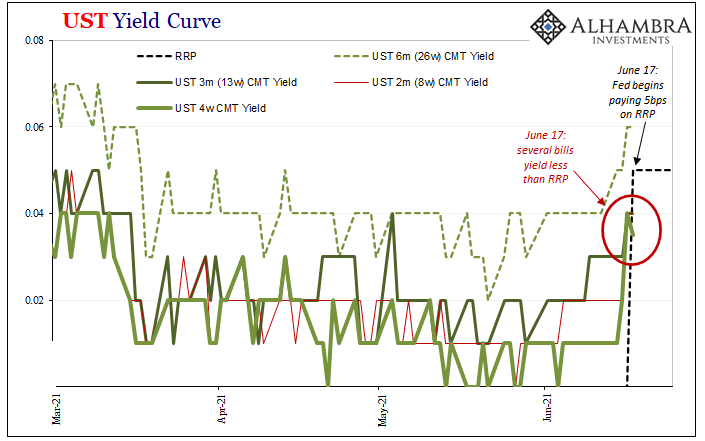
UST Yield Curve, Mar 2021 - Jun 2021 |
| This has been the conventional view ever since RRP use spilled over back in mid-March.
Having raised particularly the RRP to now 5 bps effective today, however, first the Fed enticed even more participants to its window – as anyone would’ve expected. Pay more, see more activity. According to FRBNY, this afternoon’s RRP total was an astounding $755.8 billion from now 68 counterparties, up from $520.9 billion just yesterday. That’s not the important part, either. Having raised the policy “floor”, Jay Powell and his group have unwittingly shown the market hand: collateral, not “abundant reserves.” Not that it must be either/or. On the contrary, there’s as much excess cash especially in the hands of money market funds which are seeking out alternatives to sinking money market rates. That’s absolutely happening, and the increase take-up today along with the higher RRP rate demonstrates as much. But even some part of that relates back to collateral constraint and scarcity, as I’ve written several times before. Here’s one from late May:
Had this systemic collateral constraint become so constraining, at some point we’d have expected it to break into the open; what I mean is, like 2017, such scarcity would have placed a liquidity premium on bills such that the overbidding for them should’ve sunk their returns/yields below even the RRP “floor.” |
U.S. 1 Month Treasury Bill, Daily June 2021 |
I even said as much back in February before all this really got going:
The zero boundary is and has been a tough one to cross. Bill yields occasionally touched it, especially at auctions, but they hadn’t overcome the nominal bottom making it seem like, on the surface, the RRP was indeed performing the way it was meant to. But, was it really the RRP “floor” or had it been the zero lower bound which kept bills from crossing under and exposing this collateral constraint premium? Here’s where the FOMC has done us a huge and inadvertent service; by raising the RRP 5bps off the zero lower bound, it has given this bill, collateral premium the space to “show itself.” Which, on the very first day of the new RRP rate, it just did: |
U.S. 3 Month Treasury Bill |
| The reverse repo is at 5, yet bill yields at the 4-, 8-, and 3-month maturities are all less than this. Why? It can only mean this one thing, a premium relating to value for some other utility, otherwise nothing would ever yield below this secured alternative with the Federal Reserve. Who would buy a 4- or 8-week UST bill returning one and a half maybe two basis points less than lending to the Fed secured by the same instrument?
If there wasn’t a collateral constraint, the RRP would act like a hard floor. It isn’t and we’ve seen this before. Thus, why UST note and bond yields, for example, have almost perfectly correlated with RRP usage in the “wrong” way. |
UST Yield Curve, Jul 2020 - Jun 2021 |
| It’s supposed to be more “too much money”, higher chances for inflation. Instead, more RRP, greater anti-reflation across the bond market. With T-bill yields now underneath the RRP – just like 2017 – it draws a very real and tangible picture about why so much anti-reflation angst. An out-in-the-open collateral premium uncovered for the world to see.Except, while it’s very easy to see today hardly anyone will be able to appropriately interpret this. The entire financial media and internet filled up with “too much money.”
This system is still broken in all the same ways because the media runs around with “abundant reserves” when in any functional, legitimate sense these collateral tight money problems remain unfixed and even unacknowledged in favor of the QE/bank reserve puppet show. |
TIPS Inflation Expectations, Jan 2019 - Jun 2021 |
And it’s not just T-bills along with note and bond nominal yields which exhibit signs of these same factors. Even TIPS inflation expectations have correlated with RRP, too, which, again, seems to be at complete odds with the Fed’s massive increase in “money printing.”
It’s not just “transitory inflation” we’re talking about in all these things, either. In fact, the last few CPI’s and whatnot don’t even rate. Instead, this is all – again, like 2017 – about the very real, growing probabilities that this collateral issue will go on unmentioned, unmeasured, and unmovable to the point that, balance of probabilities, it gets to be too disruptive and eventually, quite predictably breaks everything down leading inexorably to the next false dawn.
This was, after all, the real story behind 2018 (just like 2015 and 2011).
The same disinflationary, sometimes deflationary condition as the past almost fourteen years. Nothing whatsoever has changed, and now the RRP change shows more clearly this as the real underlying disorder.
Full story here Are you the author? Previous post See more for Next post
Tags: bank reserves,Bonds,collateral scarcity,collateral shortage,currencies,Deflation,disinflation,economy,Featured,Federal Reserve/Monetary Policy,FOMC,inflation,Markets,newsletter,Reflation,reverse repo,T-Bills,treasury bills,U.S. Treasuries


