| With the UST yield curve currently undergoing its own market-based twist, it’s worth investigating a couple potential reasons for it. On the one hand, the long end, clear cut reflation: markets are not, as is commonly told right now, pricing 1979 Great Inflation #2, rather how the next few years may not be as bad (deflationary) as once thought a few months ago.
On the other hand, over at the short end, yields are dropping toward zero again. This steepening isn’t quite the “good” version. Supply issues are coming to T-bills, as we know, but anything else? |
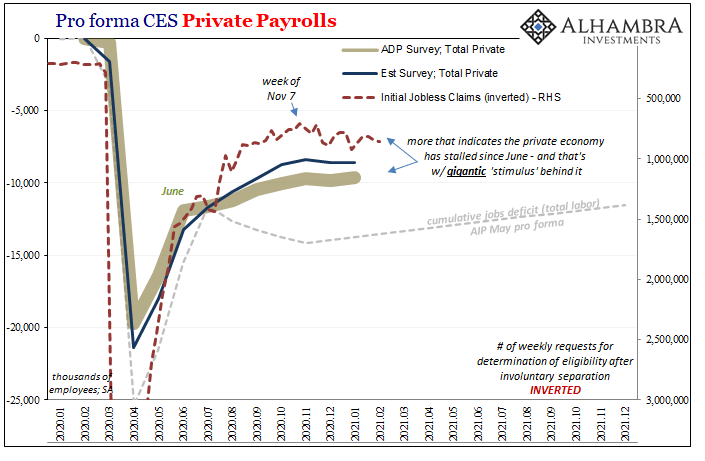
Pro forma CES Private Payrolls, 2020-2021 |
| There’s been demand for these instruments which predates Janet Yellen resurfacing at the Treasury Department to unleash TGA drains and debt refunding.
I gave one longer-term explanation for heightened(ing) bill demand here (NPL’s and possible bank downgrades on an economy that stumbles rather than gets stimulated). I offered another technical possibility last Friday, one that would account for both sides of the yield twist:
|
UST Yield Curve, 2020-2021 |
| Given a choice, while these banks can use bank reserves to satisfy some surcharges, maybe they’d prefer selling off long end UST’s in favor of holding onto T-bills (or even buying more).
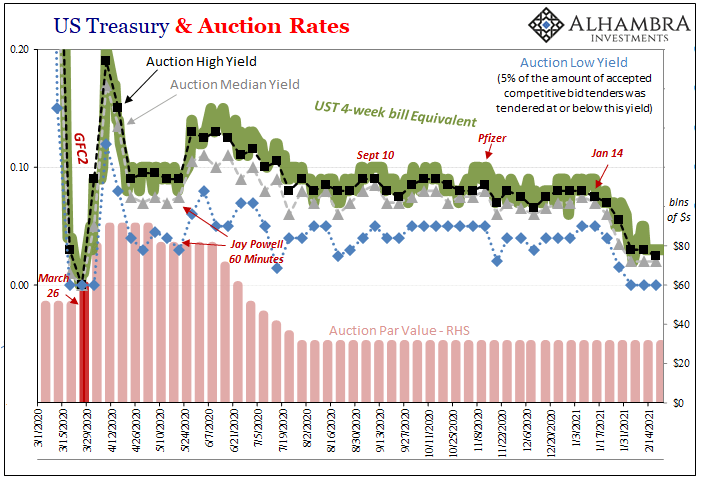
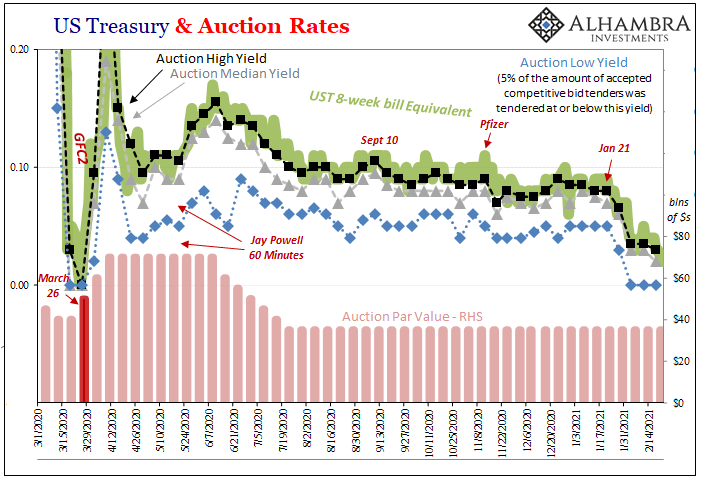
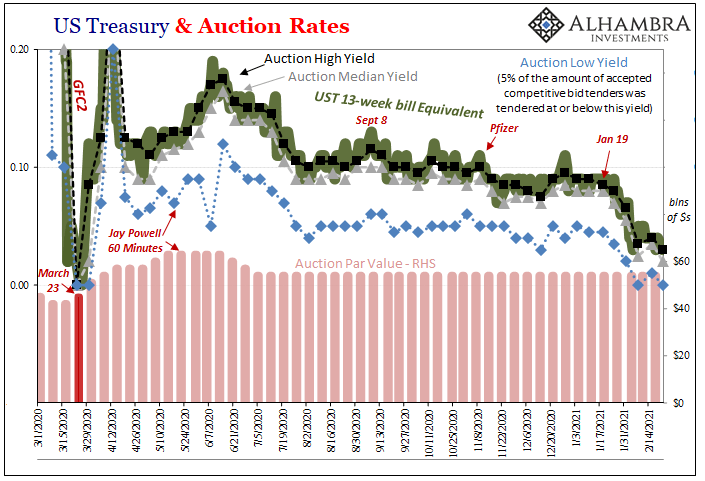
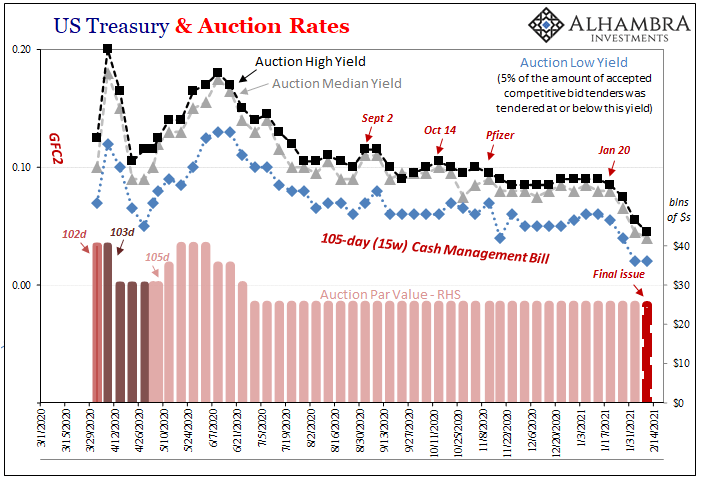
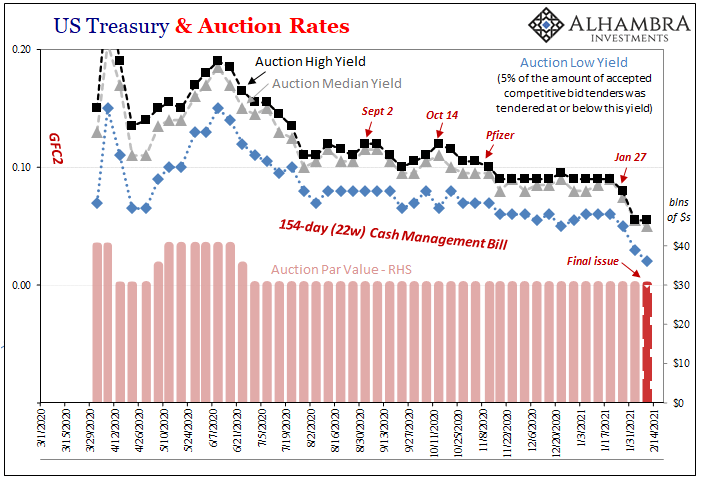
Looking into recent price/yield history, yeah, that’s in there: While November 10 represented Pfizer’s “stunning” vaccine announcement, it was also around that time jobless claims bottomed out therefore rising economic retrenchment risks; riskier in the short and intermediate terms with rising reflation potential if we can get beyond all that (which markets are becoming more complacent about the possibility). In early January, reflation was given another boost, allegedly, by the results of the Georgia Senate elections which cleared the path for more gigantic “stimulus.” Yet, bills weren’t performing that way at all; in fact, since around January 20 or even as early as January 14 (the latter for the 4-week bill; specific dates depend upon the specific maturity) that’s when bill rates really started to decline. |
US Treasury & Auction Rates, 2020-2021 |
| That means for the past month we do find both how determined selling at the long end (reflation) really picked up pace and then an equal if not more determined buying frenzy registering up at the front – just as the SLR “cliff” scenario would figure. |
US Treasury & Auction Rates, 2020-2021 |
US Treasury & Auction Rates, 2020-2021 |
|
US Treasury & Auction Rates, 2020-2021 |
|
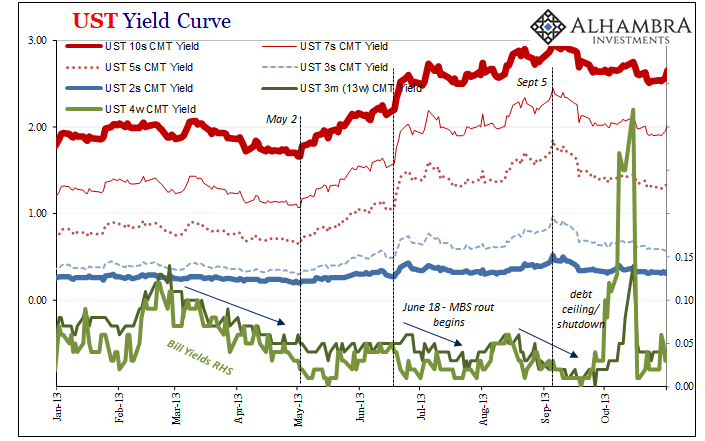
| There’s also another possibility from the bill end, however, which takes us back to 2013’s grossly misunderstood “taper tantrum.” Resetting the scene (which means going beyond the simple mainstream view of Bernanke’s “taper”, a word he never actually said, one that merely assumes monetary policy controls bonds the whole way down the curve), big repo problems as early as February (Fed buying OTR paper, and also doing some screwy things in mortgage TBA), and then in late June a real MBS blowout.
Here’s how I described it back in August 2014, a little over a year after the fact:
The rout around June 22 2013 was especially dramatic, with carnage being whispered as similar to that of certain days in 1994 (and other historic bond crashes). Not long after that, the major mortgage banks (which excludes Citi of the largest financial firms) began announcing rather large job cuts in their mortgage departments. |
US Treasury & Auction Rates, 2020-2021 |
| If you’re really interested in the nitty gritty granular details, you can read more about them in each of these cited articles: dollar rolls, TBA pipeline shortfalls, and therefore what sure seemed to have been a rather drastic, problematic MBS collateral shortage as a result.
The simple version (written in January 2014):
Some reasons why (written in May 2014, just as Euro$ #3 was breaking itself out in repo):
|
UST Yield Curve, 2013 |
| Dealers were, and remained, curiously absent from any or all securities lending channels which should have offered collateral-side support – if that had been during the pre-crisis era. That’s really the whole thing; dealer willingness and capacity.
Given their absence, this 2013 shortage of collateral would, you’d think, spillover from MBS and dollar rolls into other highly pristine forms like T-bills: There it is; bill yields falling from before the period in question (back several months to late February 2013) and then the same sort of “twisting” (falling front rates, rising back end yields) once the MBS market was hit with material liquidity problems even as the long UST “rout” continued selling reflation. These diverging trends continued until almost the end of 2013, with mainstream focus on only the one side. But then, right from the start of 2014, Euro$ #3 became more and more apparent (CNY and long end UST yields, spike in the overall dollar and commodity crash by mid-year), the entire global system increasingly synchronized with the 2013 view from bills (and repo collateral) rather than the sunny side of reflationary “tapering.” |
The Short End Money Equivalents, 2017 |
A similar situation, though produced from somewhat different conditions, rematerialized in the latter half of 2017 (Reflation #3, or “globally synchronized growth”), too, when long end rates backed up while bill yields, though up nominally, too, they were conspicuously “too low” in their own way (dropping and remaining below the RRP “floor”; see: above). What inevitably followed ended up being, like the prior Euro$ cycle, consistent with the bill story (Euro$ #4) and would prove the whole thing yet another reflationary disappointment.
Whether an SLR cliff or other possible reasons (including technical hardships as interest rates rise, which wouldn’t be hardships if recovery was the real deal), action at the front can and has – several times – suggested “dollar” shortage when quite a lot of everything else, including the long end, is declared to be steadfastly, unambiguously on the side of surefire reflation and even inflation to the moon.
It may seem any dollar shortage idea is hard to find right now, with everyone screaming about governments having done way, way too much money-wise. It’s actually not that hard to find; that’s really all these reflationary trends have been. The dollar shortage becomes acute and impossible not to notice (Euro$ #n), and then recedes into the background (Reflation #n) allowing for these periods of mistaken identification.
The system’s still exhibiting key symptoms (the same, sadly) of being broken down, just not nearly as uniformly and openly as it had been during last year. That’s not quite the same thing as inflationary overshoot, though, is it?
What might this ultimately mean, beyond the more obvious? That’s next.
Full story here Are you the author? Previous post See more for Next post
Tags: Bonds,collateral,currencies,Deflation,economy,Featured,Federal Reserve/Monetary Policy,inflation,Interest rates,Markets,newsletter,Reflation,repo,T-Bills,Yield Curve


