|
Is it over? That’s the question everyone is asking about both major crises, the answer is more obvious for only the one. As it pertains to the pandemic, no, it is not. Still the early stages. The other crisis, the global dollar run? Not looking like it, either. Stocks rebounded because of “major helicopter stimulus” or because that’s just what stocks do during times like these. Some of the biggest up days have followed, and are often found in between, the greatest down days. But while shares were bought on Wall Street, other key markets were bought, too. Starting with T-bills. The 4-week bill’s equivalent absolutely tumbled today, down to just 12 bps by the close of trading (and under 10 bps in the afterhours session). Still the big demand for collateral, the rate for it closing in on zero and the first minus sign. That’s a big minus as far as the current state of global currency inelasticity spawning this gross market illiquidity. And it’s not just repo and collateral, this run has been reaching into all corners. The global basis is blowing out (negative spread, meaning dollar shortage in FX) and even unsecured markets, what’s left of them, now showing signs of counterparty avoidance. |
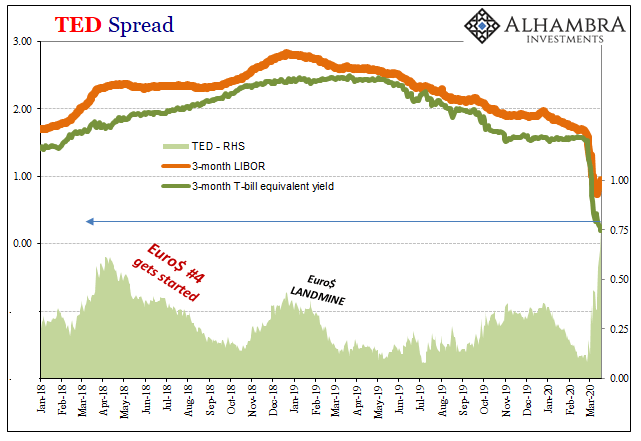
TED Spread, 2018-2020 |
| The spread between the 3-month T-bill yield and 3-month LIBOR (unsecured interbank in eurodollars) has blown out to its widest since 2016. Called the TED spread, while less important than it was in 2008 during GFC1 it’s still an indication of so much wrong in 2020 during GFC2.
Bill rates are falling on collateral demand, while 3-month LIBOR has jumped, despite rate cuts, on concerns of lending unsecured to other financial firms in eurodollar markets. Whenever TED gets moving higher during this increasingly nasty Euro$ #4, bad things typically follow. Noticeable moves in TED precede them rather than mark their end. While the long end of the UST curve was hit by heavy selling, as noted last week that’s not unusual for these kinds of times; meaning the worst periods. If it had been strictly reflationary sentiment like perhaps stocks, then commodity prices would’ve followed (or led) the upward drive. Instead, inflation expectations have sunk as have commodities like copper and crude. |
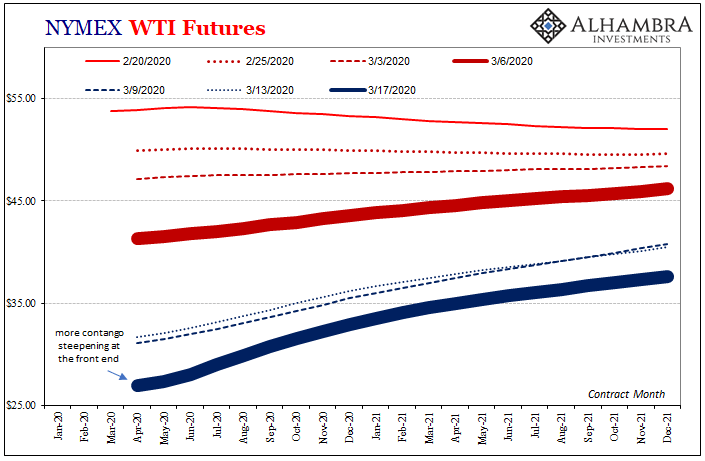
NYMEX WTI Futures, 2020-2021 |
| The former has finally cracked under the strain after having hung in around its multi-year low for what seemed month after month. GFC2, apparently, is Dr. Copper’s redline.
In WTI, the curve has continued to fall and as it does attains even more contango. It’s a negative signal for both the intermediate term as well as the short run. |
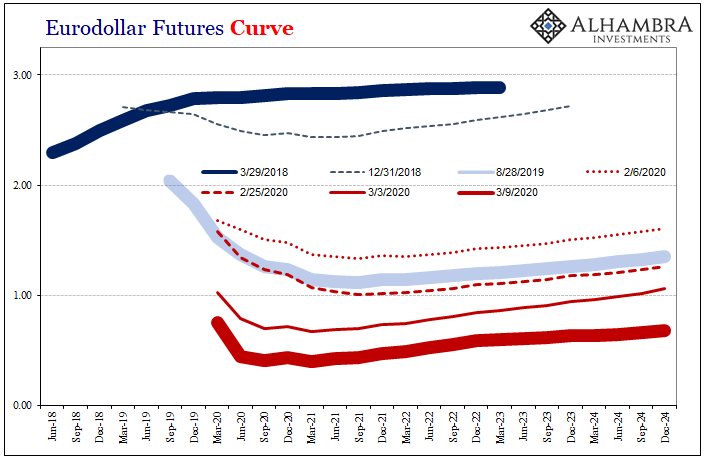
Eurodollar Futures Curve, 2018-2024 |
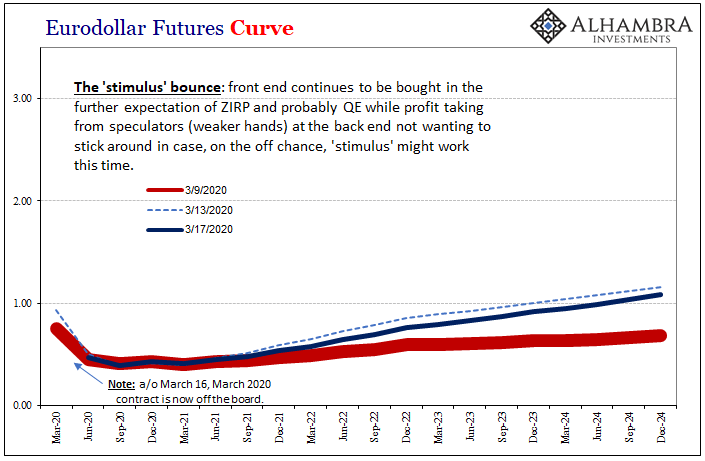
Eurodollar Futures Curve, 2020-2024 |
|
| The eurodollar curve isn’t feeling too positive about the 2008 policy reruns, either. Confirming the negative aspect of the long end UST selloff, the lack of liquidity part, eurodollar futures were mostly bid higher. After moving upward with the yield curve, over the past few days the eurodollar curve has been sinking lower and diverging.
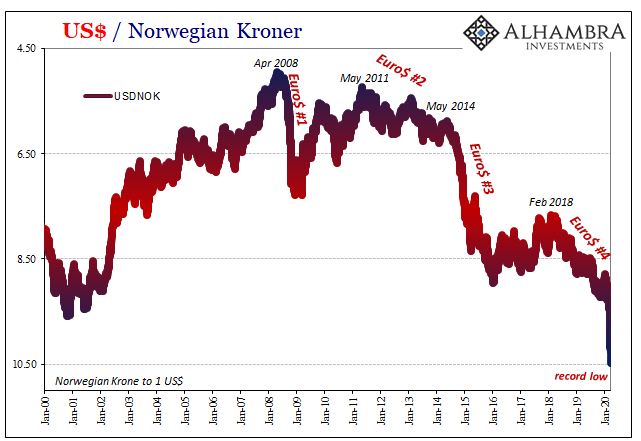
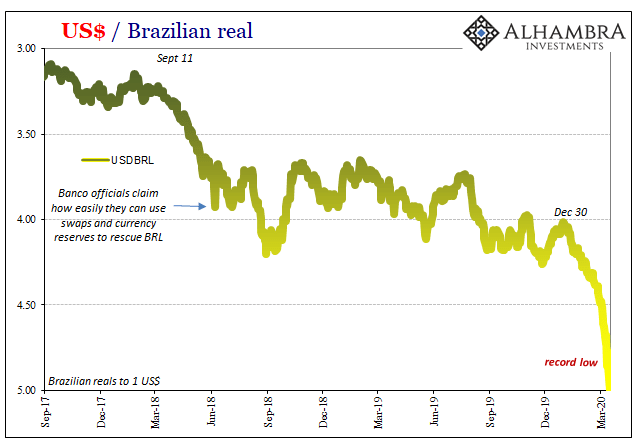
And, of course, the dollar keeps going up. DXY has joined the climb as key currency crosses put several of them into new record lows. Brazil as well as Norway, the latter a demonstration of where crude and offshore dollars come together (or don’t). Lower oil prices because of funding problems means funding problems for Norwegian financials beyond strictly oil fundamentals. The combination is a sharp, and instructive, plummet in the krone as well as Brazil’s real. |
US Dollar / Norwegian Kroner, 2000-2020 |
| Both key negatives pointing to more to come in GFC2. |
US Dollar / Brazilian real, 2017-2020 |
| One reason why this thing has gotten so far out of hand is because the system itself was weak and fragile heading into the pandemic. Sorry, Jay Powell, the economy wasn’t strong and, sorry, Janet Yellen, the financial system never gained its presumed “resilience.” Quite the contrary, September’s repo rumble was a demonstration of just how lacking in capacity and how risk averse its central components (dealers, not central banks).
It was the combination of growing concerns that were proven valid. Liquidity risks that have been increasingly priced into these markets ever since the middle of 2018 – that were given their increased weight because the global economy, and the US economy, too, had been pushed into a downturn long before the start of 2020 and COVID-19. The economic data we are getting now, and will get over the next several months, is largely irrelevant. |
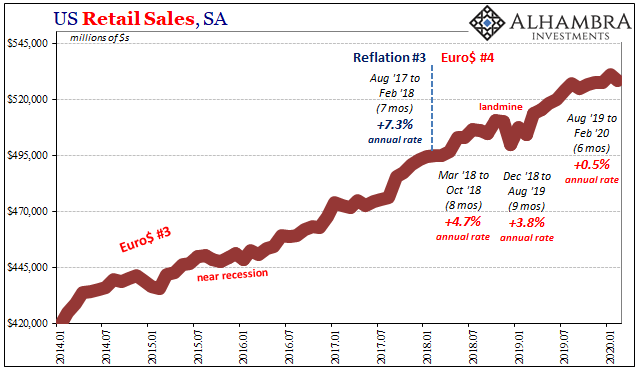
US Retail Sales, SA 2014-2020 |
| It has obviously been superseded by events, both in the spread of the disease and the direct fallout from that will surely be amplified by the meltdown in markets. Whatever the figures and estimates for recent months, they are going to turn ugly in short order.
They are therefore only of limited use and only in the sense of confirming the weakened state at the start of GFC2. Like GFC1, by the time the worst of it hit, the economy was already in a bad place; the Great “Recession” had actually begun at the end of 2007 and was already nearly a year old by the time Lehman failed and AIG was bailed out. |
US Retail Sales, SA 2017-2020 |
US Retail Sales, SA 2017-2020 |
|
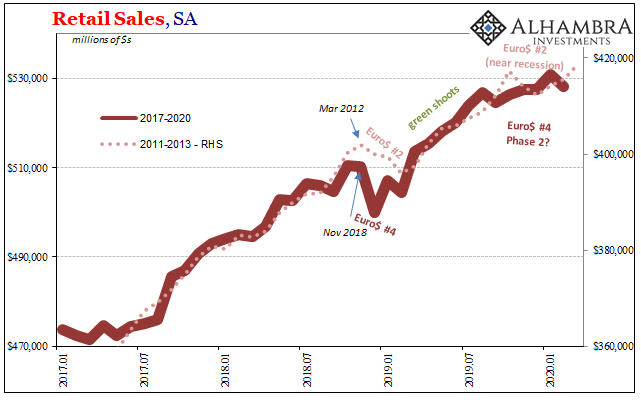
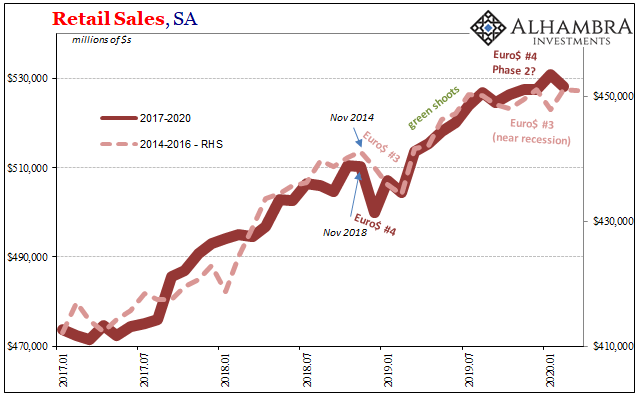
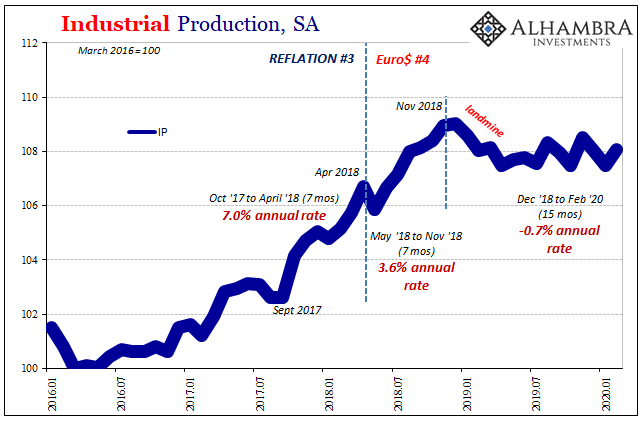
| Today, the Census Bureau released estimates for retail sales during February 2020, and the Federal Reserve numbers for Industrial Production in the same month. Both are pretty clear in illustrating the downturn heading into 2020.
Retail sales unadjusted benefited from leap year and last month’s extra day, pushing the annual gain to nearly 8% (also advanced by last February’s low base). Seasonally-adjusted, accounting for Feb 29, retail sales were up just 4.7% year-over-year, and down from January. In fact, retail sales have been essentially flat for half a year now – which is the major takeaway as it relates to the pre-existing downturn. |
US Industrial Production, SA 2016-2020 |
| Industrial Production was essentially the same in February 2020 as it had been in February 2019, continuing the sideways to slightly lower trend consistent with that slowing. | 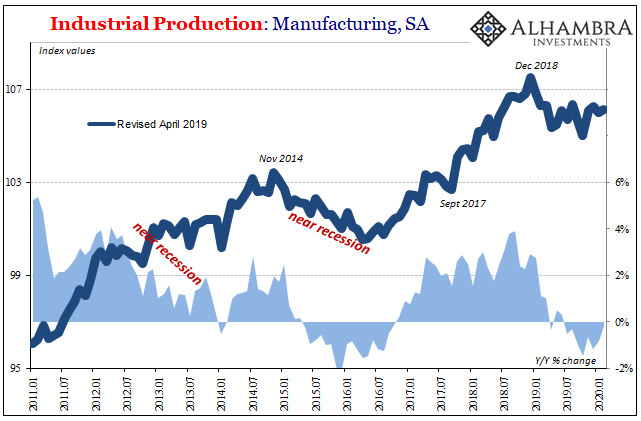 |
What concerns me the most, and I believe the same thing is spooking funding and bond markets, is how that can have an effect on what comes next. What we really want to know is what the system looks like on the other side of the pandemic. Will it be a quick return to normal – even if normal is a small downturn and stagnation at best – or will there be an even tougher road beyond.
The long end of these curves, even with the UST bond selloff, they’re all saying that this isn’t just the coronavirus. When it’s over, the monetary therefore economic problems aren’t going away like the disease surely will. The aftermath isn’t going to be pretty and it’s likely to stay that way for the foreseeable future.
No wonder there was talk over the weekend of closing markets. They are all saying that, whatever happens with the coronavirus, the weakened global system going into the outbreak is going to come out of it worse still.
And that explains the still-growing problems in funding markets. No matter what the Fed does, because of what the Fed proves it cannot do, risks all remain on the downside. Nothing kills modern eurodollar “money” quite like perceived vol. Realized volatility only raises the destructive bar.
Full story here Are you the author? Previous post See more for Next post
Tags: Bonds,Brazil,collateral,commodities,currencies,dollar,economy,Euro$ #4,eurodollar futures,eurodollar futures curve,eurodollar system,Federal Reserve/Monetary Policy,GFC1,GFC2,industrial production,Libor,Markets,newsletter,Norway,real,repo collateral,Retail sales,rising dollar,stocks,T-Bills,U.S. Treasuries


