


Jeffrey P. Snider
My articles My offerMy siteAbout meMy videosMy books
Follow on:LinkedINTwitterSeeking Alpha
|
Forward-looking data is starting to trickle in. Germany has been a main area of interest for us right from the beginning, and by beginning I mean Euro$ #4 rather than just COVID-19. What has happened to the German economy has ended up happening everywhere else, a true bellwether especially manufacturing and industry. The latest sentiment figures from ZEW as well as IFO are sobering. Taking the former first, it had been quite buoyant last year on the false promises, I believe, of last year’s ECB QE introduction. The sentiment index had jumped positive though frustratingly in the same way it had falsely or prematurely done so in the past. |
Germany ZEW Financial Market Survey, 2006-2020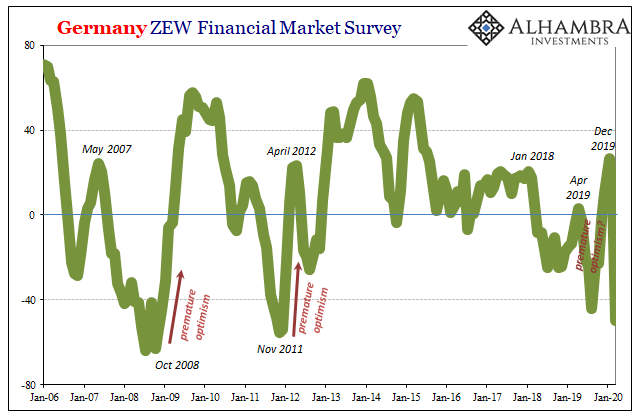 - Click to enlarge |
| Survey respondents seem to love their “stimulus” even after watching it fail to stimulate anything twice before.
The ZEW sentiment index was already on its way back down by the time the pandemic broke out of China. Last month, the number was just +8.6. The latest estimate is -49.5, the lowest since Europe’s 2011-12 recession. |
Germany ZEW Financial Market Survey, 2007-2020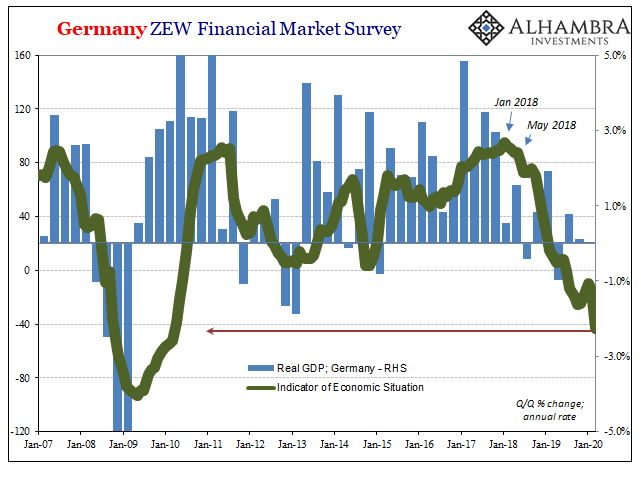 - Click to enlarge |
| The ZEW situation index fared basically the same, except it didn’t have nearly as far to drop. The German economy, apparently, didn’t actually pick up like it was talked about (but we knew that) and it’s closes comparison is the bottom of 2009.
Those are actually the better set of numbers. Germany’s IFO, well, the chart speaks for itself; both sentiment and the current situation. China’s dramatic decline is one thing, the German situation quite another. This isn’t Italy, either, a country that isn’t reeling already in the grips of an overwhelming emergency. |
Germany IFO Business Climate Index, 2005-2020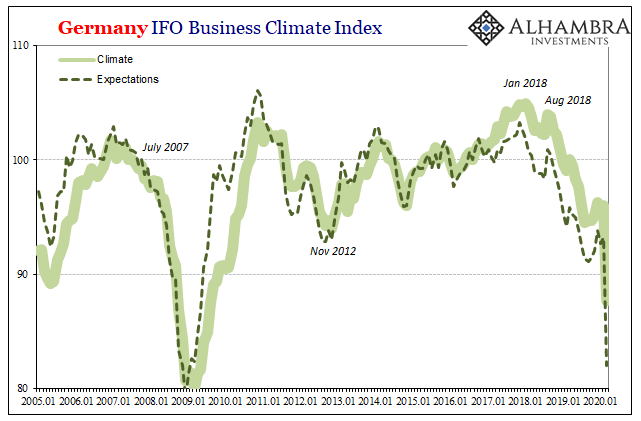 - Click to enlarge |
| It’s going to be ugly from here, there’s just no getting around it. We’ve got two crises being pulled together as one: the global COVID-19 outbreak which was the catalyst for the unfolding GFC2. Germany’s economy, like the rest of the world, was already into a downturn before it came to this.
But in a lot of ways that’s old news. Markets are getting used to the notion that what’s upon us now is about as bad for the whole global system as we’ve seen, likely comparable if not worse than 2009. And while that will be an important measuring stick, what’s really concerning is what could come after. The other side of this looming global contraction, what does it look like? The recovery in this situation is probably more important than the downside. For that, we’ve got very little to go on. We can make comparisons to 2008-09 as well as put together ad hoc, pro formas. You might have seen JP Morgan’s first attempt at guessing making the rounds yesterday, and those are as good as any as a place to start this exercise. |
Real GDP What If, 2014-2021 - Click to enlarge |
| For those who didn’t, the bank’s econometric models suggest US GDP growth beginning in Q1 2020 will be: -4% (Q/Q annual rate); -14.5%; then +8% followed by +4% and finally +3% in Q1 2021. This is what JP Morgan’s figures look like:
We have no way of knowing how close these are, so take anything that follows with a huge grain of salt. My point is not exactness but to get a vague handle on the possible scale to the challenge before us, and therefore, hopefully, get a sense of what is and more importantly will be moving markets (in either direction). Using this as a starting point, +8% in Q3 sounds terrific as do the two quarters following. It’s actually not, though, as you can see when you plot the pro forma quarterly changes as quarterly real GDP levels. |
Real GDP What If, 2014-2022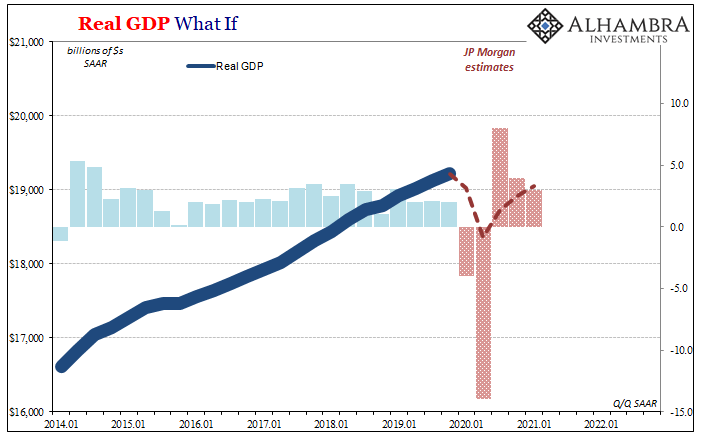 - Click to enlarge |
| According to these estimates, this kind of big recession even though it is short-lived would leave US output by Q1 2021 significantly below what it had been in Q4 2019.
And that’s only where the possible problems start. If we further assume (overlaying my own calculations on top of JP Morgan’s estimates) that the US economy would have grown at its current lackluster rate of around 2%, that would put baseline GDP at around $20.4 trillion in Q4 2022 – three full years from Q4 2019. |
Real GDP What If, 2014-2022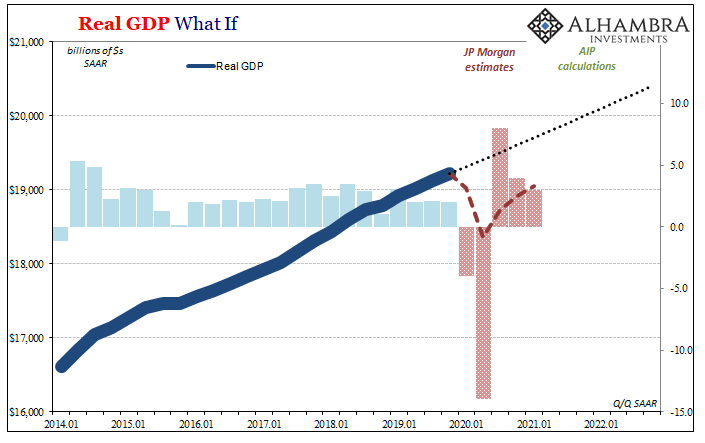 - Click to enlarge |
| In order for the economy to catch back up to that relatively low bar, this would require about 4% growth in each of those seven additional quarters beyond JPM’s rough estimates. Yes, more growth than we’ve seen in years and for it to be sustained at or near that pace level for almost two years straight.
That’s just to get us back even. It gives a very rough sense of the scale to what we are facing, not just in our immediate future but more so that crucial next step after these hurricane-force headwinds finally do blow over. |
Real GDP What If, 2014-2022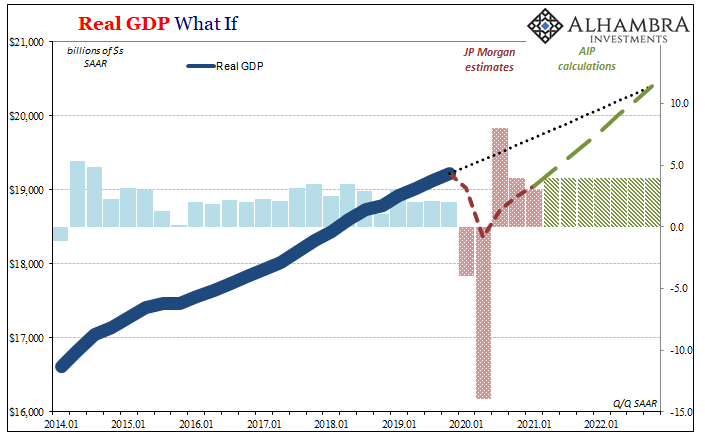 - Click to enlarge |
| The worst quarter during the Great “Recession” was -8.75% in Q4 2008. Q1 2009 is estimated to have shrunk at a -4.5% rate. What really mattered, though, was the “new normal” which showed up in 2010 even after such a massive decline; GDP averaged just +3.13% up to QE2 in Q3 2010.
And then it only got worse from there. These were the drag effects of a decayed monetary and financial system, unresponsive to any “stimulus” efforts the recovery wasn’t really a recovery at all. The damage had been done and it was permanent. I can already hear FRBNY President John Williams lowering his 2020 R* calculation. Maybe Q1 and Q2 don’t end up being nearly as bad; minus 14, after all, is pretty extreme. Perhaps Q3 is much better, pent up demand from Americans stuck in their homes for weeks maybe months. Let loose again, maybe they really let loose spending and get GDP into the double digits on the plus side, closing the gap more and faster. Then again, unemployment and business cutbacks are coming. First the supply shock of the pandemic-based shutdown, and then the aftermath of GFC2 and the potential for, in economic terms, an even bleaker recovery. Like GFC1, even more long run monetary and financial damage for these central banks not being up to their jobs. That’s ultimately the point. We’re not going for accuracy here, just trying to gauge how reasonable it might be that the US and global economy falls even farther behind than it already was a decade out from GFC1. These kinds of numbers suggest it’s not unreasonable to start game planning that way. |
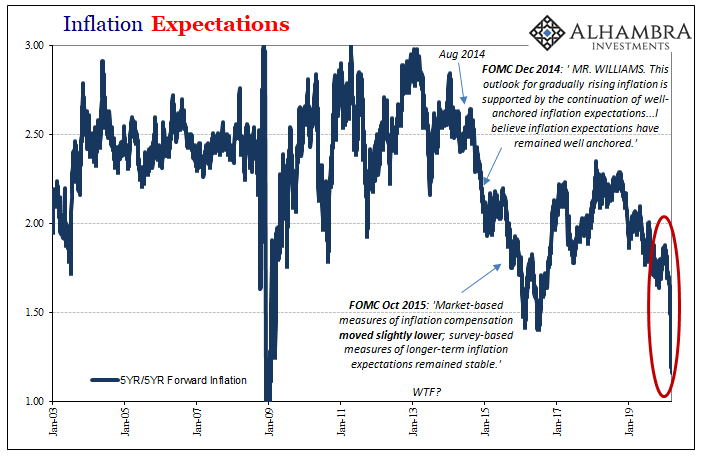 . |
I have to think that’s why the bond market and especially longer run indications (like inflation expectations) within it are being traded the way they are, Japanification-style. Those are not about the coronavirus nor the contraction due to the pandemic, rather they are about the recovery, or lack thereof, from it as well as possible even likely lingering harm caused by GFC2.
There’s a long road ahead and everything would have to go perfectly – just to get us back to the lackluster state we just left. Stagnation never looked so good.
Full story here Are you the author?
Tags: Bonds,COVID-19,currencies,economy,Euro$ #4,Federal Reserve/Monetary Policy,GDP,Germany,GFC1,GFC2,IFO,Markets,newsletter,real GDP,recession,recovery,sentiment,ZEW


