Joseph Y. Calhoun
My articles My siteAbout meMy videosMy books
Follow on:LinkedINTwitterSeeking AlphaAmazon
The Q2 GDP report (+4.1% from the previous quarter, annualized) was heralded by the administration as a great achievement and certainly putting a 4 handle on quarter to quarter growth has been rare this cycle, if not unheard of (Q4 ’09, Q4 ’11, Q2 & Q3 ’14). But looking at the GDP change year over year shows a little different picture (2.8%).
The US economy is definitely accelerating out of the 2016 slowdown. The growth rate has risen in a near straight line from 1.3% in Q2 2016 to 2.8% in the most recent quarter. But the rate of ascent so far leaves a lot to be desired. This business cycle – like all the others – has seen multiple slowdowns and accelerations (4 up-cycles and 3 down-cycles since 2009). The last up-cycle, starting in mid-2013, went from a 1.3% to a 3.8% growth rate in 7 quarters. This up-cycle is already 9 quarters long and the growth rate is still a full percent below the previous peak.
| What I see is an economy that hasn’t changed all that much from recent years. Economic growth in this cycle has been slower than previous ones anyway and current growth is only slightly above average for the cycle. And I don’t see anything in the data or markets right now pointing to a big improvement right around the corner either but then my crystal ball has been cracked for some time. One thing I feel comfortable predicting though is that nice, steady, straight-line change in the rate of growth will not persist. Which raises a question. How does such a volatile administration produce a growth rate that has almost none? I’m not suggesting anything nefarious but you don’t usually see straight lines in nature or economics. At least not for long. |
US Real GDP, Q1 2013 - Q1 2018(see more posts on U.S. Gross Domestic Product, ) - Click to enlarge |
| This most recent GDP report also included major revisions to past data. The savings rate which we thought was dragging along at around 3% was actually closer to 7%. And that revision was caused by upward revisions to income in every year since 2012. And if you wonder where that extra income came from, look no further than corporate profits which were revised lower for every year back to 2012. And which, by the way, despite all the hoopla about S&P 500 earnings, are still less than the peak in Q3 2014 (although we haven’t seen Q2 figures yet).
The lesson here though is much simpler. Don’t spend a lot of time trying to parse small changes in the month to month economic data. It is an impossible task made literally so by the quality of the data received in real time. It is all going to be revised at some point in the future anyway and at times those revisions will completely change your perception of the economy – but only in retrospect. There are no do overs in economics. You need some perspective to really see what is going on with the economy. A month of reports as we have below gives you a mere snapshot, a coarse view of the current economy. 4.1% growth sounds great but it is only quarter to quarter and really doesn’t tell you all that much. You have to put it in context. And the context is that today’s economy isn’t that different than it was in, say, 2014, another year when the dollar rose – and oil crashed from $107 in June to $47 by the new year. And oh by the way started the growth slowdown that ended right after the election. If the dollar keeps rising is that what we should expect? Hard to say but I doubt many of the shale companies make money at prices under $50. How reliant have we become on oil extraction as a source of economic growth? I don’t think it is quite as much as it was a few years ago but it is still a big part of recent growth. Take a look at the Dallas Fed Survey some time if you have doubts. Which puts President Trump’s team in a quandary. Tariffs and the threat of them tend to drive the dollar higher. The higher dollar means cheaper oil which is negative for US growth. Every uptick in the dollar adds a little more urgency to the trade negotiations. |
US Profits after Tax, 1950 - 2018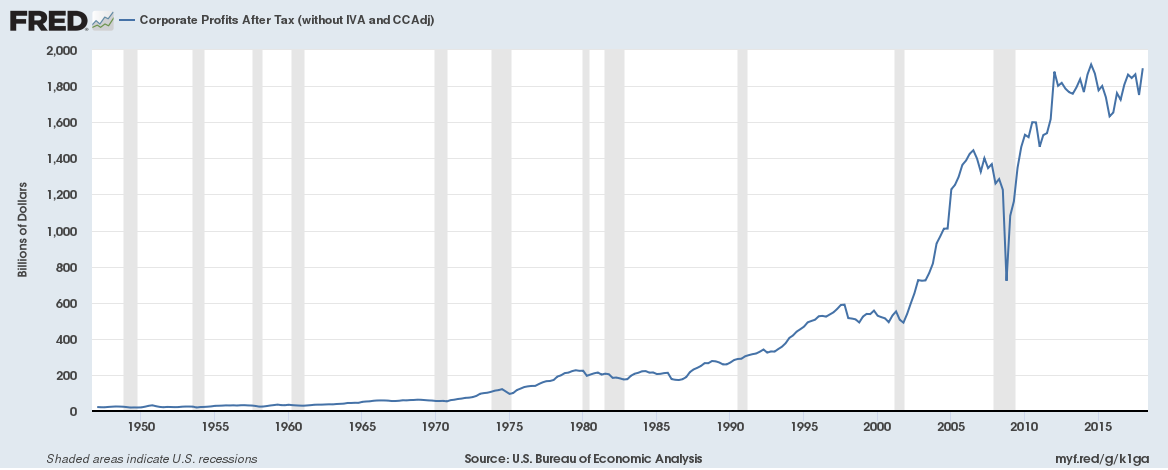 - Click to enlarge |
Economic ReportsEconomic Growth & InvestmentThe Chicago Fed National Activity Index captures most of what I talked about above. The most recent reading came in at a healthy 0.43, indicating growth above trend. But a large part of the gain over the last month is due to a rebound in auto production which had been suppressed due to a fire at a large parts manufacturer. The 3 month average of the CFNAI is 0.16 which is still above trend but just slightly (a 0 reading would be at trend). As I said, context is required. We see a similar effect in the industrial production report which rebounded but only to offset the drop from last month. The other reports in this section confirm the trend. |
Economic Growth & Investment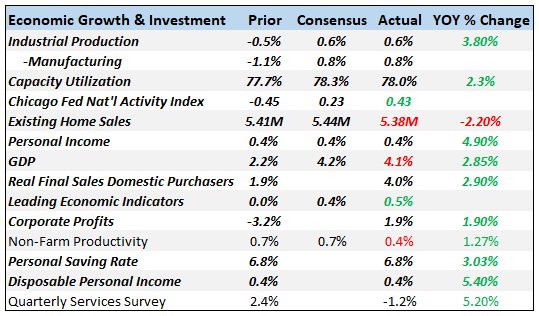 - Click to enlarge |
| The upward revision to incomes still leaves personal income growing at a rate that would have been fairly disappointing in past cycles. Still, it is on an upswing so let’s not get too picky. |
US Personal Income, 1982 - 2018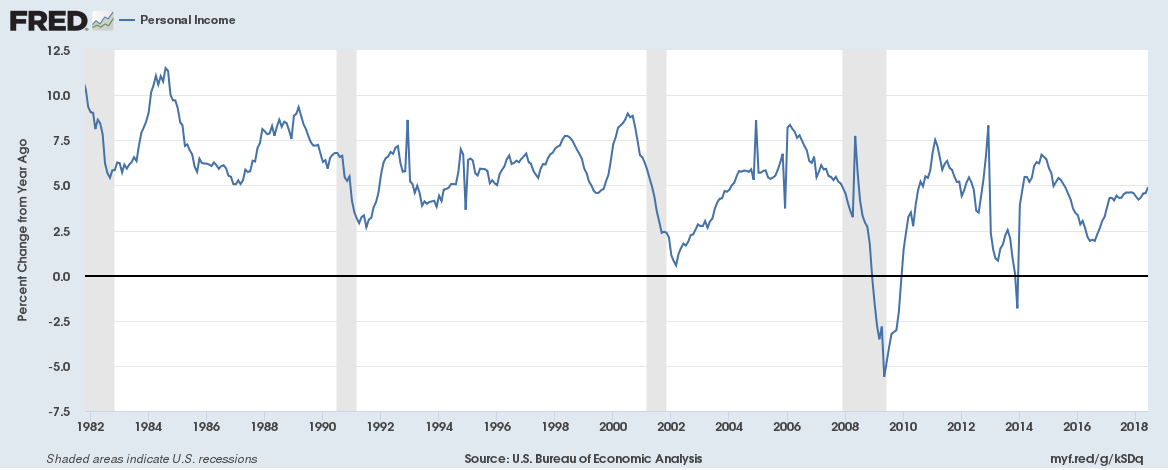 - Click to enlarge |
ProductionThese sentiment type surveys were all fairly positive but the two ISM reports were less than expected. As I’ve said many times though, these reports are, at best, coincident with economic growth and provide little insight to the future. |
Production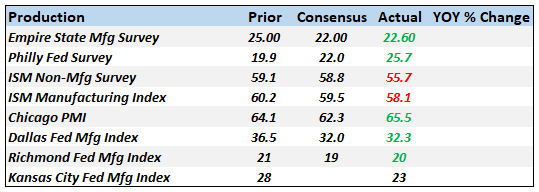 - Click to enlarge |
Consumption & DistributionRetail sales have been on an upswing since the last election but the rate of growth in this cycle has disappointed. The most recent wholesale sales were also a disappointment as it appears there was a tariff effect last month when we saw a big increase. Still, 10% + growth year over year is pretty good. |
Consumption & Distribution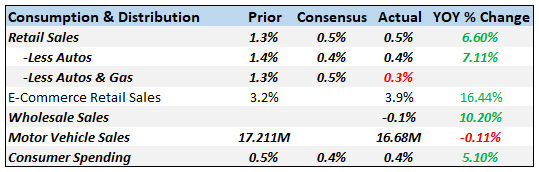 - Click to enlarge |
InventoriesInventories continue to build but, with the monthly exception at the wholesale level, at a slower pace than sales. As a result, inventory to sales ratios continue to improve. Of course, that could be taken two ways. One is that sales have been so good that the economy is having trouble keeping up with demand. The other is that companies don’t have the confidence – maybe because of the multiplying trade spats – to increase inventory levels. Which is it? I don’t know but the bond market isn’t buying the first explanation. |
Inventories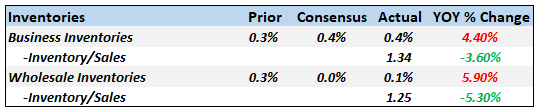 - Click to enlarge |
OrdersAgain, we see the impact of the rebound from the auto slowdown last month. Factory orders and durable goods orders were improved from last month, but both were less than expected. On the investment side, core capital goods orders continue to rise (although the 0.6% rebound noted here was revised in the Factory order report to just 0.2%). But again, let’s get a little perspective. The biggest problem our economy has faced for some time now is the lack of productivity growth which is tied pretty directly to capital goods orders. If we don’t invest we can’t get more productive. And while this series has improved recently it is just 4% higher today than it was in 2000. As a percentage of GDP, core capital goods orders have been trending lower since 1996. |
Orders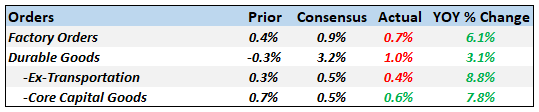 - Click to enlarge |
Manufacturers New Orders, 1994 - 2018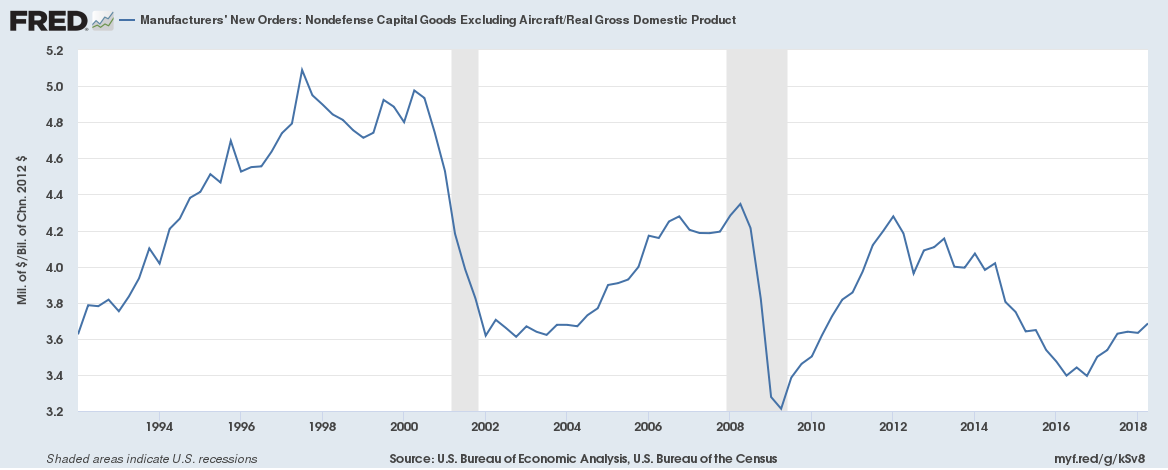 - Click to enlarge |
|
TradeThe trade picture is still distorted by the trade war but the pull forward effect appears to be fading. The trade deficit widened in June which will be negative for Q2 GDP revisions. |
Trade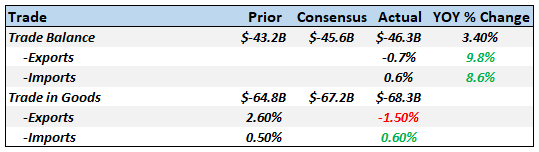 - Click to enlarge |
InflationIt is hard to look at that chart and not get the idea that inflation is becoming a problem. But really it isn’t, at least not yet. The year over year numbers are a little hot but that is mostly an oil effect that, as noted above, should fade as the dollar rallies. If we had these numbers and the dollar was still falling I would be concerned. |
Inflation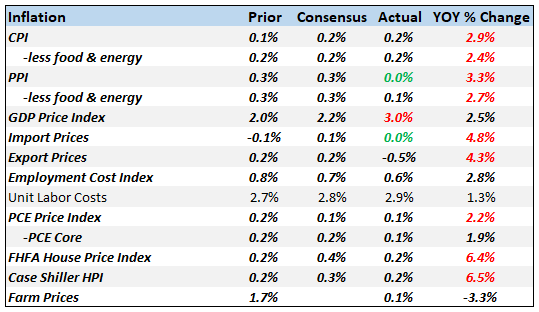 - Click to enlarge |
EmploymentThe latest employment report was a bit less than expected but overall hiring is still decent. No, it isn’t booming and yes those job openings numbers may be (probably are) inflated by double (and maybe triple) counting. But the quit rate is probably real and shows confidence. The unemployment rate is low by historical standards but then so is the participation rate which has stopped falling but hasn’t really improved. Is the lower participation rate a bad thing? A good thing? From a growth standpoint the answer is, I guess, obvious. More people working means more growth. But from a societal standpoint? What is the optimal rate? I have no idea…. |
Employment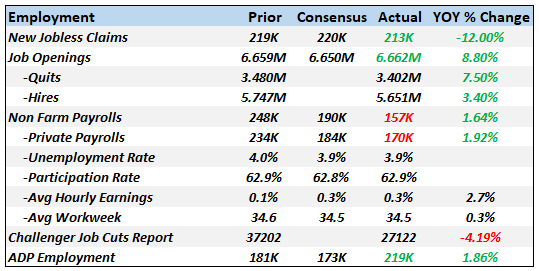 - Click to enlarge |
| And wages? Well, 2.7% growth year over year works out to a negative if adjusted for CPI inflation. I don’t see how we could have a worker shortage when that is the case but that’s been the narrative for a couple of years now. Sorry, but it just ain’t so. And remember our theme this report is context so that Challenger Job Cut drop looks good but it is only one month. Layoffs YTD are actually up 7%. |
Civilian Labor Force Participation Rate, 1950 - 2018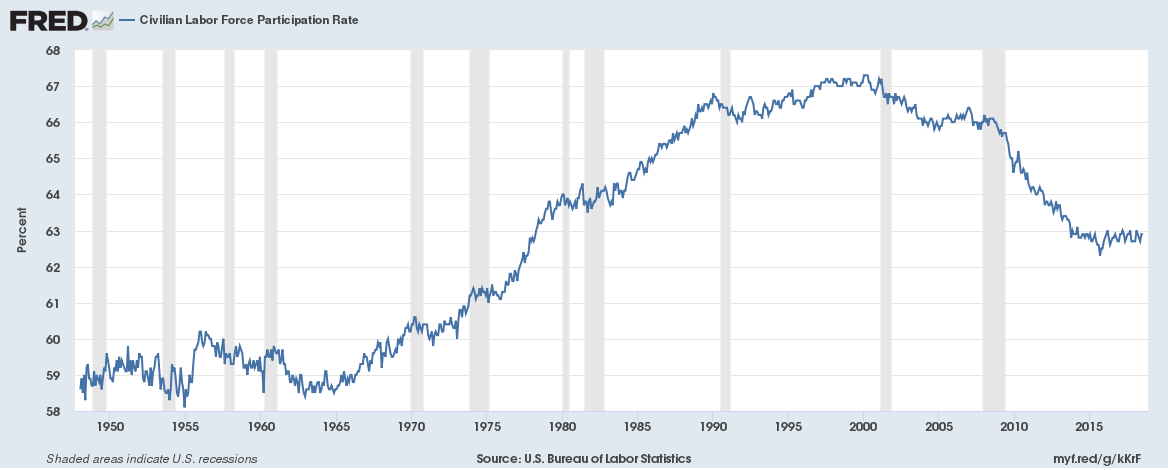 - Click to enlarge |
ConstructionConstruction activity is most definitely slowing now. The year over year growth rate for overall construction spending is still positive but on a downward slope. The housing market is looking decidedly toppy. |
Construction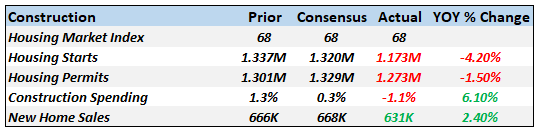 - Click to enlarge |
SentimentSentiment remains near the highs of the cycle but these, like the manufacturing surveys, are coincident at best. |
Sentiment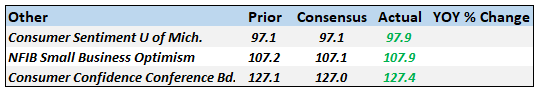 - Click to enlarge |
Market Indicators10-Year Treasury Note YieldThe 10 year Treasury yield is still firmly in the range it has established since the early year ramp higher. The top of the range is around 3%, the bottom around 2.75%. Q2 GDP growth was good but the bond market isn’t buying that it is the start of a trend. At least not yet. |
US 10-Year Treasury Note Yield, Jan 2018 - Aug 2018(see more posts on U.S. Treasuries, )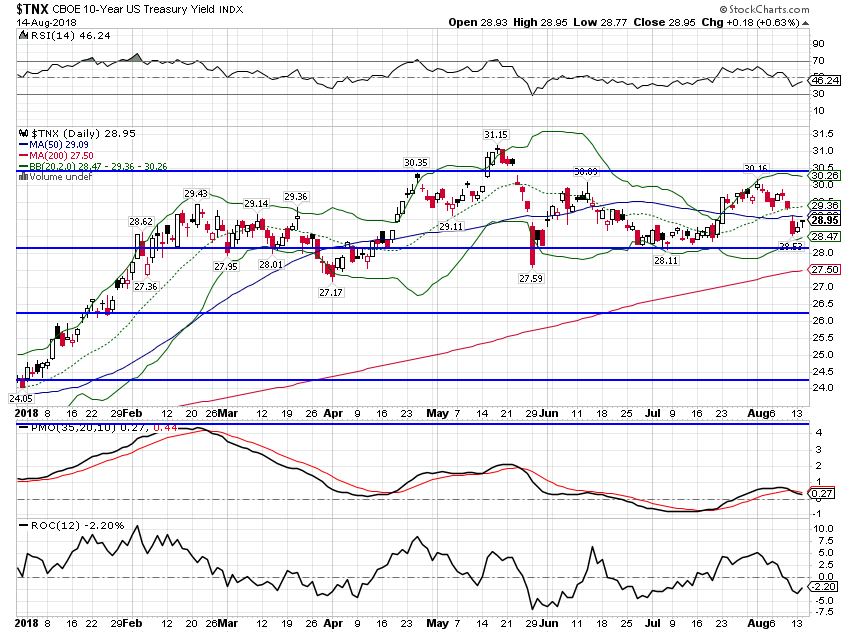 - Click to enlarge |
10-Year TIPS YieldTIPS yields are also trading in a range after rising early in the year. Even at the high end of this range TIPS are predicting pretty anemic growth going forward. Real interest rates are the intersection of capital and investing and if we get a sustained rise in investment it will show up here in the form of higher real rates. So far, not so much. |
US 10-Year TIPS Yield, Jan 2014 - Jul 2018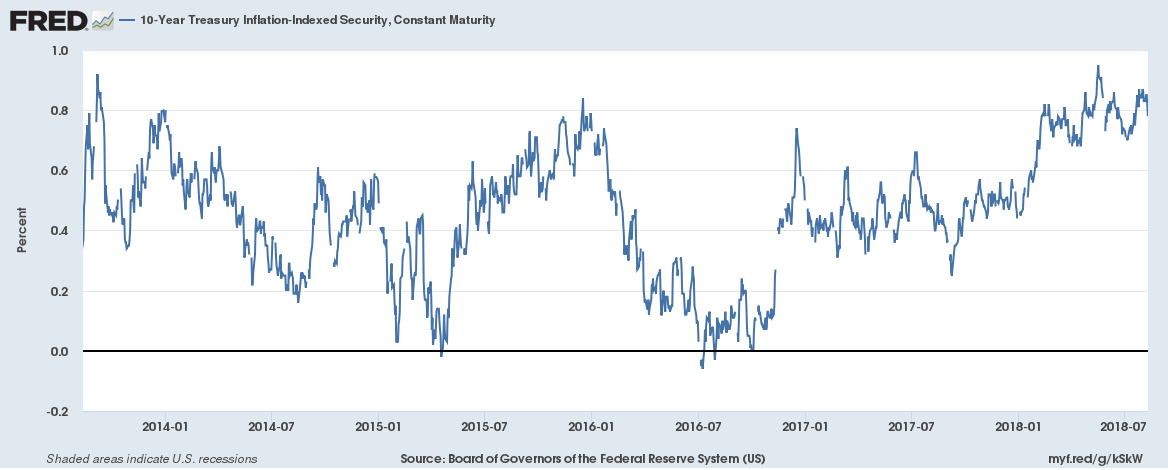 - Click to enlarge |
2-Year Treasury YieldThe 2 year yield’s trajectory has cooled over the last two months. The market is not convinced the Fed will be hiking twice more this year no matter what Jay Powell says. |
US 2-Year Treasury Yield, Jan 2018 - Aug 2018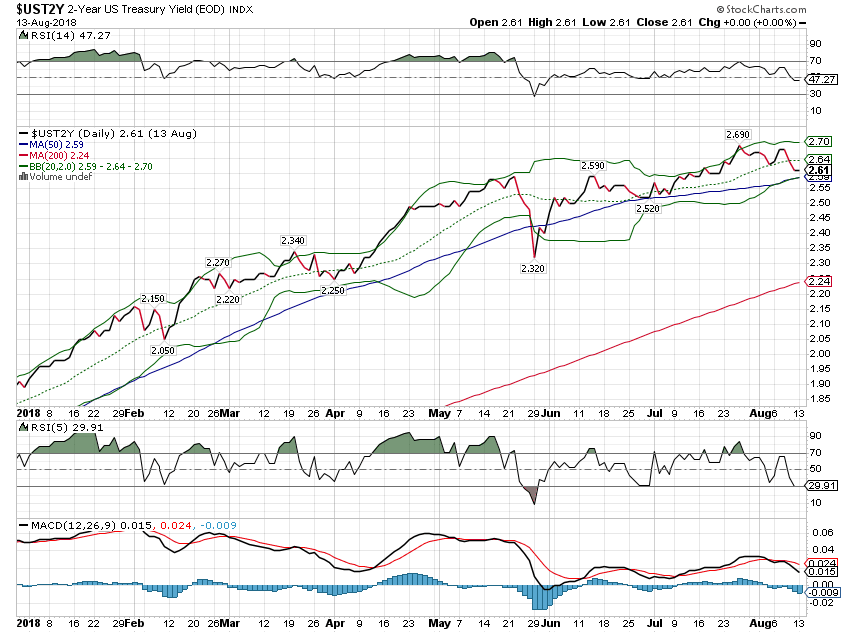 - Click to enlarge |
10/2 Yield CurveThe yield curve steepened briefly but then resumed its flattening trend. The curve is not, at present anyway, acting in any way that is of immediate concern. The normal course of events would be for the curve to flatten, invert and then steepen rapidly right before recession as short term rates fall more rapidly than long term rates. Will that happen this time? I think you have to assume it will but keep an open mind. Everyone is focused on a potential inversion so it may not unfold that way. If short term rates and long term rates both fall at the same rate, the curve wouldn’t invert but that would still not be a good sign about future growth. Don’t just look at the curve in the simplistic terms everyone else does. |
US 10/2 Yield Curve, Jan 2018 - Aug 2018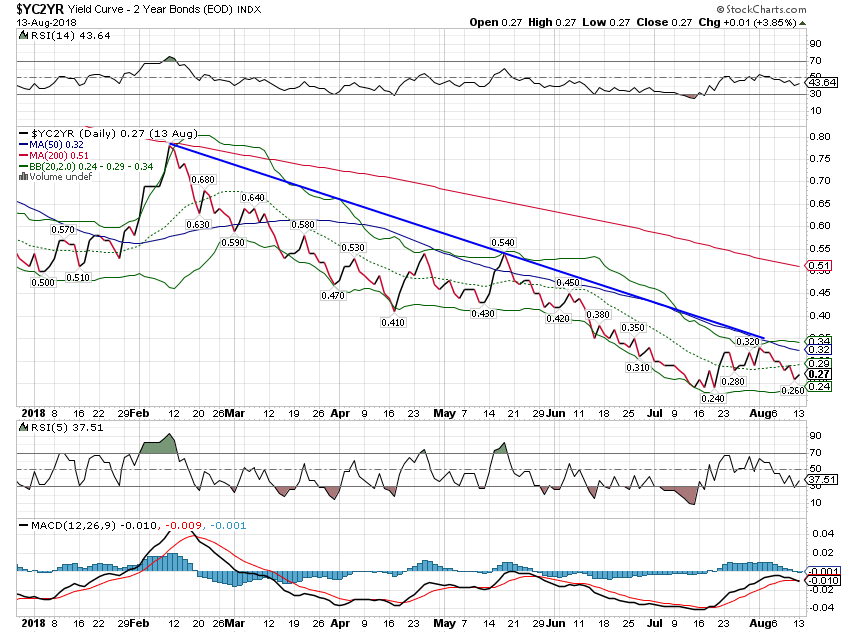 - Click to enlarge |
Credit SpreadsCredit spreads remain very well behaved. Risk appetite is still healthy. While it looks like this measure is bottoming I would just remind everyone that we had lower levels in both of the last two cycles so that isn’t out of the question. Could a resolution of some of our trade spats – which I expect before the mid-terms – stoke another round of risk taking and push spreads even narrower? |
US Credit Spreads, Jan 2014 - Jul 2018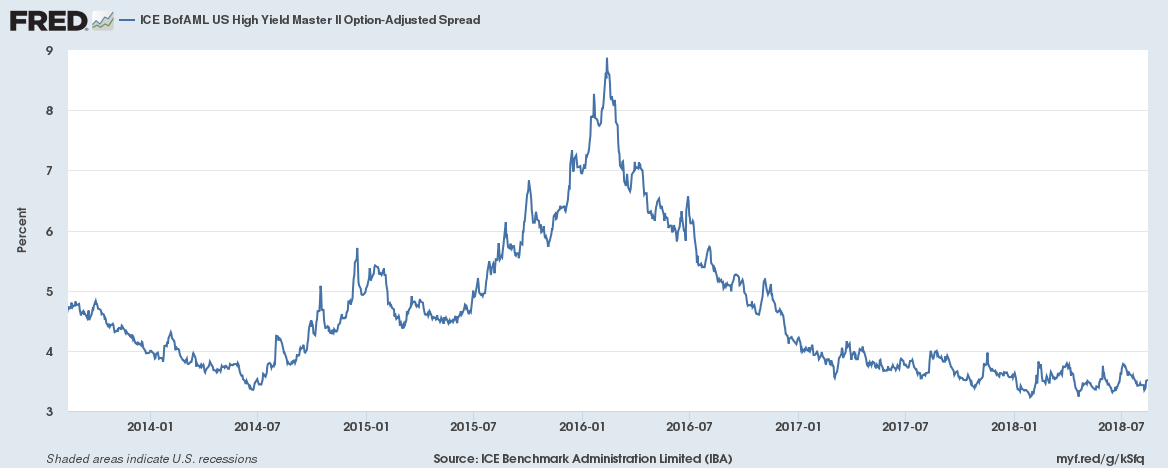 - Click to enlarge |
US DollarWell the dollar finally did it. The index has spent the last two months bumping up against resistance around 95 but the recent clash with Turkey moved it decisively higher. How much higher could it go? There’s essentially no resistance between here and 100 so that is definitely in the mix. But any positive movement on the trade front should move the dollar back down. And the President and Treasury Secretary can be expected to complain about the stronger dollar any minute now. The dollar is probably the most important variable for investors right now. The move higher in this case can be taken as a change in relative growth expectations. US expectations are steady but expectations outside the US are falling. |
US Dollar Index, Nov 2017 - Aug 2018(see more posts on U.S. Dollar Index, )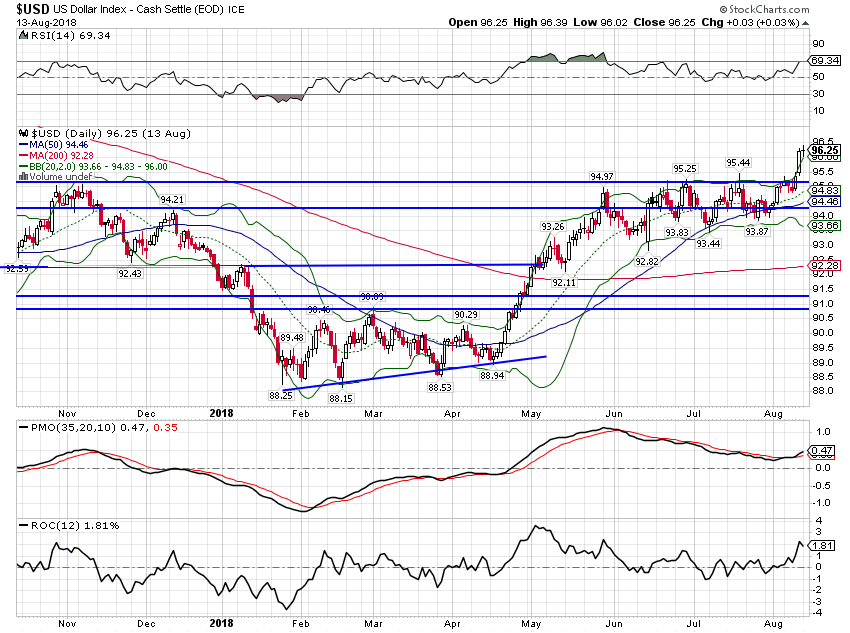 - Click to enlarge |
CommoditiesThe break out in the dollar means a break down in Gold and other commodities. This is usually a pretty positive sign for growth. |
Gold - Continuous Contract, Jan 2018 - Aug 2018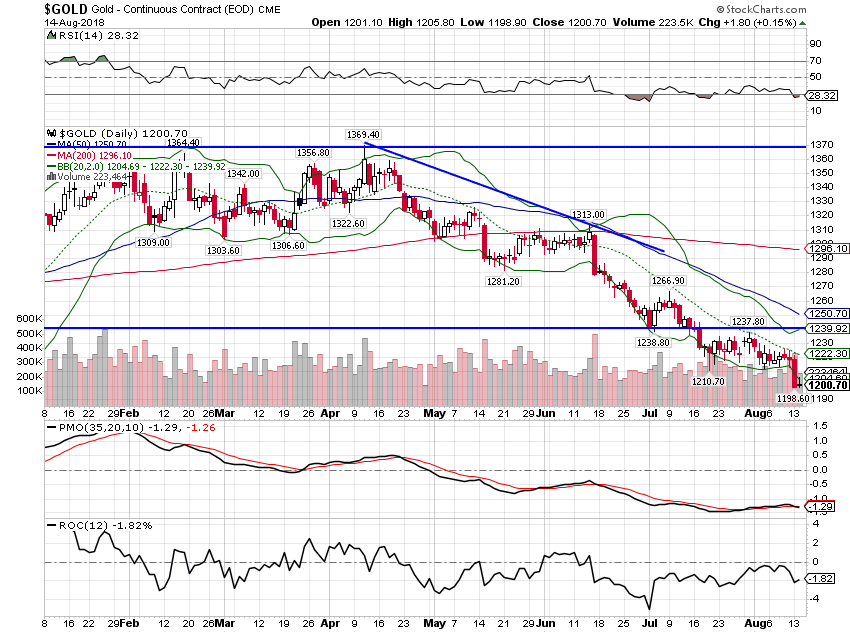 - Click to enlarge |
| The GSCI has held up better than gold or the other commodity indexes because of its higher exposure to energy. While oil has been hit lately – and if the dollar keeps rising that will probably continue – natural gas has turned higher for a variety of reasons. That has kept the index somewhat firmer than the Bloomberg index but not much. |
S&P Index, Jan 2018 - Aug 2018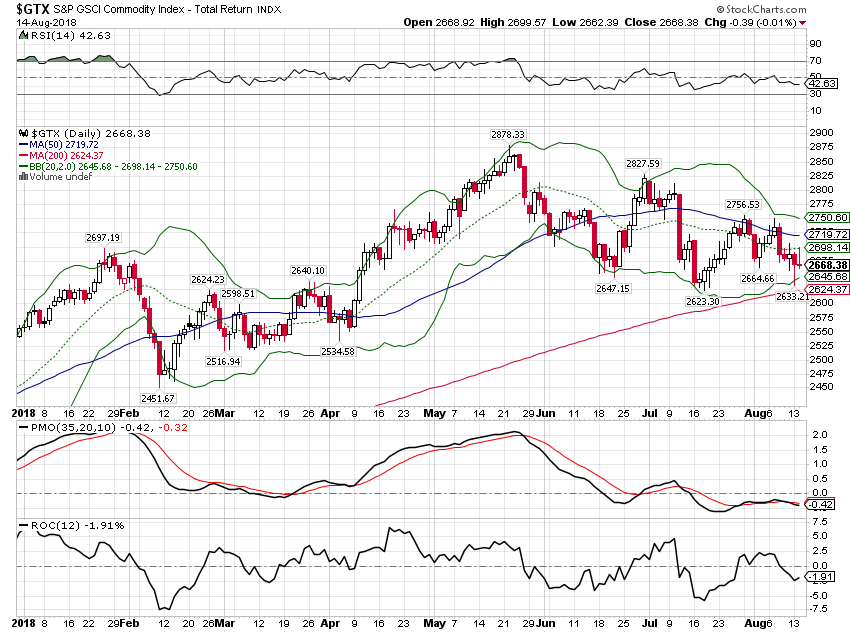 - Click to enlarge |
| The Bloomberg index is barely hanging on to an uptrend but that won’t last if the dollar keeps rising. |
Bloomberg Commodity Index, Aug 2016 - Aug 2018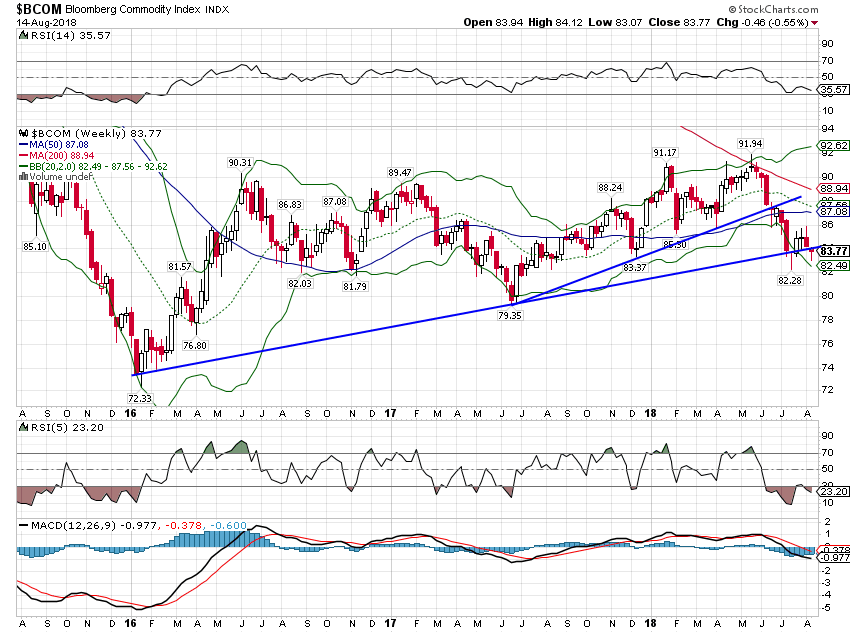 - Click to enlarge |
| Gold has been weak but copper has been weaker. I wouldn’t worry too much about higher interest rates until this starts to turn around. |
Gold:Copper, Jan 2018 - Aug 2018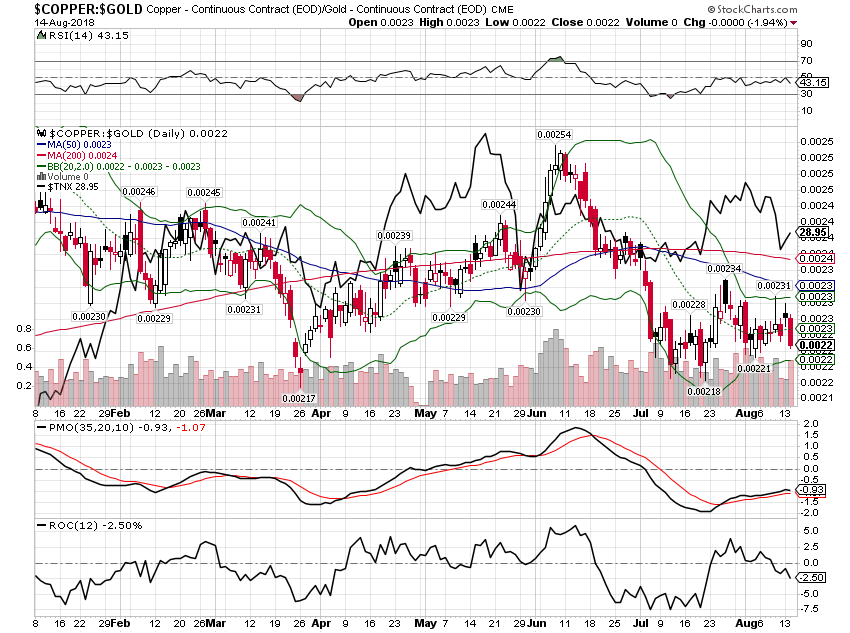 - Click to enlarge |
As I said last month, I don’t think the growth or inflation outlook has changed all that much. Bond yields are pointing to subdued growth and a stronger dollar should bring down stated inflation. Long term inflation expectations have been steady through this whole episode of rising CPI. The Fed and other economists may be worried about inflation but the market certainly is not. I’d take the under on inflation and bet against the economists.
The bigger concern for investors is the damage being done overseas by the rising dollar. The dollar’s rise is being driven by the administration’s trade policies so any positive movement on trade could spark a rapid reversal. Speculators have started to build long positions in the dollar index but it isn’t anywhere near an extreme yet. And with specs also long a lot of crude oil, I think the positioning argues for a higher dollar for now. Specs are also sitting on a record short position in bonds so I would not be surprised to see the 10 year yield fall out of the bottom of its recent range. The tariffs imposed by the administration and the retaliatory ones imposed by the rest of the world are negative for global growth and that includes the US.
But let’s not get ahead of ourselves here. Right now, US growth expectations haven’t change materially. Nominal and real interest rates are higher today than at the beginning of the year and inflation expectations are contained. We are growing a little above trend but this is no boom. Call it secular stagnation – which is what that chart of core capital goods above argues for – or call it the New Normal but it is still with us.
Tags: 10 year treasury yield,Alhambra Research,Bonds,cfnai,commodities,Construction Spending,copper to gold ratio,corporate profits,credit spreads,currencies,economic growth,economy,employment,GDP,Gold,income,inflation,Inventories,Markets,Monthly Macro Monitor,newsletter,OIL,stocks,TIPS,Trade,U.S. Dollar Index,U.S. Gross Domestic Product,U.S. Treasuries,US dollar,Yield Curve