Keith Weiner
My articles My offerMy siteAbout meMy videosMy books
Follow on:LinkedINTwitterSeeking AlphaFacebookAmazonGoogle +
See the introduction and the video for the terms gold basis, co-basis, backwardation and contango.
Regulated to DeathThe price of gold fell $13, and that of silver $0.23. Perspective: if you’re waiting for the right moment to buy, the market now offers you a better than it did last week. If you wanted to sell, this wasn’t a good week to wait. Which is your intention, and why? Obviously, last week the sellers were more aggressive, and the buyers more leisurely. Even the so-called digital gold, bitcoin, fell about 6% last week. It seems those struggling debtors are not only selling the wheat and burgers they produce. They are selling financial assets they hold. Soybeans dropped 20% in June and the first half of July. Wheat fell only 8% since late May, but has been in an epic falling trend since 2012, having lost 45%. And that wheat price in 2012 was about a third down from the peak of 2008. Soybeans by the way are down over 50% from their peak in 2012. Oil, as much as it has come up in the last two years, is still down 34% from its 2014 peak. |
Gold-HUI, HUI-Gold ratio - Click to enlarge We are rather late posting Keith’s supply & demand update this week, so we felt we might as well add an updated chart of the divergences we recently discussed. This week gold has dropped quite a bit further, but the bullish divergences between gold and gold equities have stubbornly persisted. Such market behavior is virtually always meaningful (at least we cannot remember the last time when it hasn’t been). [PT] |
| We have to bite our tongues every time someone says “inflation”, with or without breathlessness. Wheat is down from $13 a bushel to under $5 since 2008 (with rising money supply). People insist with respect to inflation that “the government is lying to us about the consumer price index.” We don’t know that CPI is a lie, but we do know that the price of wheat is real.
As a weekly continuation chart of wheat futures reveals, wheat has indeed seen far better times – at the height of the commodities craze that flamed out in 2007-2008 it briefly surged to previously unheard of levels near $13.50 per bushel. However, it has also seen worse times in the more distant past. Nearly all commodity prices are in fact trading far above their nominal lows of the 1990s. The CRB Index is misleading, as it reflects the roll-over effect. While the CRB index does reflect how much money one would actually have made or lost by continually rolling over commodity futures – i.e., it shows the absolute return of a nonsensical “buy and hold” strategy – (when futures are trading in contango, losses soon begin to pile up), it also creates the false impression that nominal commodity prices have generally fallen to new multi-decade lows, which is simply not the case. [PT] If the spread between retail bread and the commodity wheat has widened, blame taxes and regulations. The effects of monetary policy will be seen most clearly in commodity markets. And least clearly seen where the impact of government is greater. State, county, and city governments all get their pound of flesh. They have permitting, licensing, zoning, labor law, restricted loading hours (with mandatory time and a half). |
Wheat weekly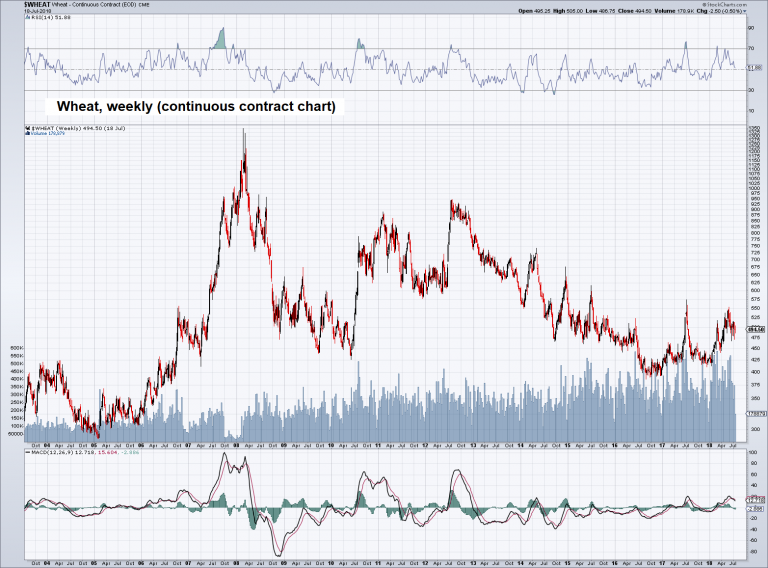 - Click to enlarge |
| Retail stores lose more and more productive floor space due to regulations like the Americans with Disabilities Act. Lawsuits drive up insurance costs. And rising “user fees” charged by desperate municipalities, for permission to be in business. California makes gasoline more expensive by mandating changes to the blend. And now, tariffs will spike some prices. The price of soybeans has dropped due to tariffs.
Contra Milton Friedman, who said “inflation is everywhere and always a monetary phenomenon”, prices often rise due to non-monetary factors. Of course, if the price of a double latte doubles due to a double dose of regulation and taxation, that is not a driver for the price of gold to go up. The price of gold does not track this kind of inflation. Milton Friedman wags his inflation warning finger. The purchasing power of money is driven by four forces: the supply of and demand for money; and the supply of and demand for goods and services money can buy. Moreover, due to the heterogeneous nature of the latter, goods and service-specific price trends often buck general trends related to money supply and demand. However, this does not mean that one can just dismiss growth in the money supply as unimportant. First of all, if it grows, prices for everything will be higher than they would have been if it had remained stable. Second, it is through manipulation of the money supply that monetary authorities manipulate administered interest rates, thereby sending falsified signals to the marketplace about the state of the economy’s pool of real savings. This creates the boom-bust cycle by promoting distortions in relative prices in the economy, which invariably invites capital malinvestment and capital consumption. Friedman’s highly aggregated monetarist view does of course not take any of these factors into account – it is an analysis that must perforce remain very superficial. As it happens, a good rule of thumb in economics is “superficial is almost always wrong”. [PT] |
 Milton Friedman |
Fundamental DevelopmentsWhither the price of gold next? We will provide a picture of the changing gold and silver fundamentals. But first, here is the chart of the prices of gold and silver. |
Gold and Silver Prices(see more posts on gold price, silver price, )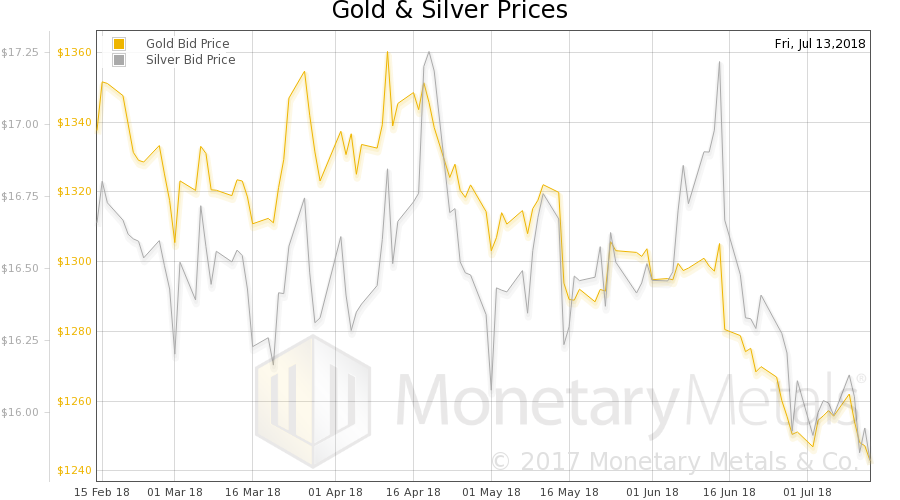 - Click to enlarge |
Gold: Silver RatioNext, this is a graph of the gold price measured in silver, otherwise known as the gold to silver ratio (see here for an explanation of bid and offer prices for the ratio). It went up this week. Gold-silver ratio: when it rises it often indicates declining economic confidence, similar to rising credit spreads. This is due to the large industrial demand component in silver. [PT] |
Gold: Silver Ratio(see more posts on gold silver ratio, )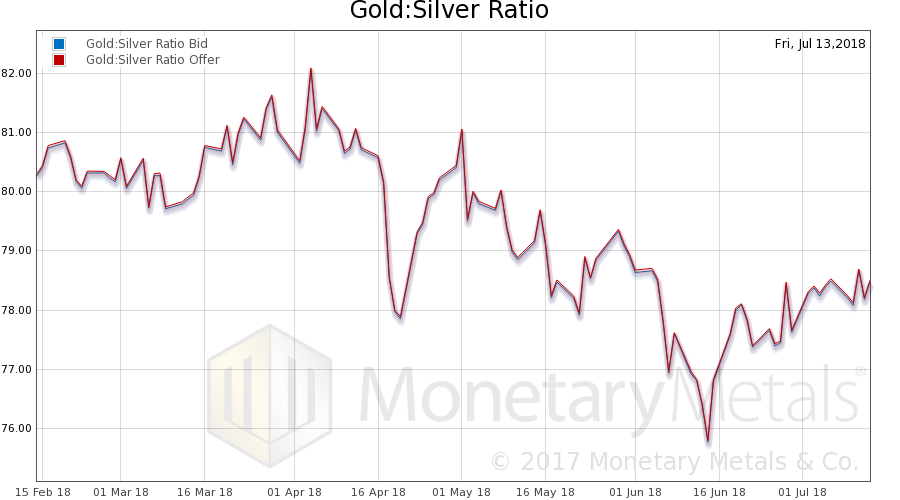 - Click to enlarge |
Gold Basis and Co-basis and the Dollar priceHere is the gold graph showing gold basis, co-basis and the price of the dollar in terms of gold price. Once again scarcity (i.e., the co-basis) was rising along with price of the dollar (the inverse of the price of gold, measured in dollars). It is times like this when you want a picture of the fundamentals. It is easy to think that demand for gold is going down. But is it? Not last week. The Monetary Metals Gold Fundamental Price remained at $1,300 (well, $1299 to be precise). |
Gold Basis and Co-basis and the Dollar price(see more posts on dollar price, gold basis, Gold co-basis, )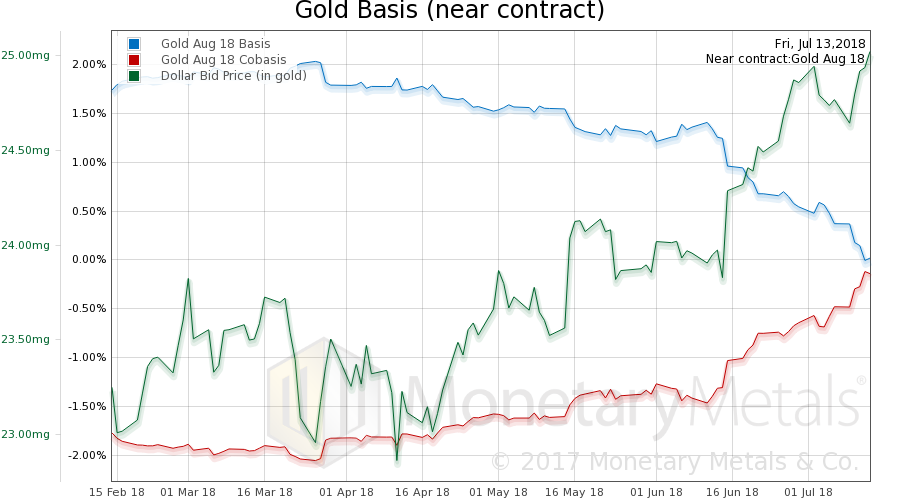 - Click to enlarge |
Silver Basis and Co-basis and the Dollar PriceNow let’s look at silver. The same thing happened in silver, a rising co-basis, with a drop in price. The Monetary Metals Silver Fundamental Price rose 4 cents, to $17.48. So in both metals, most people would say that we had a bad week. However, a look at the fundamentals shows it wasn’t as bad as the people with only price charts think. © 2018 Monetary Metals Charts by: StockCharts, Monetary Metals Chart and image captions by PT |
Silver Basis and Co-basis and the Dollar Price(see more posts on dollar price, silver basis, Silver co-basis, ) - Click to enlarge |
Full story here Are you the author?
Tags: Basic Reports,capital destruction,Chart Update,commodities,dollar price,Gold,gold basis,gold bond,Gold co-basis,gold price,gold silver ratio,newslettersent,On Economy,Precious Metals,silver,silver basis,Silver co-basis,silver price,yield