Pater Tenebrarum
My articles My siteAbout meMy videosMy books
Follow on:TwitterSeeking AlphaFacebook
A Spike in Bank Lending to Corporations – Sign of a Dying Boom?As we have mentioned on several occasions in these pages, when a boom nears its end, one often sees a sudden scramble for capital. This happens when investors and companies that have invested in large-scale long-term projects in the higher stages of the production structure suddenly realize that capital may not be as plentiful as they have previously assumed. The wake-up call usually involves a surge in market interest rates and subtle shifts in relative prices in the economy (consider for instance the recent decline in new home prices amid declining sales). Interest rates have certainly provided a signal lately. We last mentioned this phenomenon in a money supply update in May in connection with the then nascent rebound in commercial and industrial lending, which has accelerated a bit further in the meantime. Superficially this rebound cannot be differentiated from other surges in credit demand, but there are many strong hints supporting the idea that it is indeed the typical late stage boom phenomenon. Apart from rising short term rates these inter alia include a rapidly flattening yield curve, rising price inflation and very low initial unemployment claims. Historically this scramble for credit in the late stages of a boom could be observed on numerous occasions. It was particularly pronounced in 2007-2008, when in addition to recognizing the intensifying scarcity of capital, companies began to fear that banks might decide to cut their unused credit lines just as other avenues of obtaining external financing were closing down. They proceeded to draw down such credit lines as quickly as possible. Looking solely at the jump in commercial & industrial loans (C&I loans) at the time, one would probably not have guessed that a major bust had just begun. |
Short term USD interest rates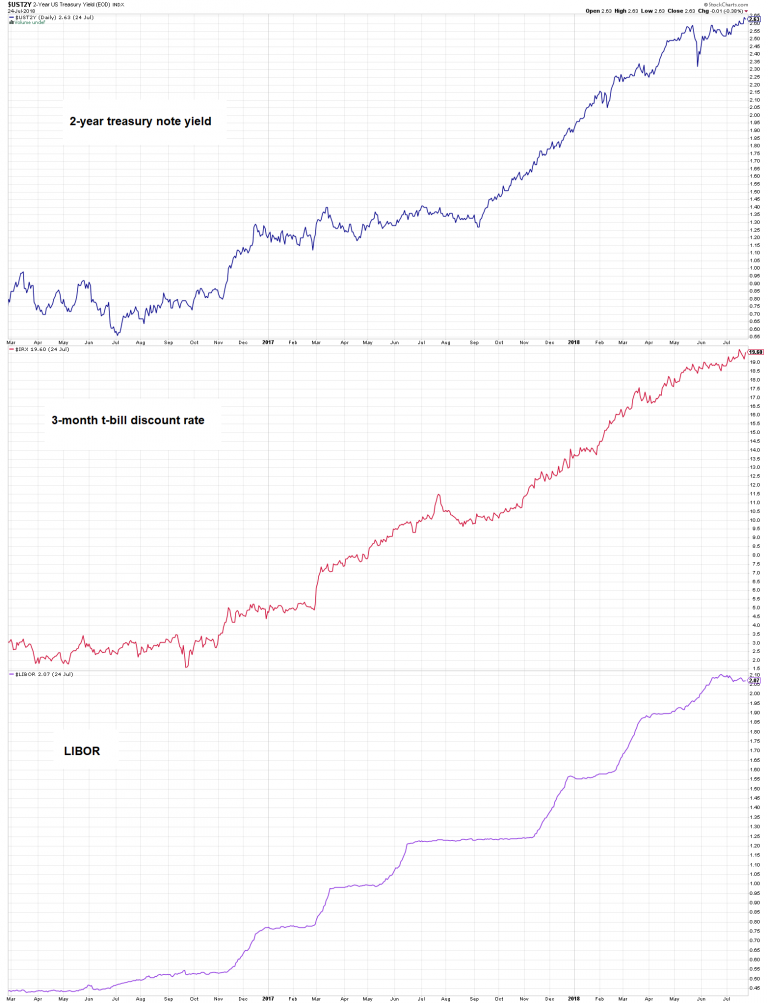 - Click to enlarge Short term USD interest rates: 2-year treasury note yield, 3-month t-bill discount rate and LIBOR (USD interbank lending rate in London, used as a benchmark for rate adjustments of countless bonds, loans, swaps, derivatives, etc.). |
| Our friend Michael Pollaro, whose update on the tipping point in outstanding Fed credit we recently discussed, decided to take a closer look at this signal. What he has found is quite interesting and fits well with the idea. Namely, a sudden surge in C&I lending can be identified as a warning signal when it happens at the tail end of a noteworthy decline in the growth rate of the broad true US money supply (TMS-2). Here is a chart that illustrates the situation: |
TMS-2 vs. C&I loans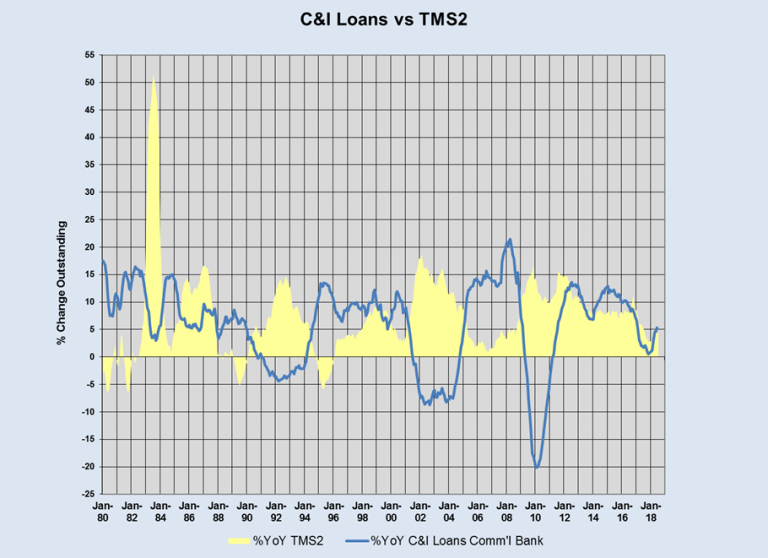 - Click to enlarge Year-on-year percentage growth in TMS-2 (yellow area) vs. y/y percentage growth in C&I loans (blue line). |
| Admittedly the signal is hardly the most perfect timing device, but an overlay chart with the S&P 500 Index suggests it has some use from a medium to longer-term perspective. There were two clearly discernible C&I lending spikes close to both the year 2000 and 2007 peaks. Both started before the peak, but the one in 2007 continued for a while longer. Not surprisingly, these spikes were then followed by sharp reversals in loan growth amid noticeable market declines and worsening recessionary conditions.
The most recent spike in C&I loans has begun from a much lower level than its immediate predecessors, but we don’t believe this makes it any less valid as a signal. Rather, we think it is an indication that corporate bond markets have become tighter. Evidence from surveys suggests that credit investors are becoming more selective lately, insisting on stricter covenants, higher yields and shorter terms to maturity. As we have pointed out previously, QE by central banks in combination with stricter capital requirements for banks (Basel III and the swarm of new regulatory acronyms it has given birth to) have led to a shift in corporate borrowing, with bonds, promissory notes and leveraged loans bought by investors partly replacing traditional bank loans. |
S&P Index vs C&I Loans 1994-2018(see more posts on S&P 500 Index, )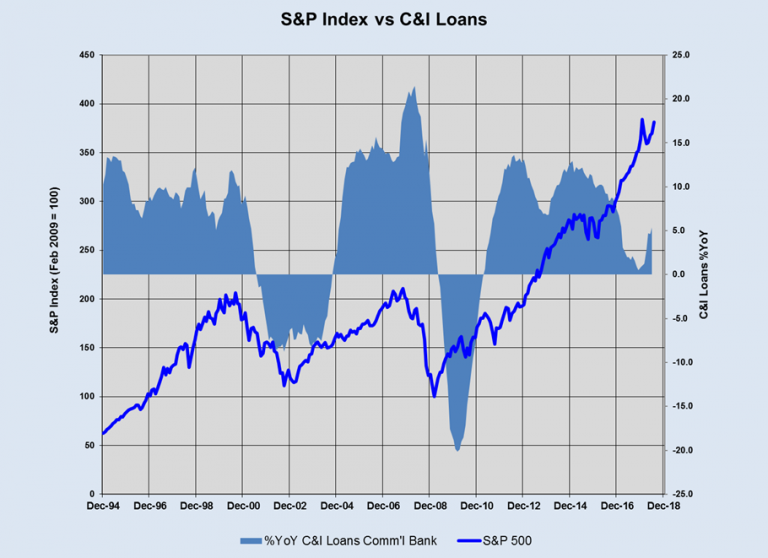 - Click to enlarge Year-on-year percentage growth in C&I loans (light blue area) vs. the SPX (dark blue line). |
Still a Distorted Production StructureIt should be noted that there is currently a to-and-fro between the major contingent circumstances surrounding the tightening monetary backdrop. On the positive side, we have the US president making good on his promises with respect to tax cuts and cutting back regulations – which incidentally puts pressure on other countries to follow suit, so it does not only help US citizens, but indirectly may have positive effects elsewhere as well. On the negative side, we have the US president making good on his promises with respect to trade restrictions, while increasing the federal deficit by leaps and bounds. Both are a burden on the economy, but there is still some hope that his ultimate goal is to use tariffs only temporarily in a kind of stick and carrot approach designed to get other countries to agree to rescind their trade barriers, with the US ostensibly prepared to reciprocate. Nevertheless, the vast expansion in the money supply over the past decade, the enormous debt accumulation it has triggered and the associated capital malinvestment cannot be wished away. Trends in sentiment based on contingent events may influence the timing of the necessary adjustment, but they cannot prevent it. Below is an updated chart of the ratio of capital to consumer goods production: |
US - ratio of capital to consumer goods production 1990-2018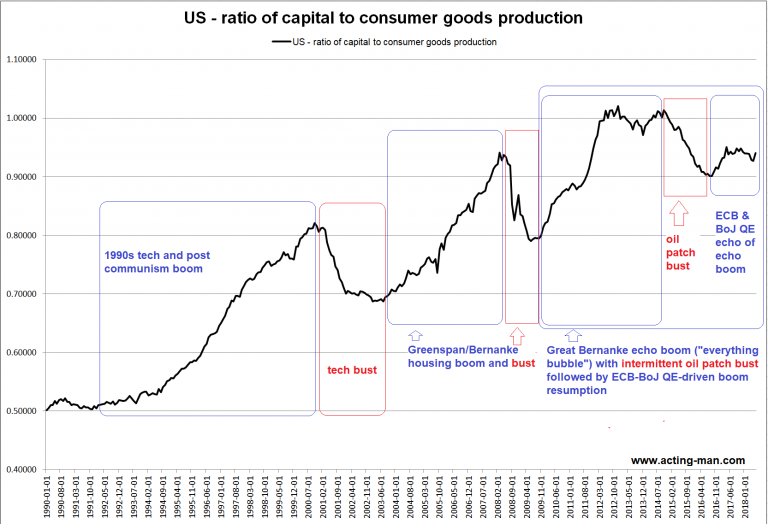 - Click to enlarge The ratio of capital to consumer goods production shows that during credit expansions, more and more investment is drawn toward the higher stages of the production structure (capital goods, long-term investments) relative to the lower stages (goods and services close to consumption). There is nothing wrong with this when it happens on account of rising savings, but when it happens due to money printing and interest rate manipulation, it is a safe bet that a lot of capital is malinvested and ultimately consumed. When interest rates return to levels more in tune with actual time preferences, they signal that there is far less capital available than previously thought. A bust happens when the capital structure is perforce rearranged to reflect a more sustainable production/consumption ratio. This is why declines in the above ratio are aligned with recessions. Sometimes busts remain confined to a few sectors and don’t push the entire economy into a technical recession – the oil patch bust of late 2014-early 2016 is an example. These mini busts will still be visible in the ratio, and the economy at large will exhibit very weak and uneven growth. |
| Obviously, the ratio remains quite elevated – it is still near the level at which it peaked in 2007. The interventions of major central banks in recent years have created a unique situation, which makes it even more difficult to forecast the timing of an eventual bust than it normally is. What is clear though is that we continue to get subtle early warning signs.
We suspect many creditors will come to rue their boom time generosity.
Charts by: StockCharts, Michael Pollaro, acting-man.com, Bloomberg |
Easy credit 2005-2017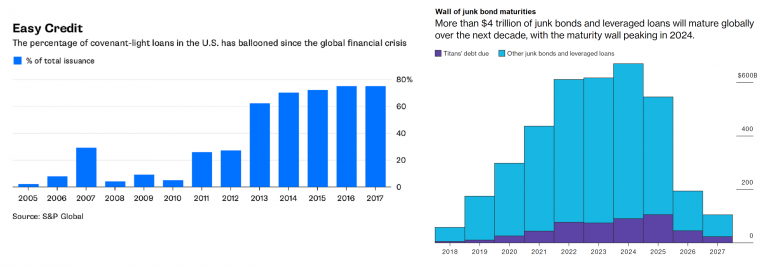 - Click to enlarge Easy credit galore – and much of it will have to be refinanced quite soon. |
Full story here Are you the author?
Tags: central-banks,Chart Update,newslettersent,On Economy,S&P 500 Index