Jeffrey P. Snider
My articles My offerMy siteAbout meMy videosMy books
Follow on:LinkedINTwitterSeeking Alpha
| Chinese exports rose 12.9% year-over-year in April 2018. |
China Exports, Jan 2008 - Apr 2018(see more posts on China Exports, )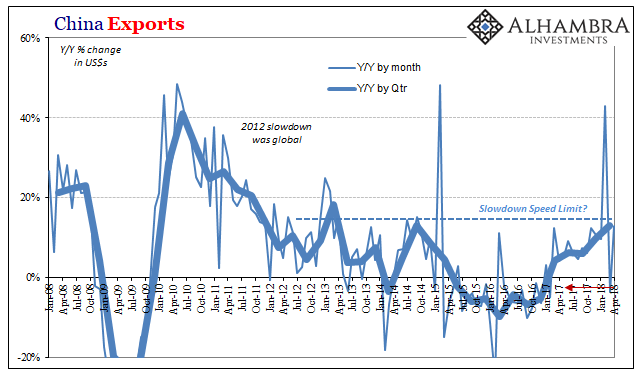 - Click to enlarge |
| Imports were up 20.9%. As always, both numbers sound impressive but they are far short of rates consistent with a growing global economy. China’s participation in global growth, synchronized or not, is a must.
The lack of acceleration on the export side tells us a lot about what to expect on the import side. The one piece situated between Ex and Im is government interference, often in the form of “stimulus.” If exports are weak but officials make a concerted effort to offset that weakness, imports can perform marginally better. That can be good news for the rest of the global economy further down the supply chain (resources). |
China Imports, Jan 2008 - Apr 2018(see more posts on China Imports, )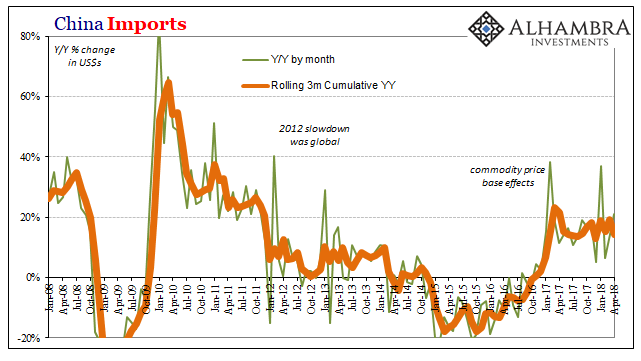 - Click to enlarge |
| It can also be bad news for the Chinese. If global growth never does pick up in meaningful fashion, they are left on the hook (debt) for what was done anticipating it. We’ve all heard the narrative of rebalancing, that though the export sector may never fully come back (which would still be news to the Western world) China’s growing middle class and its consumption will spell the difference.
That is happening, of course, but more so by accident or default; Chinese consumption is decelerating like everything else, just not as quickly as heavy industry and manufacturing. It’s rebalancing but at a much lower level. We cannot ignore that key factor. This kind of situation would propose a far more uncertain trajectory than the one where globally synchronized growth means something substantial, or at least where rebalancing toward consumerism wasn’t a mere remainder. Again, China’s trade statistics are consistent with the uncertainty, not the growth. The lack of acceleration in and out of China’s economy actually explains quite a lot about not just the global economy but also markets (including for “dollars”). As the world’s largest consumer of resources, at the margins it’s not even close, how much that country demands of the rest of the world determines the direction and the intensity. |
China Imports, Jan 2000 - 2018(see more posts on China Imports, )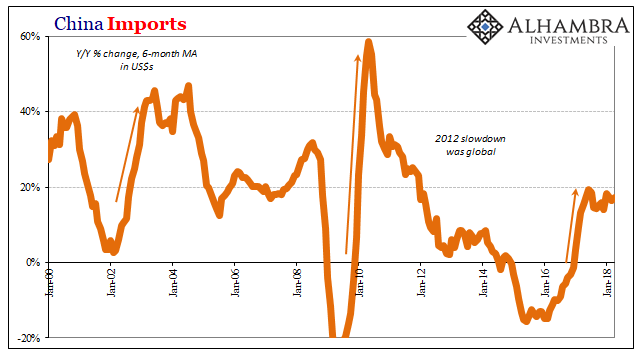 - Click to enlarge |
| What you see on the chart above is instructive; slowing and then contracting Chinese imports were the mechanism for delivering into the real economy the negative influences of the eurodollar in reverse. |
China Imports, Jan 2008 - Apr 2018(see more posts on China Imports, )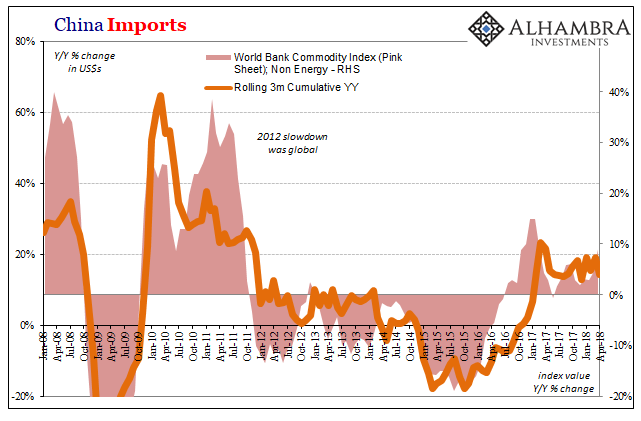 - Click to enlarge |
| That was the deflation. Its reverse in early and mid-2016 pushed prices positive, but it’s not inflation. It’s still deflation, only on a different time scale. |
China Imports, Jan 2008 - Apr 2018(see more posts on China Imports, )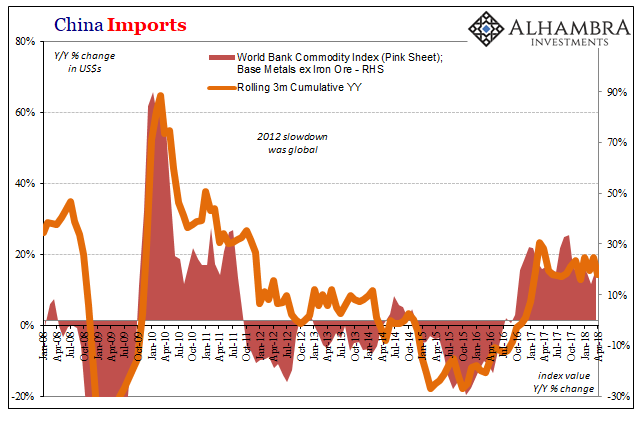 - Click to enlarge |
| When comparing data on an annual basis, as is standard practice, commodity prices as China’s imports are positive again, at times significantly so. Positive numbers by themselves are insignificant. Gradation matters, as does a wider context for comparison.
Comparing Chinese import growth with commodity price changes (World Bank Commodity Indices, Pink Sheet) demonstrates pretty well this relationship. Commodity prices like China’s imports are up and in some segments like base metals it’s a lot for an annual number. In April, that particular index was 20% higher than it was in April 2017. For its ultimate low in January 2016, the overall non-energy index is up an impressive (sounding) 21.7%. That 9% compound annual rate is a bit better than China’s PPI and again seems to suggest inflation. But the index is also still 10% below its relative peak in May 2014, and nearly 30% less than early 2011. Those work out to compound annual rates of -2.8% and -4.8%, respectively. Is that inflation? Is it even reflation? If this rebound was only six or nine months along, then patience could be called for. But that’s 27 months and counting. |
World Bank Pink Sheet Commodity Indices, Jan 1995 - Apr 2018 - Click to enlarge |
| There are very real consequences for a prolonged period of stunted growth, an overall deflationary environment that only appears to have been broken in 2016 or 2017. The global economy may have returned to positive numbers, but the languishing continues. It increases the costs of past malfunction which is then passed forward into a lot of parallel factors that matter a great deal – starting with risk perceptions. |
World Bank Pink Sheet Commodity Indices, Jan 2001 - 2018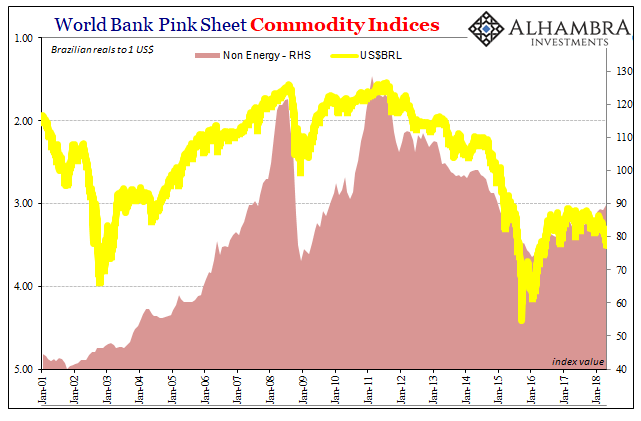 - Click to enlarge |
| The forward global economy (end demand) is growing, but not close to enough. The Chinese economy is growing nowhere near enough. The rest of world’s economy cannot recover, which over time sets it all back into the downward cycle again. Reflation sentiment disappears, and tremendously disappointing reality once more sets back in.
|
Brazil Real GDP, Jan 1997 - Apr 2018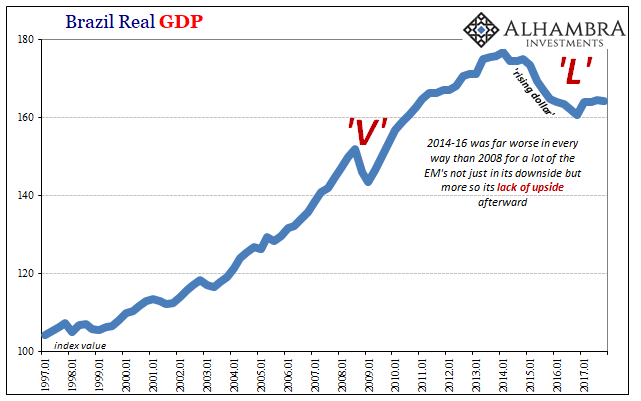 - Click to enlarge |
| Positive numbers, the ghost-like outline of an inflationary breakout that always remains just out of reach, these are little more than the righthand side of the letter “L.” |
Russian Federation Real GDP, Jan 2003 - Apr 2018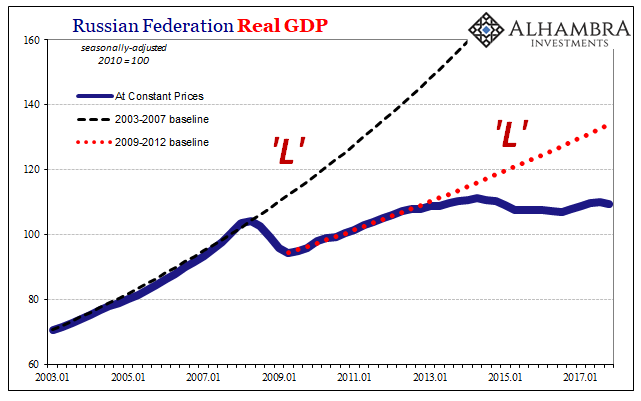 - Click to enlarge |
Tags: Brazil,China,China Exports,China Imports,commodities,commodity prices,currencies,Deflation,dollar,economy,EuroDollar,exports,Federal Reserve/Monetary Policy,global trade,globally synchronized growth,imports,inflation,Markets,newslettersent,Reflation,Russia