Marc Chandler
My articles My offerMy siteAbout meMy videosMy books
Follow on:LinkedINTwitterSeeking AlphaAmazon
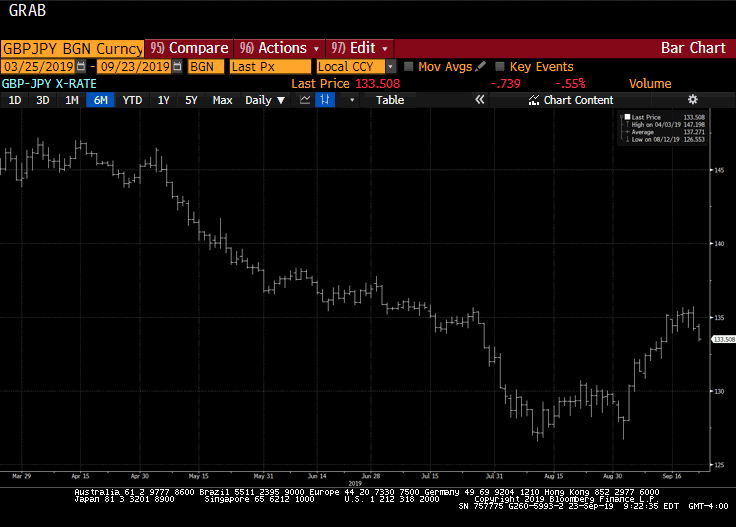
| It is not that the Australian dollar is the weakest currency this month. Its 0.4% decline puts it among the better performers against the US dollar. However, it has fallen to a new low for the year today. The losses have carried to a trendline drawn off of the early 2016 low near $0.6800.
The trendline has been drawn on this Great Graphic composed on Bloomberg. It is found today near $0.7625 and rises by about seven ticks (100ths of a penny) a week. The Australian dollar has been firming this month until the second half of last week. On April 19, it briefly traded above $0.7800 to reach its best level in a month. However, it reversed lower then and closed at a 1 1/2 week low, recording what technicians refer to as a key reversal. The follow-through selling pressure stalled ahead of the weekend pushed it to the shelf carved out in late March and early April. The modest selling pressure pushed below the shelf today and down to $0.7635. The driving consideration seems to be interest rates rather than commodities. Over the last four sessions, as the Aussie has been sold, iron ore prices have risen, and copper prices have risen for the past four weeks. Australia, which traditionally pays a premium to the US now is at a discount. The discount is more than 30 bp for two-year sovereign borrowing and offers 10 bp less than the US on 10-year obligations. Australia’s cash rate is set at 1.50% and is unlikely to change this year. The Fed funds target range is 1.50%-1.75% and is likely to rise another 50 or 75 bp this year. |
AUD/BGN Currency, 2014 - 2018 - Click to enlarge |
Speculators in the futures market have become more bearish in recent weeks. They have been mostly net long Aussie futures since early January. The speculators shifted to a net short position at the start of April, and net short position of 10.2k contracts as of April 17 was the largest since the very first week of the year.
The pressure, though, is coming from long liquidation more than the establishment of a larger gross short position. The bulls have cut their long holdings for the past four weeks. They are fallen from 53.8k contracts on March 20 to 29.8k as of April 17. The gross short position has fallen for the past two weeks by a combined 5.2k contracts. The 40k gross short position is about 3k smaller than the end of March. This suggests that what can fuel the next leg down is the bears participating, not just after the withdrawal of the bulls.
The economic data are unlikely to change the macro views this week. First thing tomorrow, Australia reports Q1 CPI. We would assess the risk on the downside of the 0.5% median forecast. More constructive may be the terms of trade due in the middle of the week. Export prices may have accelerated 4% vs. 2.8% in Q4 17) while import price increases likely slowed (1.2% vs. 2.0%). The intraday technical readings are stretched, and the $0.7600 area is likely to hold on the initial probe. The lower Bollinger Band is found near $0.7620 today. Initial resistance is seen in the $0.7660-$0.7680 area.
Full story here Are you the author?Tags: $AUD,Great Graphic,newslettersent