Joseph Y. Calhoun
My articles My siteAbout meMy videosMy books
Follow on:LinkedINTwitterSeeking AlphaAmazon
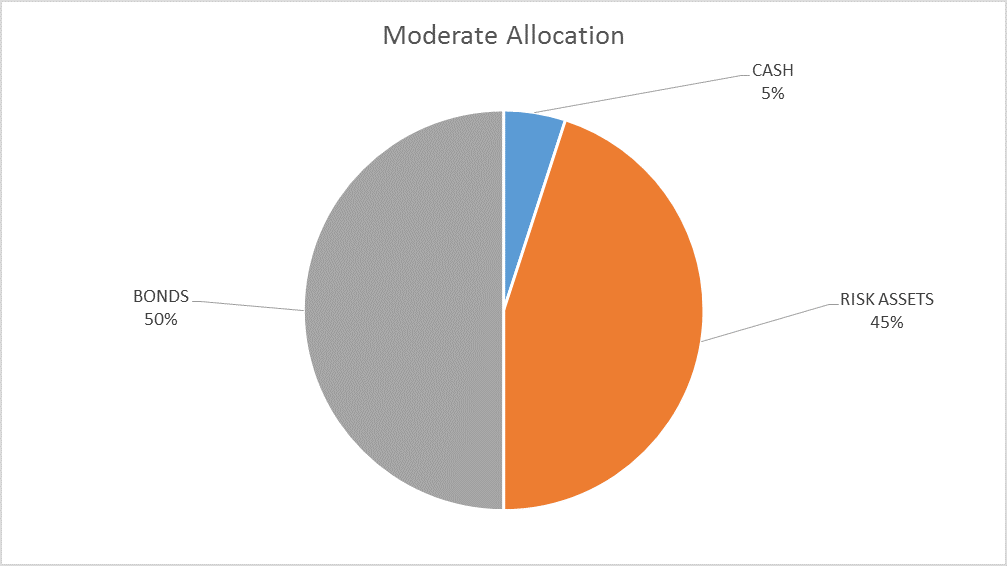
| There is no change to the risk budget this month. For the moderate risk investor the allocation to bonds is 50%, risk assets 45% and cash 5%. Despite the selloff of the last week I don’t believe any portfolio action is warranted. While the overbought condition has largely been corrected now, the S&P 500 is far from the opposite condition, oversold. At the lows this morning, the S&P 500 was officially in correction territory, down 10% from the recent highs. That, in and of itself, is not sufficient in our process to dictate a change in allocation. |
 - Click to enlarge |
When I last wrote an asset allocation update on January 4, the S&P 500 closed at 2723.99. As I write this late on February 6th, the S&P 500 is trading at 2695.14, a drop of 1.1%. Now, if that was the only information you had, how would you feel about the stock market? Worried? Panicked? Kind of hard to get worked up about isn’t it? Of course, we do have other information and know that the market actually traded in a 280 point range during that time. First a quick 5.5% rally to the top and then an even quicker nearly 10% drop, mostly compressed into two and half trading days. Does that matter? Can you just ignore what happened in between and concentrate on the end result?
Mostly, I think that is pretty good advice. We know from research that the more often people look at their accounts the worse their returns. You can always find something to do with your portfolio – fear and greed are eternal – and checking your account makes it that much more likely that you will. And the more changes you make the more likely it is you’ll make a mistake. Investment advisers have to guard against this more than the average person because it is our job to look at the markets and most of us do it every day. And most of us are still human and susceptible to the same foibles as other investors.
And besides, despite the big numbers, the selloff of the last three days is pretty unremarkable in market history. There are over 100 previous trading days with worse percentage losses than Monday and most of them are forgotten. Remember August 2011? No? The 8th and the 10th of that month were both worse than Monday. That selloff took the S&P all the way down to 1101.54 and the market has only managed a 145% gain since then. In the big picture, those two bad days meant absolutely nothing. Will the last three days be similarly forgotten? Probably….
However, I do think that the events of the last few weeks may be important from a psychological standpoint. Remember, this game we call investing is akin to poker, in that we are playing the other players. John Maynard Keynes said the stock market was like a beauty contest where the judge’s job was not to choose the most attractive contestant but rather to choose the contestant the other judges deemed the most attractive. It sounds similar and it is but getting it right means knowing as much about the judges as the contestants. So the rally and subsequent correction may be important to the future course of the stock market if it affects how other investors perceive the market. With all the easy money trades blowing up recently investors may start actually thinking before they jump into the latest new-fangled investment they don’t understand. Nah, that’s not going to happen.
A big part of the sell off Monday was an unwinding of the short volatility trade that had become ubiquitous. How ubiquitous? In August of last year the New York Times ran an article about Seth Golden, a former Target logistics manager who ran his net worth from $500k to $12 million in five years shorting various volatility linked securities. Stock markets have been remarkably calm this entire bull market and betting that it would stay that way had become the most crowded trade on the street. I hope Mr. Golden put some of that $12 million aside in something safe because the trade came unglued over the last couple of days with the VIX spiking to over 50 from record lows under 10. Being short something that goes up by five times in a few days is a great way to do a round-trip back to Target logistics manager (not that there’s anything wrong with that).
The VelocityShares Daily Inverse VIX short term ETN (XIV), a popular short volatility trading vehicle for retail investors traded at a high of $146.44 on January 11. It closed today at $7.34 and will be liquidated later this month by its sponsor. Stories are already emerging of amateur traders blowing small fortunes – earned over a few years of shorting vol – in a few days. I have zero sympathy for them. If God wanted us to have free lunches He would have given us Star Trek replicators by now.
Likewise bitcoin which, while not directly related to the stock market swoon, is also an easy money trade suddenly not so easy. I took some heat for saying that Bitcoin’s intrinsic value is zero and even under $6000 this morning it still is way above nil, but it is down from $20,000, not an insignificant drop of 70%. On second thought, is the great cryptocurrency massacre related to the stock market swoon? Is it just coincidence that we see a rise in volatility just as the Fed starts to reduce the size of its massive balance sheet? Volatility is nothing but the inverse of liquidity and reducing the size of the balance sheet would seem to qualify as a liquidity reducing event. And I would also note that the reduction in January was the largest monthly drawdown since they announced their balance sheet diet plan. The Fed itself – well Bernanke – said that QE would raise asset prices and produce a wealth effect and he seems to have been right about that (although not much and not much else in my opinion). Shouldn’t a reversal produce the opposite? Or was QE another free lunch?
I don’t know whether the reversal of QE is responsible for the recent stock market selloff or the bitcoin selloff. It may be nothing more than an interesting coincidence. What I do know is that there was little change in the fundamentals of the market since January 26th when we made the all time high. If anything, as you’ll see below, the fundamentals improved. It just goes to show, once again, that the market is not the economy and the economy is not the market. Somewhere around 2.85% on the 10 year Treasury note yield good news for the economy suddenly turned into bad news for stocks. Or at least that is the most popular reason cited for the selloff. Supposedly the average hourly earnings reported as part of the full employment report incited inflation fears and the prospect of more or faster tightening by the Fed spooked the market. Flighty thing isn’t it?
There are lots of problems with that narrative and you can go read about it if you feel the need. I’d just remind you before you do that we’ve seen these one month pops plenty of times before and they turned out to be nothing. One month does not a trend make. Janet Yellen has been waiting patiently for the Phillips Curve to kick into high gear this entire business cycle and I doubt that it finally showed up her last day on the job. Did the market sell off because interest rates are rising? I suppose that could be part of the cause but stocks were fine when rates were 10 basis points lower. What was it about that last 10 basis points that flipped the switch to sell? Or did the market sell off because Yellen decided her exit interview would be an excellent time to tell the public that, gee, look at that, stocks sure are expensive. Or maybe it sold off because her successor, Jerome Powell, is seen as less likely to have the market’s back if things start to get ugly. Or maybe it was because Yellen decided to throw Wells Fargo under the bus on her way out the door. Or maybe, as is most often the case, we really don’t know what motivated sellers.
The volatility of the last few days is really nothing more than markets getting back to normal. It is the complete lack of volatility the last few years that is abnormal. And it is that lack of volatility, provided by the Fed’s obsession with transparency and a huge dollop of excess liquidity, that led investors to believe they had discovered a perpetual money machine in the short vol trade, The Fed’s obsession with stamping out all kinds of volatility – economic and market – has led our economy to this state where Target logistics managers find it more appealing – and profitable at least for a while – to speculate in derivatives than manage logistics. Here’s hoping there is no such thing as the Powell put.
By the way, we think the most important decisions you make are the ones you make before you invest What do you do when we get these episodes of volatility? Do you have a process to follow or will you succumb to emotion? You can do a lot of right things – minimize costs by using index funds for instance – and it won’t matter a bit if you make emotional decisions. Now on to our market indicators that guide our investment process.
Yield CurveAs I said above, some of our economic indicators actually improved since the last update and the yield curve is one of them. The 10/2 curve actually steepened a small amount since the last update. And it is in a bullish way, with long term rates moving up faster than short term rates. It isn’t a large move and it may get reversed in time but it is in the right direction. |
2 Year Bonds Yield Curve, Jul 2017 - Feb 2018 - Click to enlarge |
| More important I think is that the rise in long term rates has been driven by a rise in real rates, an indication that real growth expectations are rising. Yes, there has been a rise in inflation expectations too but the most recent move was more about real growth. 10 year TIPS yields have returned to the top half of the trading range that has prevailed since mid-2013. A break out that is sustained would be very good news for the economy. Would it be good for stocks? Long term, almost certainly. Short term? Maybe not. Again, the economy is not the market and the negative of higher interest rates may offset the positive of better growth – for a while. But this hasn’t broken to new highs yet and I don’t see any reason to try and anticipate the next move. |
10 Year Treasury Inflation Indexed Security, Jul 2013 - Jan 2018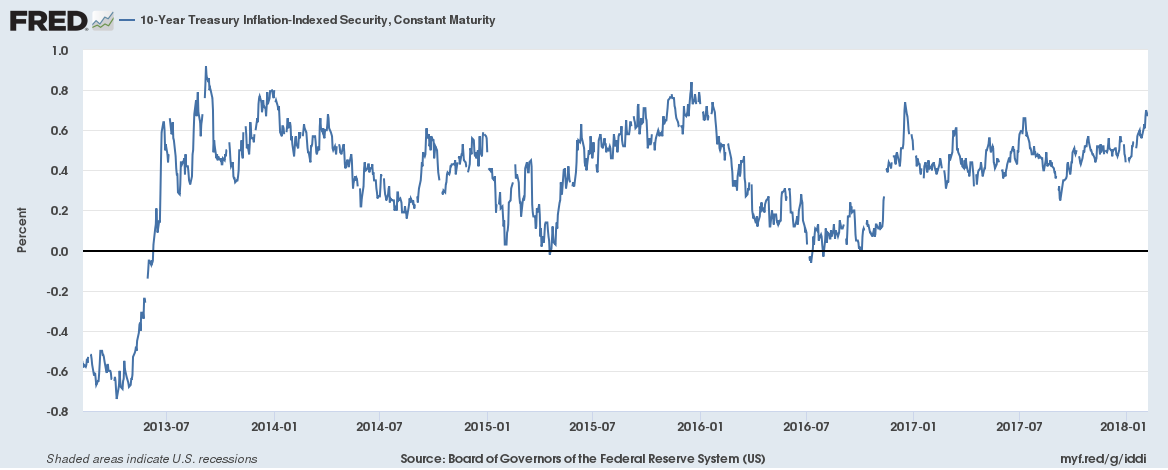 - Click to enlarge |
Credit SpreadsSpreads widened by 20 basis points since the last update on 1/4 and 37 basis points since the stock market peak on 1/26. Such a small move is not sufficient to warrant an allocation change. |
BofA Merrill Lynch US High Yield Option, Jul 2011 - Jan 2018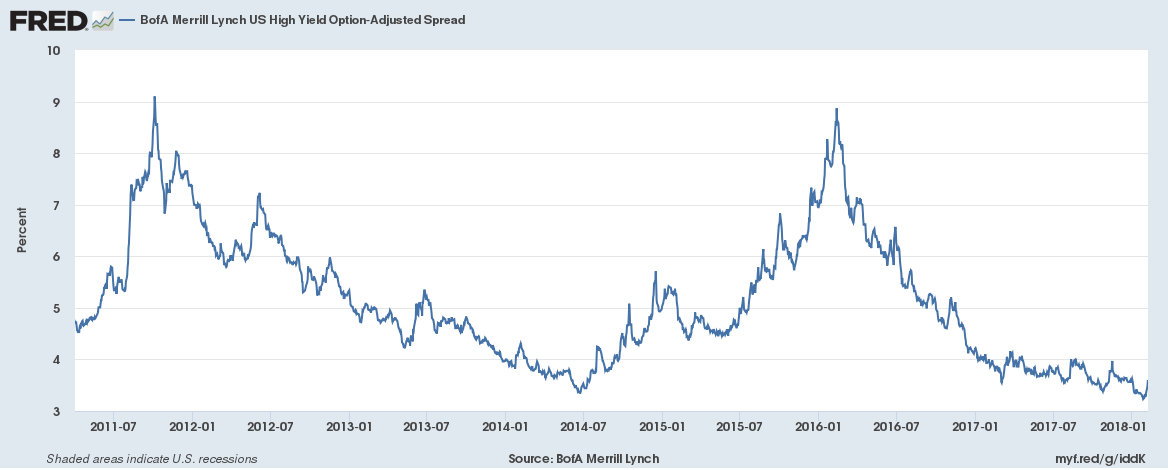 - Click to enlarge |
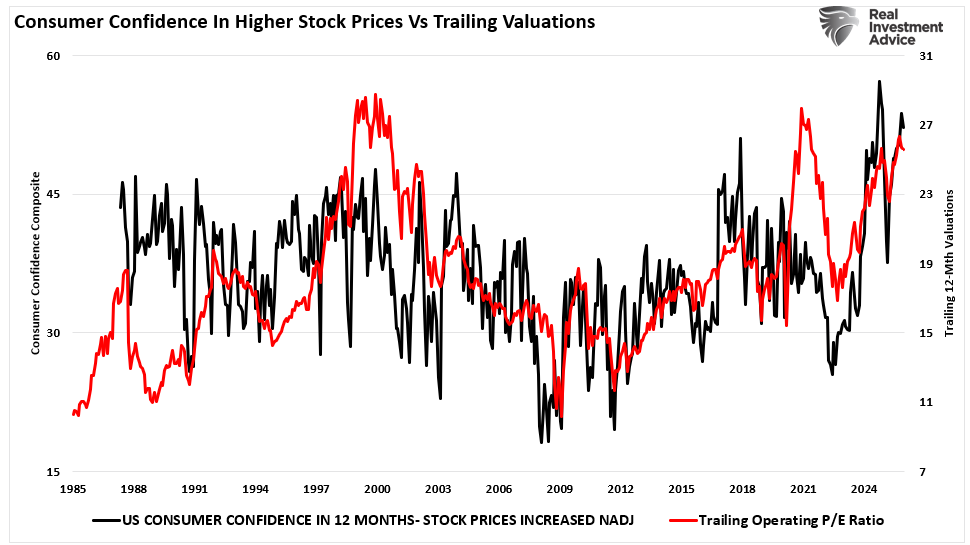
ValuationsThe market selloff was not large enough to change valuations by any significant amount. Earnings estimates have been rising though as analysts factor in tax cuts. So far, it looks like bottom up estimates are up about 4% for Q1 which is consistent with my thinking but may be somewhat less vigorous than the market expects. On the other hand, I would just note that the largest part of the expected rise in earnings for 2018 is in the energy sector. And those gains are largely dependent on analysts predictions about oil prices which seems pretty shaky ground upon which to build an investment story. As I’ve noted before, much of the gain in corporate investment over the last 18 months has been from drilling new wells after the oil price recovery. To achieve a more balanced expansion we need to see a handoff from the energy sector to other parts of the economy and so far I don’t see it. The rise in real rates is a positive note in that regard though and certainly worth watching. |
S&P 500 Large Cap Index, Jul 2017 - Feb 2018(see more posts on S&P 500 Large Cap Index, )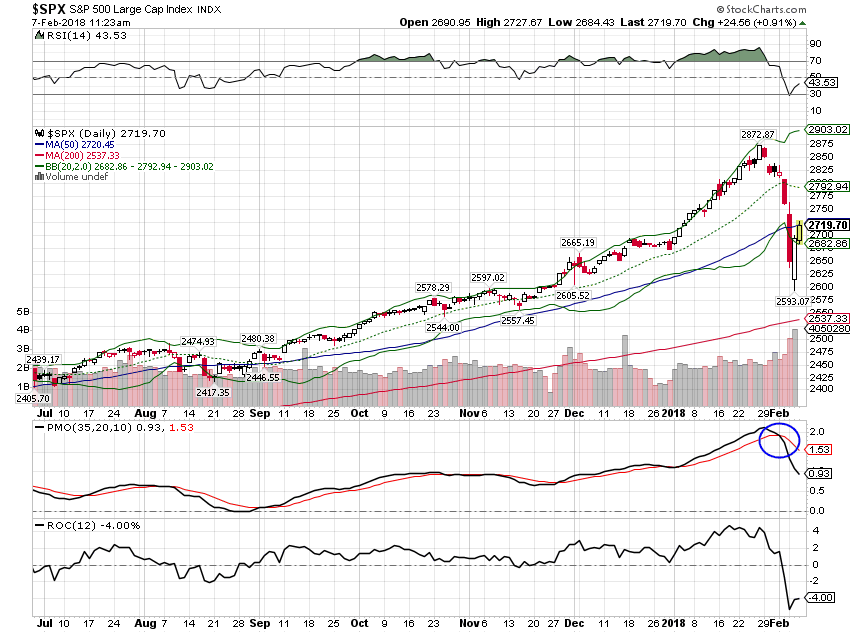 - Click to enlarge |
MomentumObviously, short term momentum for the S&P 500 has turned lower but longer term measures are, so far, only correcting the previous overbought condition. We tend to focus on intermediate and long term momentum and put a lot less emphasis on short term measures. We are getting the expected bounce right now and how that plays out could play a big role in whatever moves we make or don’t in coming months. |
S&P 500 Large Cap Index, 2006 - 2018(see more posts on S&P 500 Large Cap Index, )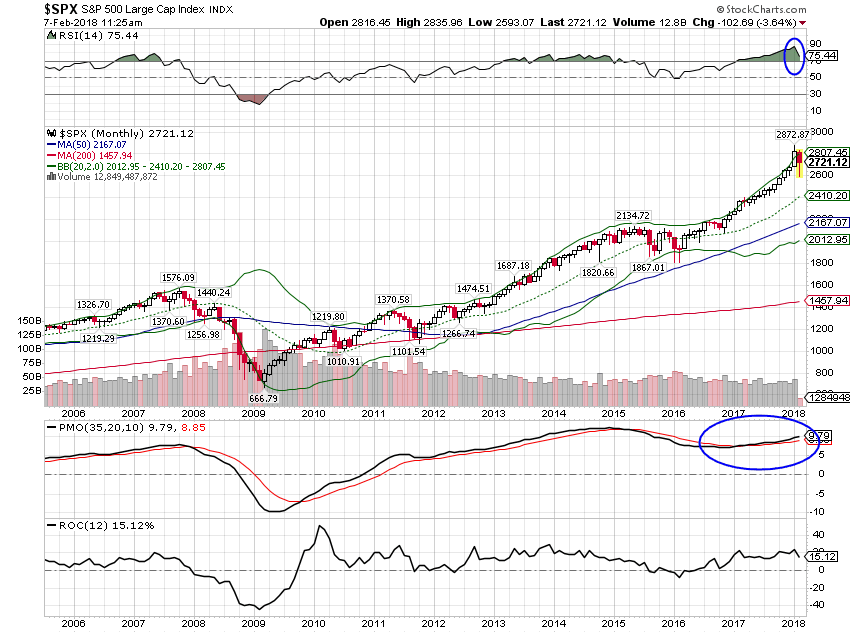 - Click to enlarge |
| One of the interesting things about this correction is that it was not accompanied by what we’ve come to expect in these episodes. The rise in volatility was in many ways a global event and I would have expected the dollar to rally. But the response was tepid at best and I think goes to demonstrate the disdain for the dollar globally. I still think a move back up to the low 90s is likely before resuming the downtrend. We may have corrected one of the markets at an extreme – stocks – but there are others where speculators still haven’t gotten their comeuppance. The long Euro trade is very crowded right now. |
US Dollar Index, Feb 2015 - 2018(see more posts on U.S. Dollar Index, )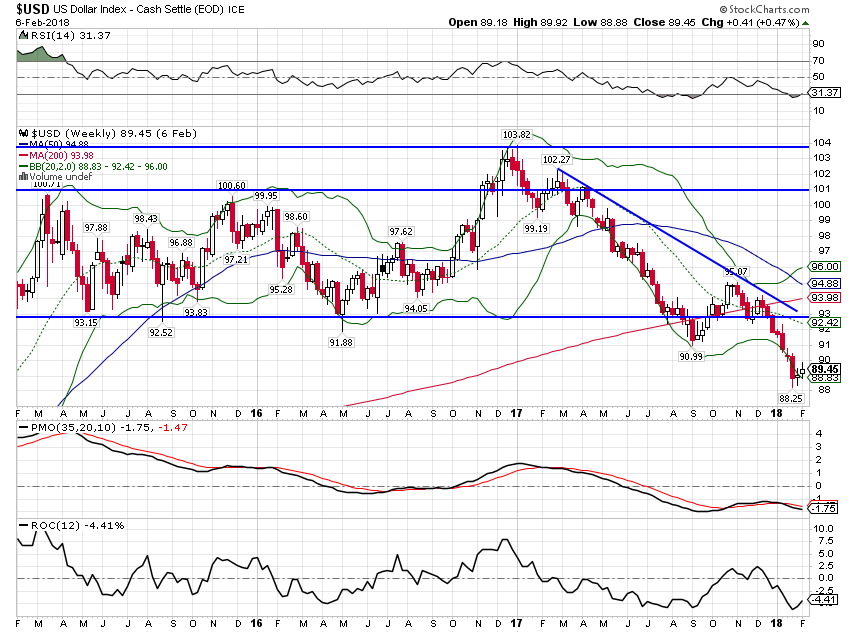 - Click to enlarge |
| We have been overweight international assets for over a year because of the falling dollar and it has been a good decision in some ways. Long term momentum still favors international over US stocks but it has not been a smooth transition. EFA did outperform SPY on this pullback though with a top to bottom move of less than 8% while SPY almost hit 10%. And the weekly trend is intact although momentum is not supportive right now. Still, my focus is on the long term momentum shift. Currency trends tend to be long lived and history tells us that international assets tend to outperform when the dollar is falling. |
EFA:SPY Weekly, Apr 2015 - Feb 2018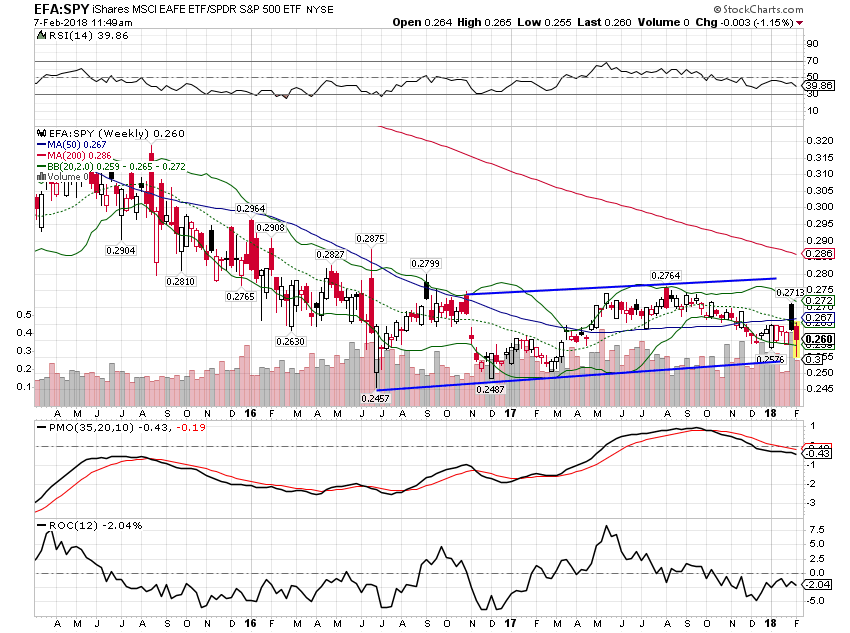 - Click to enlarge |
| The correction in EM stocks was about the same as the US and short term momentum there has also rolled over. But intermediate and long term momentum remain positive and EM stocks continue to outperform the more general international indexes. |
EEM:EFA Weekly, Mar 2015 - Feb 2018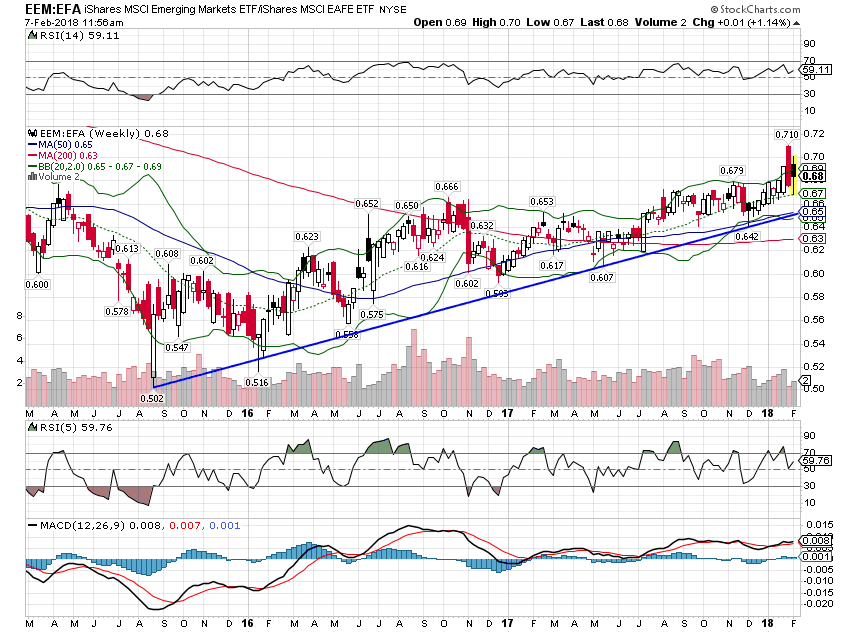 - Click to enlarge |
| Japan’s correction was similar to the overall EAFE drop of around 8%. Japan continues to outperform EFA short term and the long term shift continues to favor Japan as well. I am considering shifting some from EFA to EWJ but I want to see whether the Yen breaks out and how that impacts the market if it does. I swapped from DXJ to EWJ a couple of years ago and that has been to our benefit but the Yen uptrend stalled in 2017. |
EWJ:EFA Daily, Jul 2017 - Feb 2018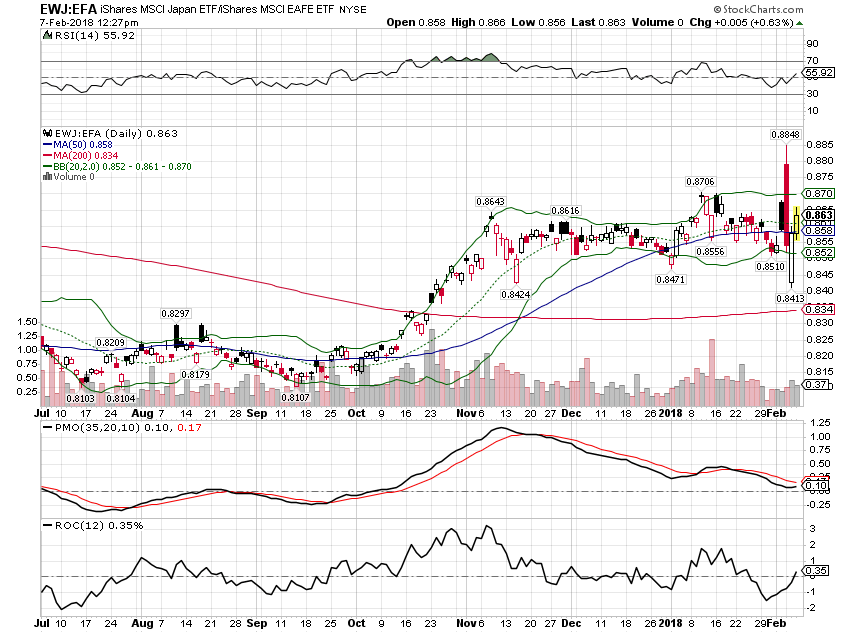 - Click to enlarge |
| The weak dollar continues to support commodity prices. The commodity ETFs corrected with stocks but much less severely. |
Bloomberg Commodity Index, Aug 2017 - Feb 2018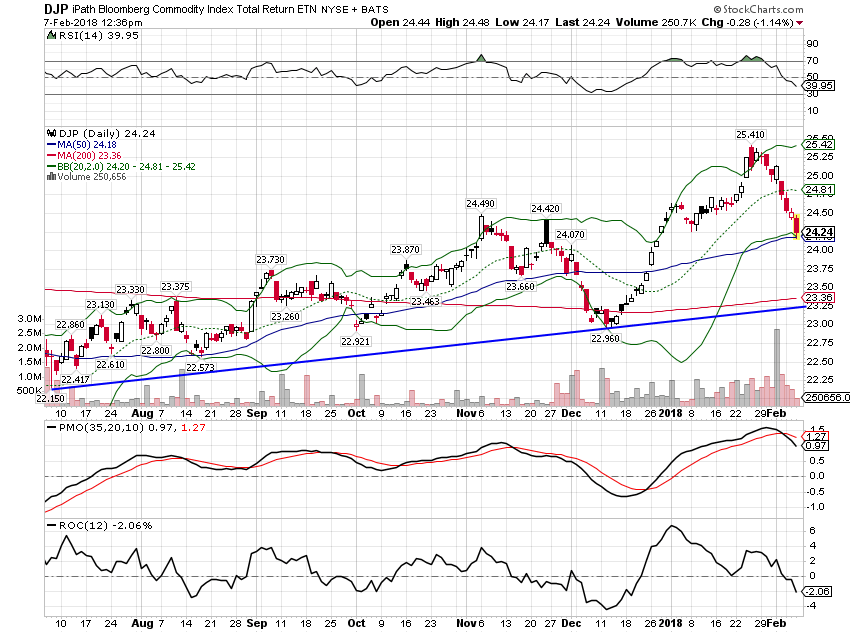 - Click to enlarge |
| Similar to the long term momentum shift to international equities the weak dollar is also influencing the long term shift in momentum to commodities from stocks. It is tenuous but ongoing. |
GSCI Commodity Index, 1999 - 2018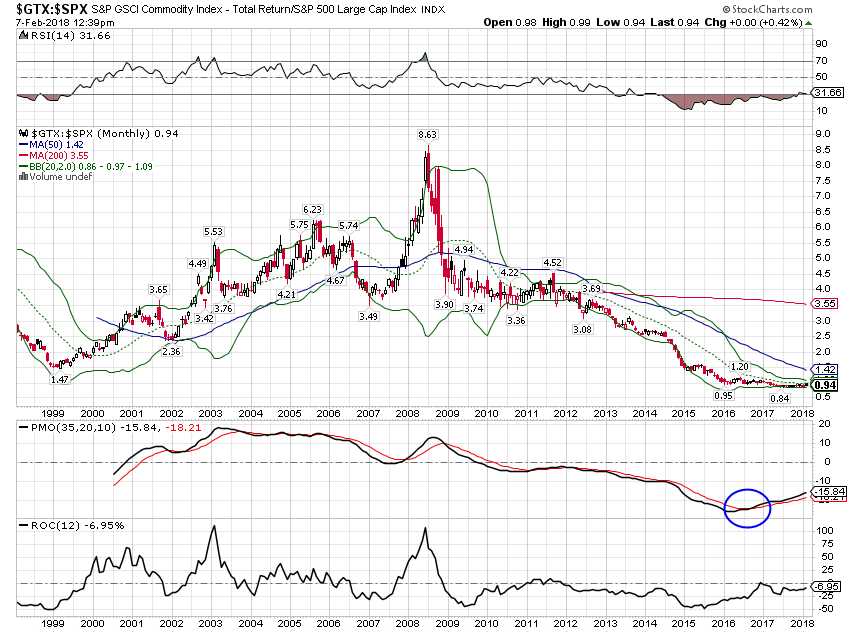 - Click to enlarge |
| Gold also performed well during the correction: |
Gold Daily, Jul 2017 - Feb 2018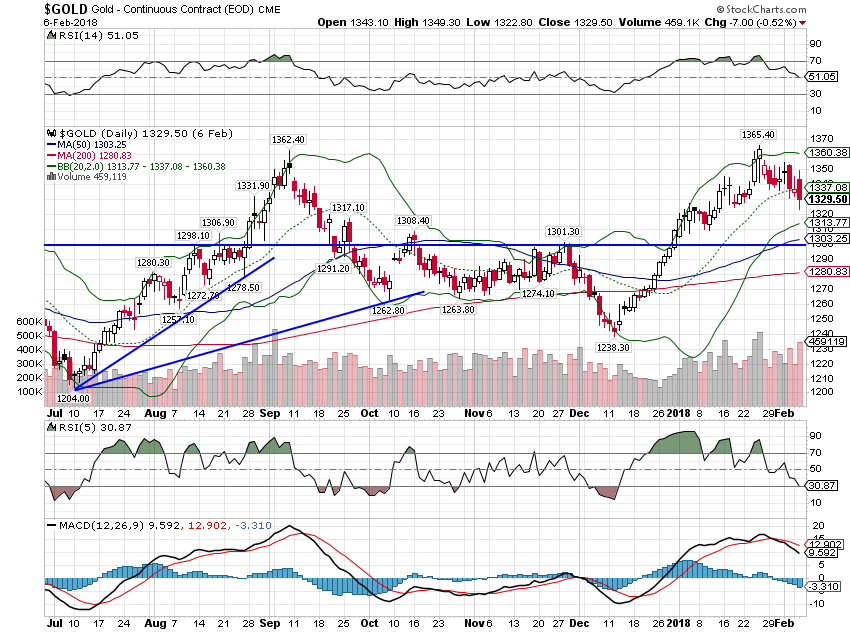 - Click to enlarge |
| Not much in the bond area performed well but TIPS continue to outperform nominal Treasuries: |
TIP:IEI Daily, Jul 2017 - Feb 2018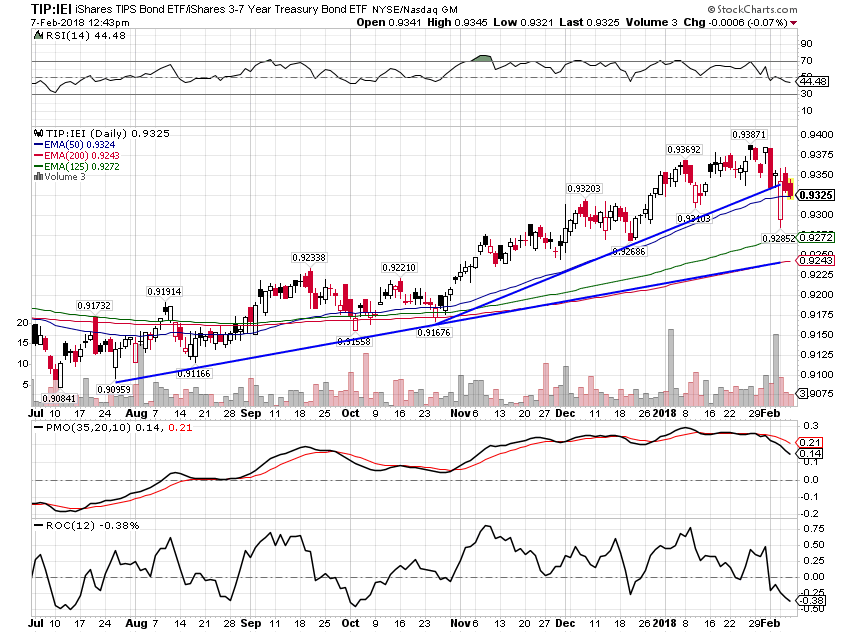 - Click to enlarge |
| There weren’t many winners over the last month but all of them are weak dollar related in a way. The losers are concentrated in interest sensitive items with REITs taking it on the chin as US rates rose. |
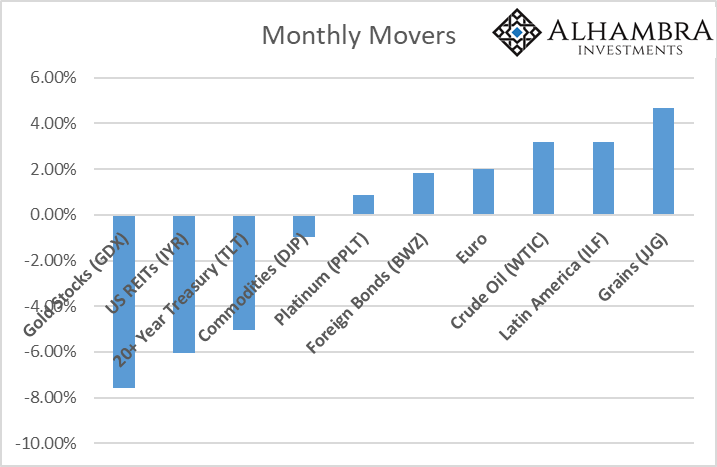 - Click to enlarge |
| There are no changes to the portfolios this month. As a reminder here is the moderate portfolio allocation I posted last month.
By the way, as a firm we did some rebalancing in January to bring these percentages back to the targets. We also rebalanced all of our passive accounts which mostly meant selling stocks and buying bonds. If you haven’t rebalanced in a while you probably ought to consider it. If you don’t know what rebalancing is, please get in touch with us. Soon. |
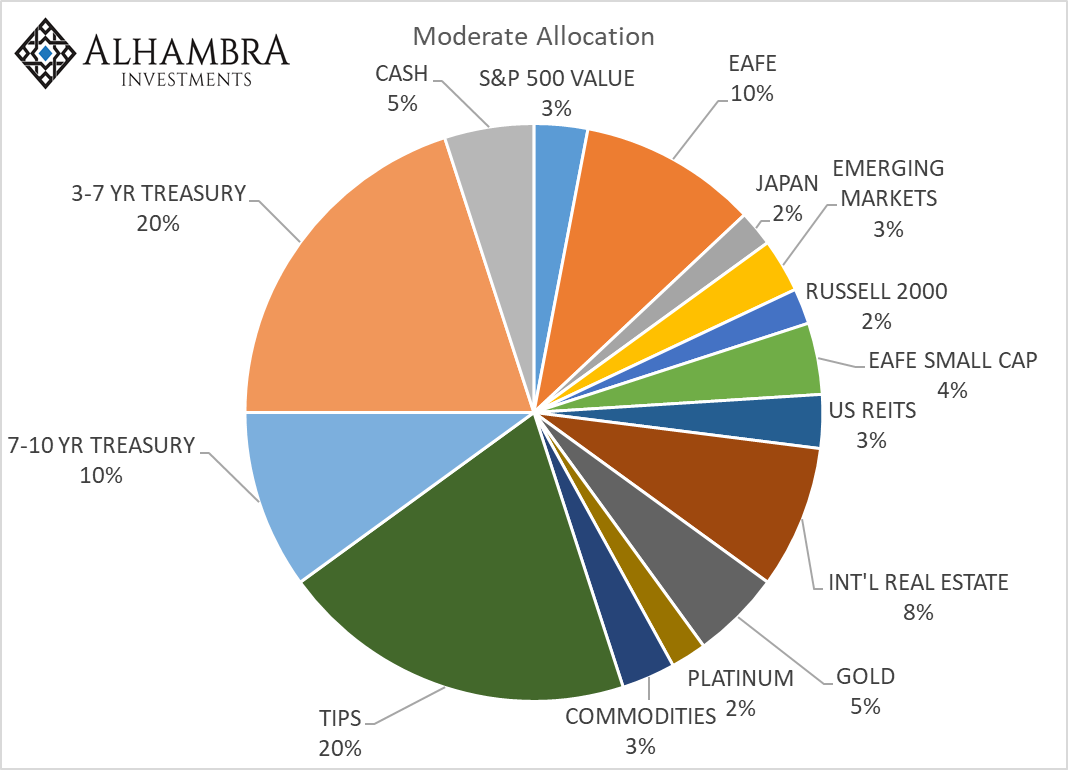 - Click to enlarge |
Tags: Alhambra Research,Asset allocation,Bitcoin,Bonds,commodities,credit spreads,currencies,earnings,Emerging Markets,Global Asset Allocation Update,Gold,inflation,Investing,Janet Yellen,Japan,Jerome Powell,Markets,Model Portfolios,momentum,Monetary Policy,newslettersent,Quantitative Easing,S&P 500 Large Cap Index,stocks,TIPS,U.S. Dollar Index,US Dollar Index,valuations,Volatility,Yield Curve