Jeffrey P. Snider
My articles My offerMy siteAbout meMy videosMy books
Follow on:LinkedINTwitterSeeking Alpha
| Real Personal Consumption Expenditures (PCE) rose 0.6% in September 2017 above August. That was the largest monthly increase (SAAR) in almost three years. Given that Real PCE declined month-over-month in August, it is reasonable to assume hurricane effects for both. Across the two months, Real PCE rose by a far more modest 0.5% total, or an annual rate of just 3.4%, only slightly greater the prevailing average.
It is also quite reasonable to assume that spending even a little above what is really a poor average growth rate will not last long. As always, the issue is income, or what little national income growth there has been. That is really two parts combined for late 2017, meaning the longer-term problem of those “missing” 15.3 million Americans now joined with slowing labor utilization after the “rising dollar.”
|
US Disposable Personal Income, Jan 1985 - 2017(see more posts on U.S. Disposable Personal Income, )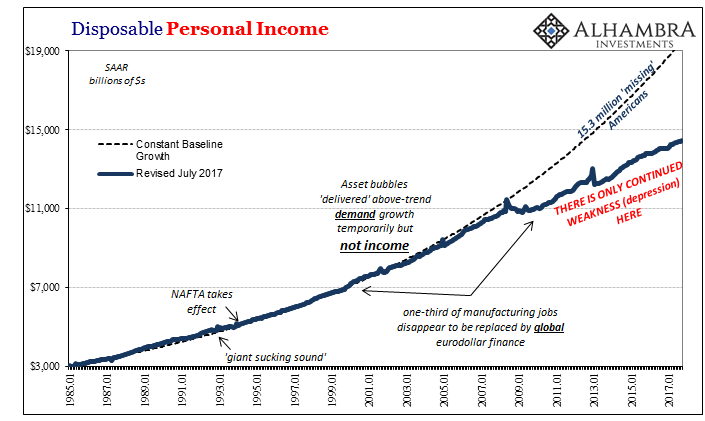 - Click to enlarge |
| The result is income growth that is beyond anemic. |
US Disposable Personal Income, Jan 2010 - 2017(see more posts on U.S. Disposable Personal Income, )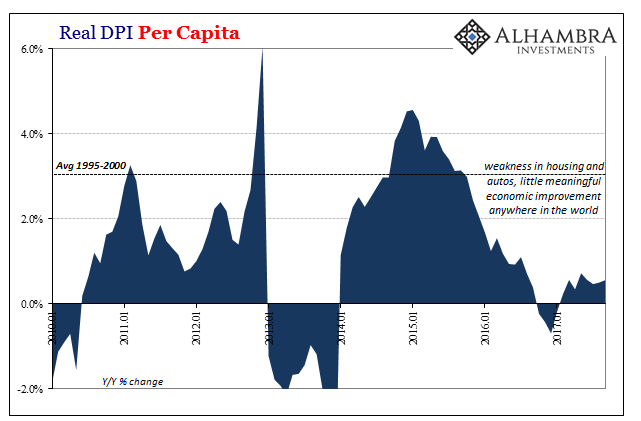 - Click to enlarge |
| Real Disposable Personal Income per Capita has declined (seasonally adjusted M/M) for four straight months going back to May, therefore unrelated to tropical storm impacts. |
US Disposable Personal Income, Dec 2013 - Sep 2017(see more posts on U.S. Disposable Personal Income, )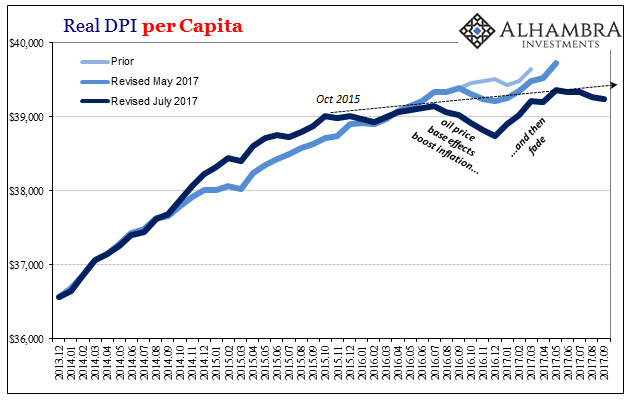 - Click to enlarge |
| Year-over-year, per capita income growth is stuck at basically zero, just 0.53% as a 6-month average. |
US Personal Consumption Expenditures, Jan 2000 - 2016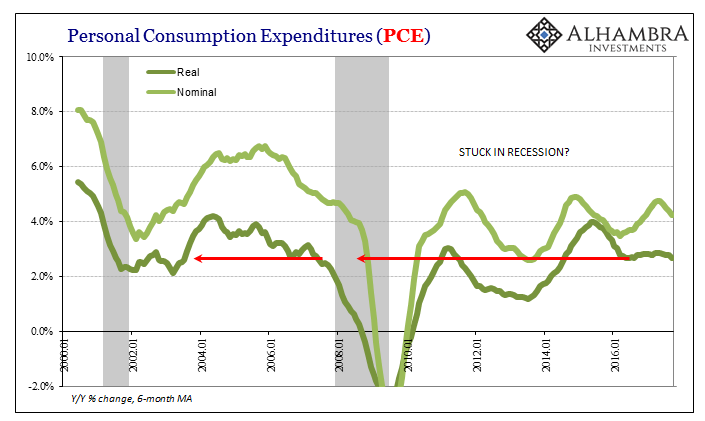 - Click to enlarge |
| Without income growth there can be no acceleration in consumer spending. Real PCE over the intermediate term remains unmoved in either direction. Already at a soft pace, consistently weak consumer spending despite decelerating income growth can only lead to one thing: |
US Savings Rate, Dec 2013 - Sep 2017(see more posts on U.S. Savings Rate, )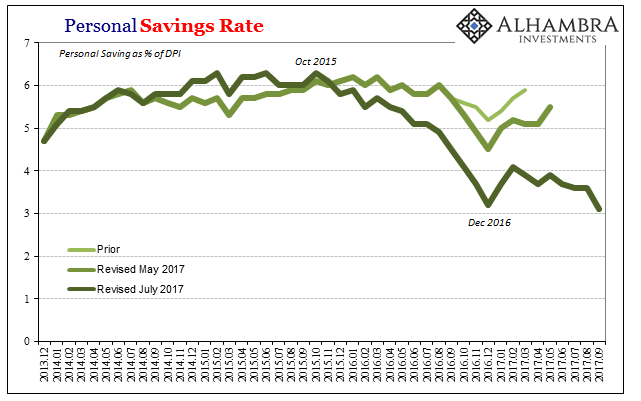 - Click to enlarge |
| The large monthly increase in spending in September had the effect of reducing the Personal Savings Rate to just 3.1%. That’s lower than in December 2016, and the lowest savings rate in just about ten years. |
US Savings Rate, Jan 2000 - 2017(see more posts on U.S. Savings Rate, )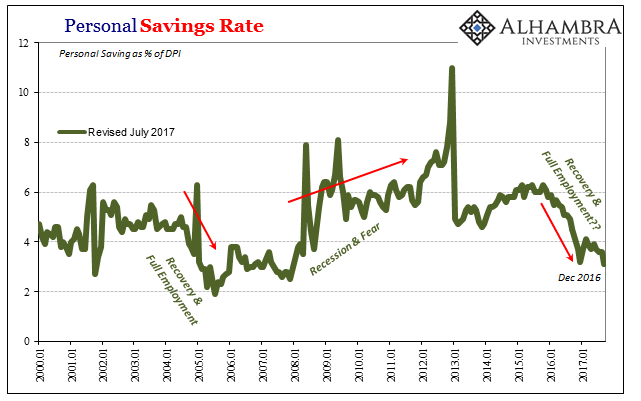 - Click to enlarge |
| Normally, at least in the past few decades, a drop in the savings rate of this magnitude has meant consumers embracing recovery and the growth part of the business cycle.
|
US Personal Income, Dec 2013 - Nov 2017(see more posts on U.S. Personal Income, )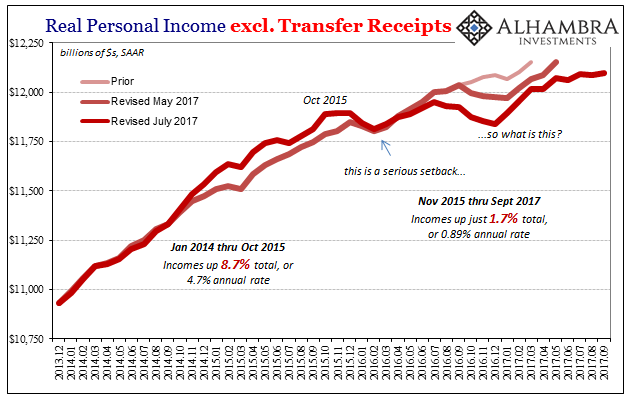 - Click to enlarge |
| Though in the mainstream it is characterized that way today, the income data in all the various forms is uniformly suggesting something very different. US consumers can’t keep up spending even at an anemic pace, which is why according to several other economic accounts they haven’t been. |
Us Personal Income, Jan 2014 - Nov 2017(see more posts on U.S. Personal Income, )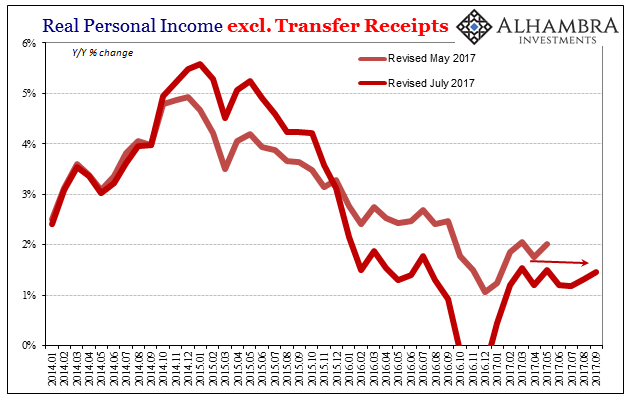 - Click to enlarge |
| Whether auto sales (what really popped in September), housing, or just retail sales overall, there is no economic momentum because there can’t be any. |
US Personal Income, Jan 2010 - July 2017(see more posts on U.S. Personal Income, ) - Click to enlarge |
| The economic mysteries of 2017 aren’t at all unexplained. Without labor market growth there is no income growth, therefore no spending growth.
|
US Markets and Economy, March 2012 - 2017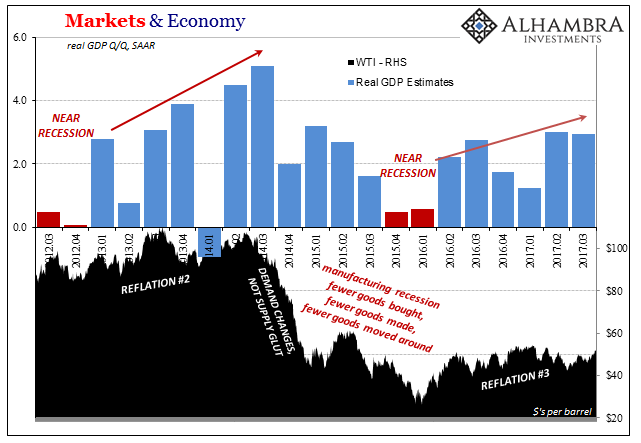 - Click to enlarge |
| Without spending, the economy at any point can’t gain sufficient acceleration especially with high levels of remaining inventory. |
US Private Non-residential Fixed Investment, Jan 2008 - 2017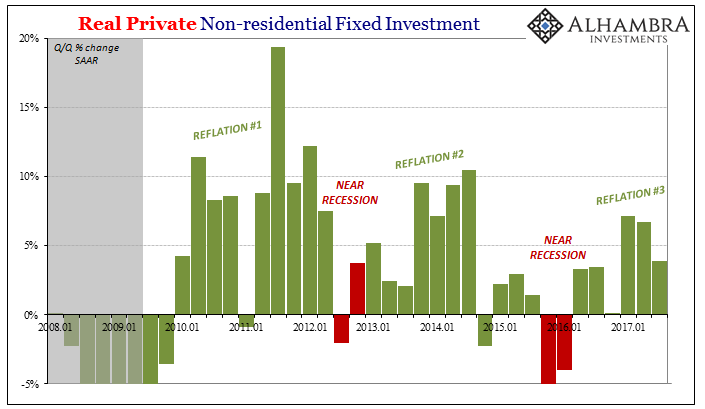 - Click to enlarge |
| The whole thing remains stuck on a reducing (mini) cycle. Things only get worse each time one of these downturns materializes. |
US Eurodollar Futures Curve, June 2010 - 2017(see more posts on eurodollar futures curve, )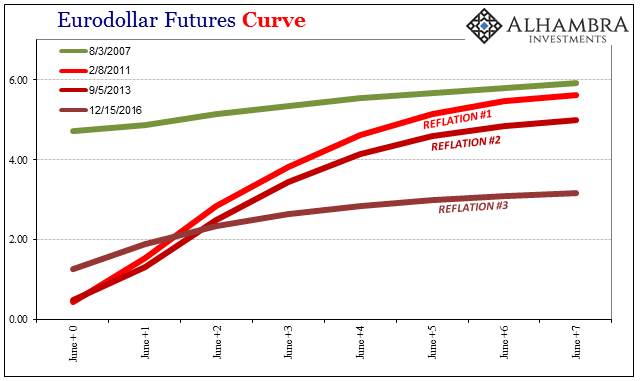 - Click to enlarge |
| It was inflation expectations through QE that was supposed to break that positive feedback loop. The idea of “money printing” is really simple in the form of economic expectations. Any business confronted with the idea of rising input costs, especially rapidly, is going to speed up production before those costs really hit hard, leading to a virtuous circle of all things rising together.
It’s a sound theory that was well established by practice in the 1970’s. It’s much more debatable as a matter of controlled policy experimentation. It was downright dubious in in the practice of quantitative easing whose “easing” took the form of exchanging one form of liquidity for another – and in many cases, a useful form (UST collateral) for an idle one (bank reserves). It’s hardly easing where the most charitable narrative suggests little more than a swap. |
US Chain Type Price Index, Jan 2004 - 2017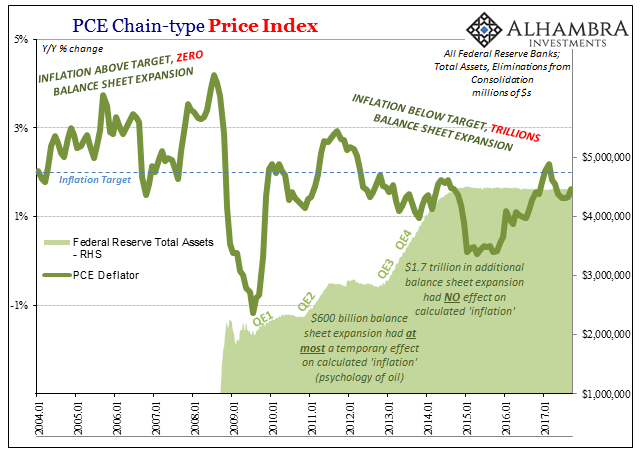 - Click to enlarge |
| The key for any central bank is plausibility, meaning that businesses in order to act on inflation expectations have to really believe in them. It was a very easy to do so in the late sixties and throughout the seventies.
That’s why there was an almost recovery in the first instance of QE, the combination of huge positive cyclical forces plus some additional inflation expectations due to unfamiliarity with QE meant more momentum for that upturn – and even still it was far short of what “should have” been produced. |
US Monetary Inflation Anchor, Jan 2004 - 2017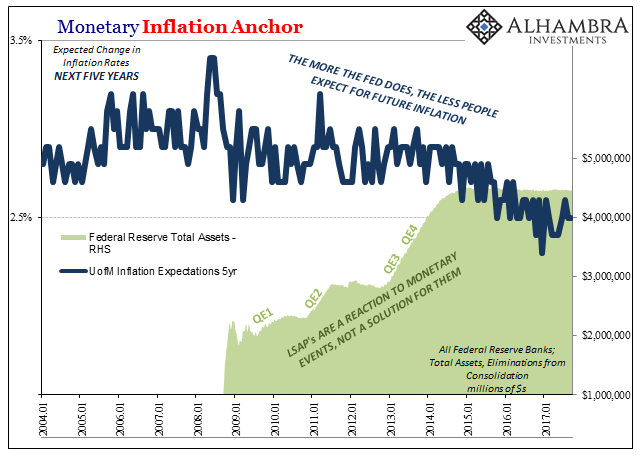 - Click to enlarge |
| Repeated QE, then, simply confirms as invalid those inflation expectations (along with persistently lower consumer inflation, the opposite of what you would expect from trillions of money printing). If you have to do it more than once, there can only be doubt about what constitutes enough “money printing” if not outright rejection that there is or has been any money printing at all. For each negative liquidity/monetary event after the initial panic that QE doesn’t solve, or even offer much to offset them, it only confirms these economic suspicions related to a great many necessary economic factors including the liquidity preferences of businesses (and how labor costs fit within them).
The “rising dollar” was simply one too many harmful monetary episodes for businesses to swallow. Faced with liquidity preferences and an “unexpected” downturn, it’s no wonder the labor market has stalled, leaving income growth to suffer both the unalleviated long-term jobs shortage and to now add a prolonged (two and half years so far) further slowdown. |
US Establishment Survey Payrolls, Jan 2010 - July 2017(see more posts on payrolls, ) - Click to enlarge |
Against that background, there is no possible way such a low savings rate adds up to the same thing it did before. It cannot be recovery and growth because everything that would make recovery and growth are all moving in the wrong direction in (monetarily) synchronized fashion. This “reflation” economy is easily less than the last one three years ago for what little expectations was removed in between.
Where there was QE1 and QE2 in “reflation” #1, and QE3 and QE4, in the lesser “reflation” #2, what seems to be left for and of the truly minimal “reflation” #3 is hoping for blind, dumb luck that things have to turn around because at some point enough is enough. There is no other basis for accelerating growth, only irrational expectations that the global economy will for no apparent reason spring to life because it’s been so long since we’ve seen actual growth.
It’s just not rational analysis, which explains the difference between stocks and bonds.
Tags: Bonds,consumer spending,currencies,economy,establishment survey,eurodollar futures curve,Federal Reserve/Monetary Policy,income,jobs,Labor Market,Markets,newslettersent,payrolls,PCE,personal consumption expenditures,personal savings rate,real personal income excluding transfer receipts,stocks,U.S. Disposable Personal Income,U.S. Personal Income,U.S. Savings Rate