George Dorgan
My articles My siteAbout meMy videosMy books
Follow on:LinkedINTwitterSeeking Alpha
CFA SocietyEconomicBlogs
EUR/CHFLet us remember why the euro has risen from 1.08 to 1.14 between June and August:
We are of the opinion that both points may be illusionary. The euro should not rise further. Politicians cannot improve the economic reality, in particular Macron. He does not do any big spending programs that could raise inflation. And we often stated that core inflation with 1.3% is too low for any big ECB surprise. |
Euro Area Annual Inflation, August 2017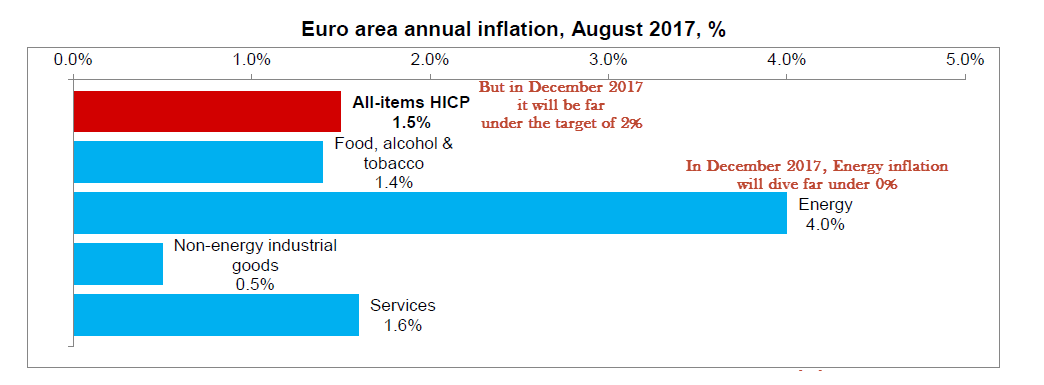 - Click to enlarge |
USD/CHFThe US dollar was whipsawed ahead of the weekend. The greenback had been pulling back following the soft core PCE deflator the day before, and losses accelerated after the disappointing US August employment report. However, a report citing unnamed European officials warned that the ECB might not be ready to decide on its asset purchase program as many expected at the meeting on September 7. This spurred a reversal of the euro and helped lift the dollar more broadly.
|
EUR/CHF and USD/CHF, September 2(see more posts on EUR/CHF, USD/CHF, )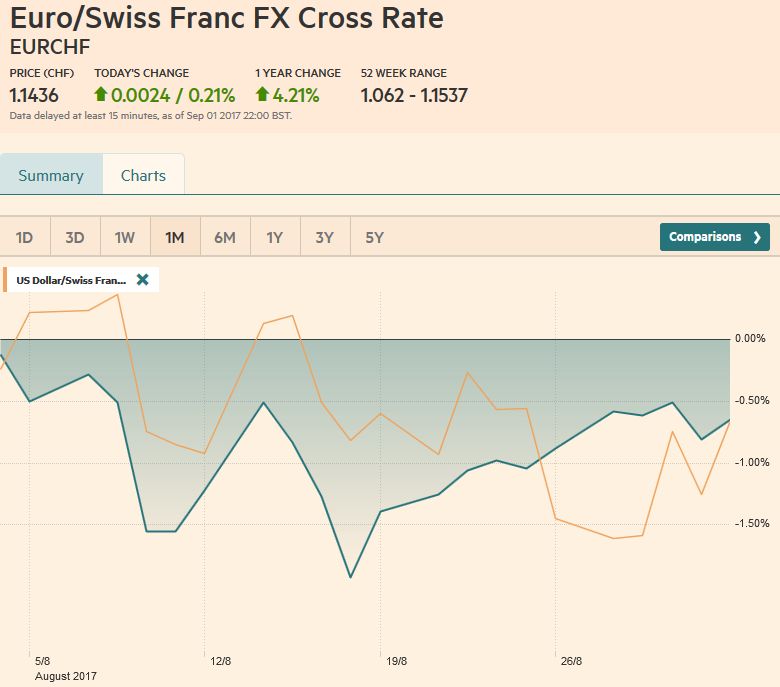 Source: markets.ft.com - Click to enlarge |
Swiss Franc Currency Index (3 years)The Swiss Franc index is the trade-weighted currency performance (see the currency basket)On a three years interval, the Swiss Franc had a weak performance. The dollar index was far stronger. The dollar makes up 33% of the SNB portfolio and 25% of Swiss exports (incl. countries like China or Arab countries that use the dollar for exchanges). Contrary to popular believe, the CHF index gained only 1.73% in 2015. It lost 9.52% in 2014, when the dollar (and yuan) strongly improved. |
Swiss Franc Currency Index (3 years), September 2(see more posts on Swiss Franc Index, )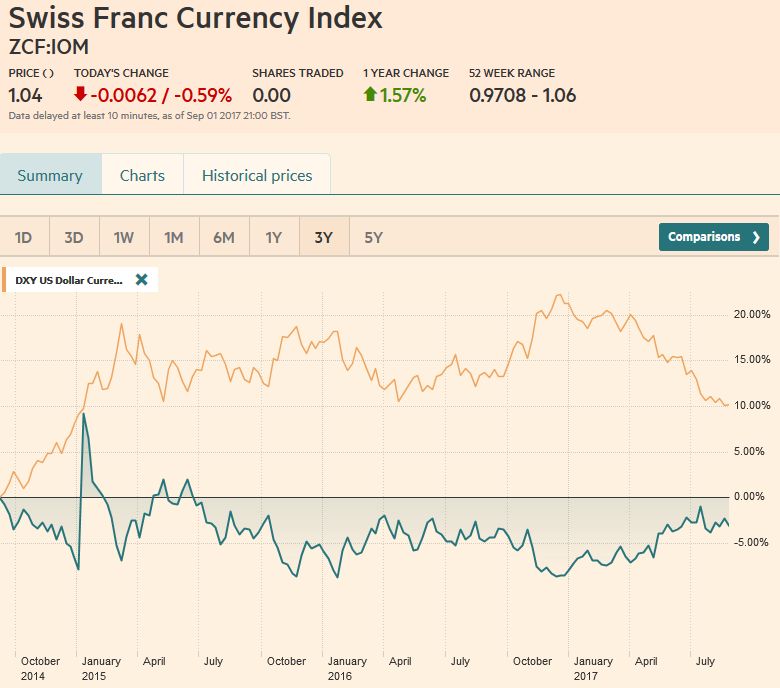 Source: markets.ft.com - Click to enlarge |
| Marc Chandler My articles My offerMy siteAbout meMy videosMy books Follow on:LinkedINTwitterSeeking AlphaAmazon US Dollar IndexWe expect September to be a challenging month for the dollar, which on a real broad trade weighted basis has fallen for the first eight months of the year, the longest losing streak since 2009. However, once past the debt ceiling (and spending authorization), we expected a better Q4 performance. The dollar sell-off that began before Yellen and Draghi spoke at Jackson Hole accelerated at the start of the past week. The Dollar Index fell to nearly 91.60 on August 29, a new low for the year. It staged a dramatic rebound. Of technical importance is the fact that the 50% retracement of the big rally since mid-2014 remained intact. It recovered to almost 93.35 in two sessions before meeting new sales. The whipsaw with the jobs/commentary double whammy took the Dollar Index from 92.60 to 92.10 and then 92.90. The technical indicators are mixed on the daily bar charts. The weeklies, the MACDs, and Slow Stochastics are poised to turn higher later this month, consistent with our expectation of a better Q4 for the greenback.
|
US Dollar Currency Index, September 2(see more posts on U.S. Dollar Index, )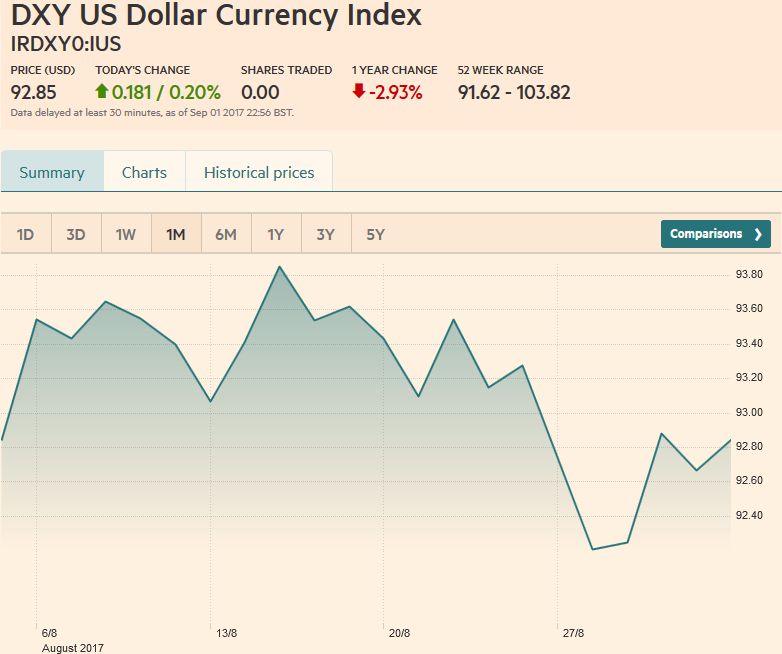 Source: markets.ft.com - Click to enlarge |
EUR/USDThe euro has risen for the past six months. Last week was only the third weekly loss here in Q3. Trend followers and momentum traders became cautious after the euro broke through the $1.20 level. Profit-taking took the euro toward an initial retracement target near $1.1820. It bounced to $1.1980 on the disappointing US jobs report, which is the 61.8% retracement of its pullback. The technical indicators are mixed, but on balance, given market positioning and the heightened risk of a disappointing ECB, we suspect the risk lies on the downside. The $1.1820 area offers initial support. It is also where the 20-day moving average can be found. A break could spur a move back into the $1.1650-$1.1700 area. |
EUR/USD with Technical Indicators, September 2(see more posts on Bollinger Bands, EUR/USD, MACDs Moving Average, RSI Relative Strength, Stochastics, )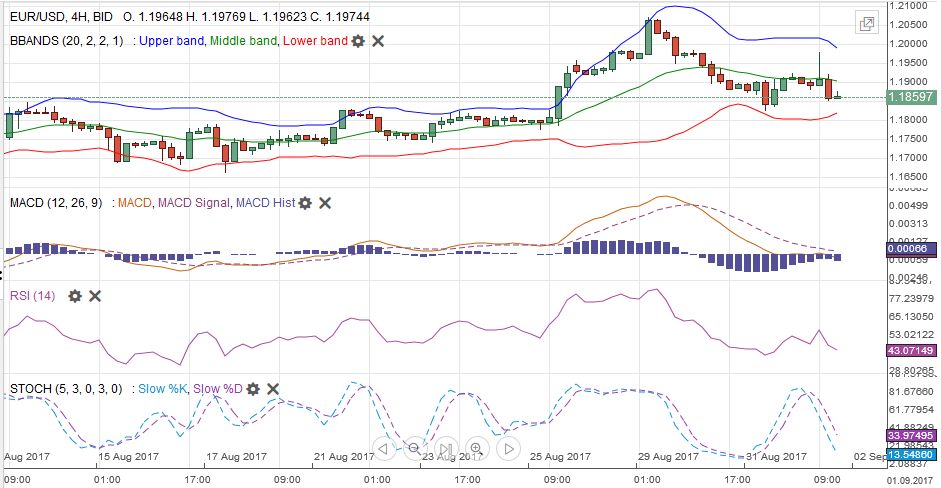 EUR/USD Week Ending September 02 with Technical Indicators - Click to enlarge |
USD/JPYThe dollar fell to four-month lows against the yen on August 29 near JPY108.25. It rebounded over a net couple of sessions to JPY110.65, a retracement level. While the dollar sold off in response to the jobs data, it held the JPY109.50 area that is itself a 50% retracement of its recovery. The MACDs and Slow Stochastics suggest the greenback can retest the JPY110.65-JPY111.00 area. The key may be US Treasuries, where the 10-year, which we will discuss shortly. Note though the JGB yield finished last week below zero for the first time since last November. |
USD/JPY with Technical Indicators, September 2(see more posts on Bollinger Bands, MACDs Moving Average, RSI Relative Strength, Stochastics, USD/JPY, )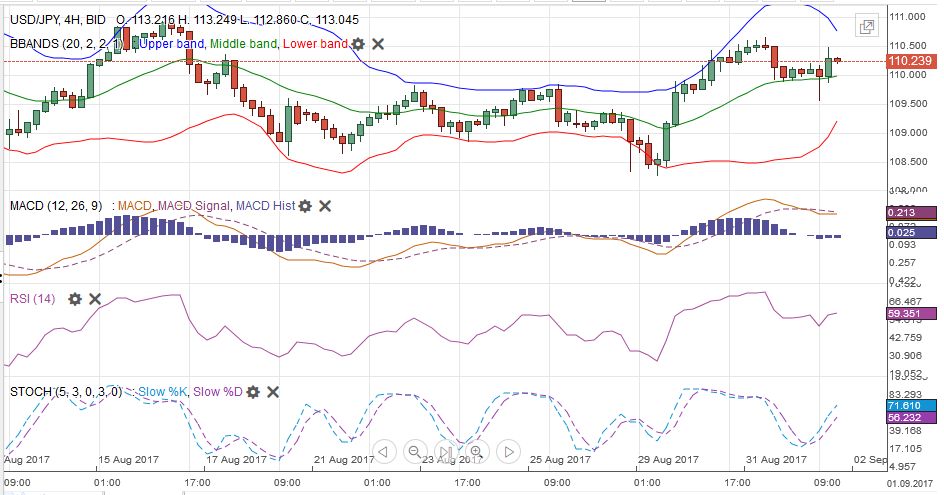 USD/JPY Week Ending September 02 with Technical Indicators - Click to enlarge |
GBP/USDLast week, we thought sterling was in a particularly good technical position. It gained about 0.35% last week, and, among the majors, trailing behind the Canadian and Australian dollars.
While there is a risk with the service sector PMI next week, and we are not particularly confident in the UK being able to negotiate a better economic deal with the EU than it already has, the technical indicators are supportive of additional sterling gains. Initial resistance is likely in the $1.3000-$1.3020 band, and then $1.3080.
Sterling is also looking a bit better on the cross (against the euro), though the euro bulls are still targeting parity. The euro was pulled back after peaking a little above GBP0.9300 on August 29. Before the weekend the euro tested the 20-day moving average at GBP0.9150 and met the 38.2% retracement (GBP0.9160) of the move that began with the key reversal on August 3 (~GBP0.8920). The technical indicators favor additional euro losses.
|
GBP/USD with Technical Indicators, September 2(see more posts on Bollinger Bands, GBP/USD, MACDs Moving Average, RSI Relative Strength, Stochastics, )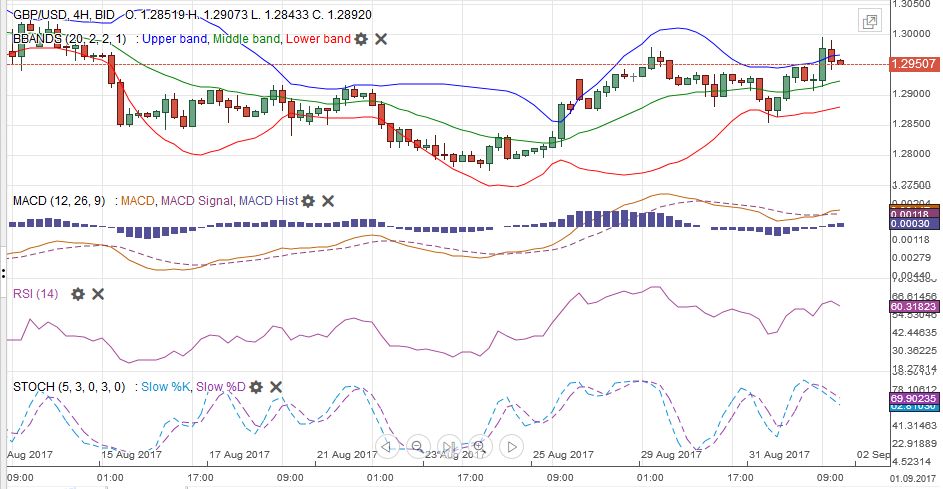 GBP/USD Week Ending September 02 with Technical Indicators - Click to enlarge |
AUD/USDThe Australian dollar is back knocking on the $0.8000 door, which if opens can see $0.8065, the two-year high set in July. A cent beyond that is the May 2015 high. The Reserve Bank of Australia meets. It is firmly on hold. It may protest the currency’s strength, which may also be a reflection of the losses the New Zealand dollar is suffering ahead of the election later this month (and the government is slipping behind in the latest polls). |
AUD/USD with Technical Indicators, September 2(see more posts on Australian Dollar, Bollinger Bands, MACDs Moving Average, RSI Relative Strength, Stochastics, )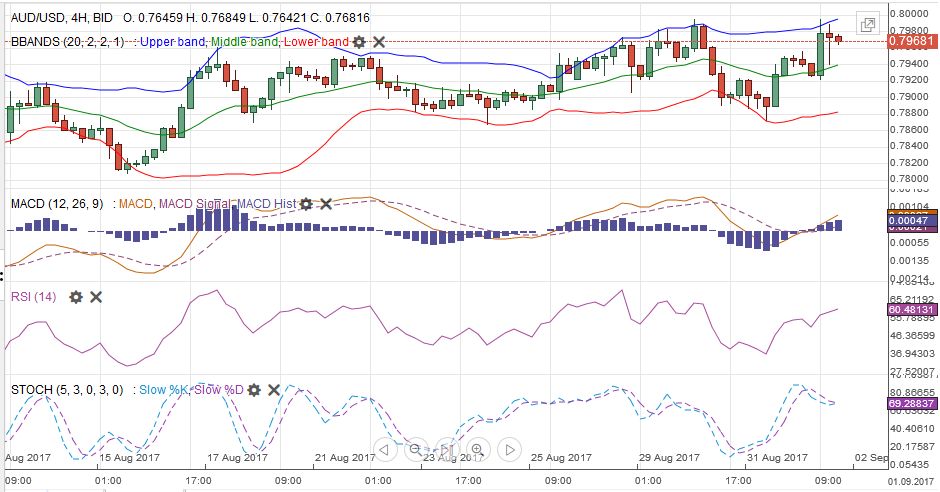 AUD/USD Week Ending September 02 with Technical Indicators - Click to enlarge |
USD/CADOne currency the was resilient in the face of the greenback’s recovery was the Canadian dollar. It was the strongest major currency before the weekend and for the week. The strong Q2 GDP report (4.5% annualized, 4.3% year-over-year) encouraged speculation that rather than wait for October, like many, including ourselves, expected, the Bank of Canada could hike rates again next week. The Canadian dollar rallied to new two-year highs against the US dollar before the weekend, as follow-through buying emerged following strong gains the day before that was fueled by the strong GDP report. The MACDs favor additional Canadian dollar gains, while the Slow Stochastics have turned down. Our concern is that if the Bank of Canada hikes on September 6 like many now expected, the Canadian dollar may sell-off when the fact is sold after the rumor bought. Alternatively, it may sell-off on disappointment the Bank does not hike. The US dollar did record an outside down week, and the break of CAD1.24 is technically important. If sustained, the next significant target may be closer to CAD1.2160. |
USD/CAD with Technical Indicators, September 2(see more posts on Bollinger Bands, Canadian Dollar, MACDs Moving Average, RSI Relative Strength, Stochastics, )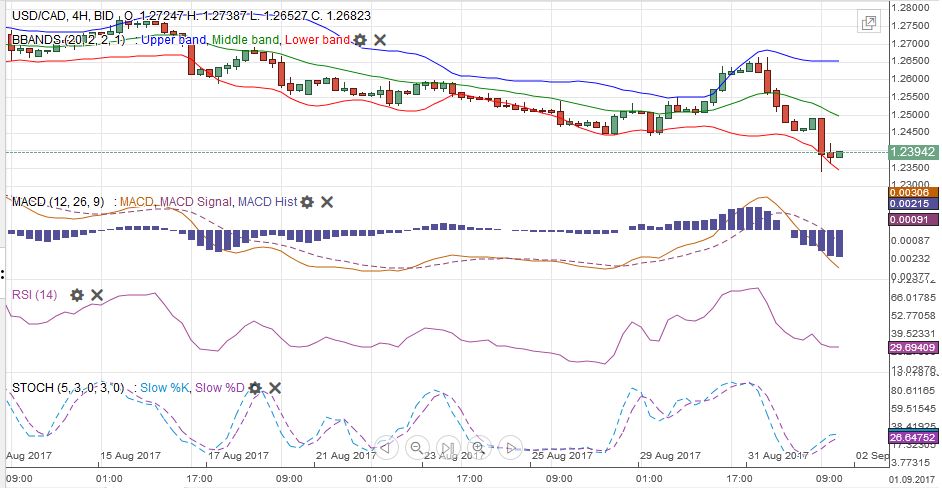 USD/CAD Week Ending September 02 with Technical Indicators - Click to enlarge |
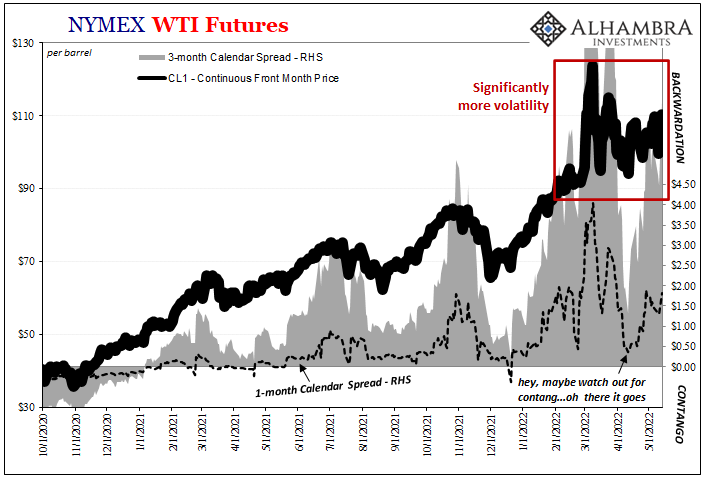
Crude OilThe Oct light sweet futures oil contract may have staged a potentially important upside reversal on the last day of August, but there was no follow-through buying ahead of the weekend. A move above $47.60 would violate the downtrend since downside reversal three weeks ago after it was bid through $50 a barrel. Still, resistance in the $48.00-$48.50 may be difficult to overcome initially. |
Crude Oil, September 2016 - September 2017(see more posts on Crude Oil, )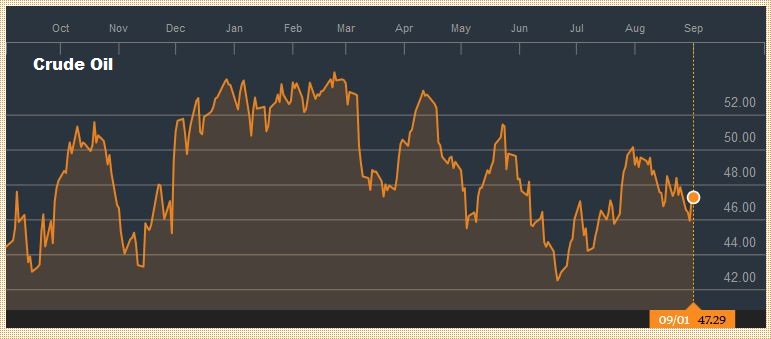 Source: bloomberg.com - Click to enlarge |
U.S. TreasuriesThe US 10-year yields briefly dipped to a new low for the year below the 2.10% floor seen in April. However, its recovery reinforced the sense the 2.10%-2.40% yield range since the end of Q1 remains intact. Near-term, it may struggle to get above 2.20%, which is where the 20-day average is found. The economic impact of the devastation in Texas is going to complicate the growth and price picture. Treasury Secretary Mnuchin seemed confident of a tax reform bill by the end of the month. The September note futures set contract highs last week before consolidating. The technical indicators are stretched but have not turned. A close below the 126-22 could be an early signal of a topping pattern. |
Yield US Treasuries 10 years, September 2016 - September 2017(see more posts on U.S. Treasuries, )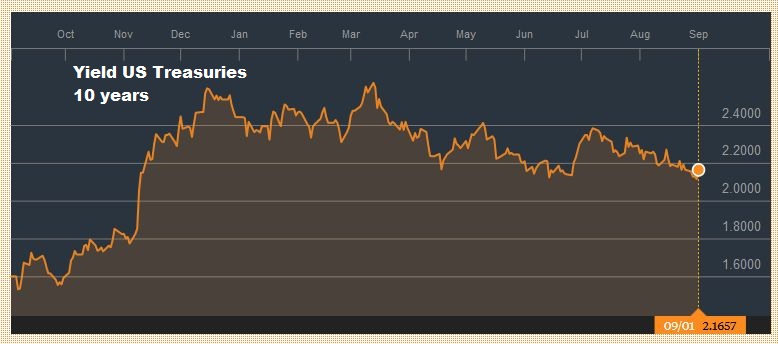 Source: bloomberg.com - Click to enlarge |
S&P 500 IndexThe S&P 500 had one of its best week’s of the year, rising almost 1.4%. It had risen every month beginning last November except for March when it lost less than 0.1%. It gapped higher in the last session of August and saw follow through buying, reaching a three-week high before the weekend (2480.4). The gap is found between 2460.3 and 2462.6. The technical indicators are supported suggesting another run at the record (almost 2491). The Russell 1000 Growth Index extended its streak to six sessions and finished last week with a little more than a 2% gain. It rose 1.65% in August. The only month it has fallen this year June (-0.4%). The Russell 1000 Value Index gained 0.8% last week, after falling 1.4% in August. It will begin next week with a three-day advance on the line. |
S&P 500 Index, September 2(see more posts on S&P 500 Index, )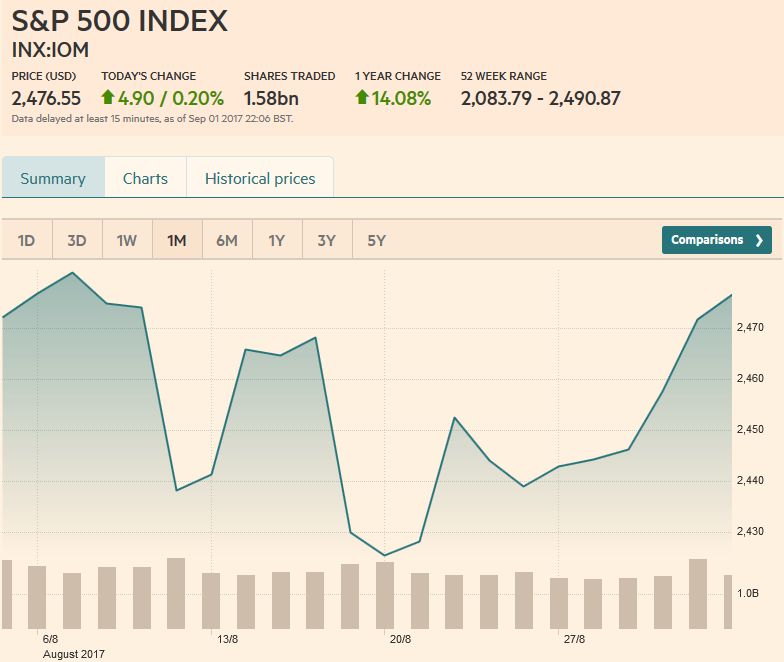 Source: markets.ft.com - Click to enlarge |
Are you the author?
Tags: Australian Dollar,Bollinger Bands,British Pound,Canadian Dollar,Crude Oil,EUR/CHF,EUR/USD,Euro,Euro Dollar,GBP/USD,Japanese yen,MACDs Moving Average,newslettersent,RSI Relative Strength,S&P 500 Index,Stochastics,Swiss Franc Index,U.S. Dollar Index,U.S. Treasuries,usd-jpy,USD/CHF,USD/JPY