George Dorgan
My articles My siteAbout meMy videosMy books
Follow on:LinkedINTwitterSeeking Alpha
CFA SocietyEconomicBlogs
Swiss Franc vs USD and EURBoth Swiss Franc and Euro were moving upwards against the dollar. So CHF gained 3% versus the dollar in the last month. The Euro is the strongest currency. CHF lost around 1.3% against the Euro.
|
EUR/CHF and USD/CHF, July 22(see more posts on EUR/CHF, USD/CHF, )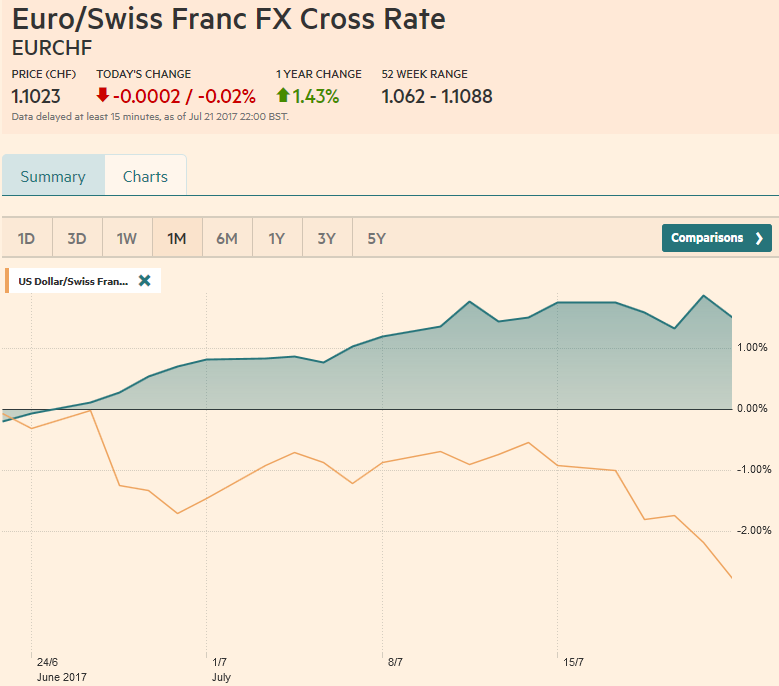 Source: markets.ft.com - Click to enlarge |
Swiss Franc Currency Index (3 years)The Swiss Franc index is the trade-weighted currency performance (see the currency basket)On a three years interval, the Swiss Franc had a weak performance. The dollar index was far stronger. The dollar makes up 33% of the SNB portfolio and 25% of Swiss exports (incl. countries like China or Arab countries that use the dollar for exchanges). Contrary to popular believe, the CHF index gained only 1.73% in 2015. It lost 9.52% in 2014, when the dollar (and yuan) strongly improved. |
Swiss Franc Currency Index (3 years), July 22(see more posts on Swiss Franc Index, )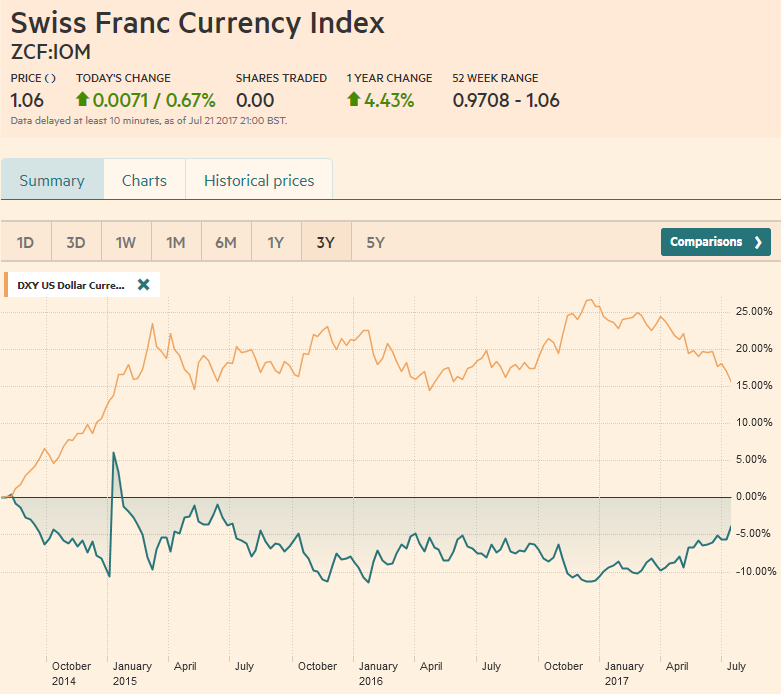 Source: markets.ft.com - Click to enlarge |
Marc Chandler My articles My offerMy siteAbout meMy videosMy books Follow on:LinkedINTwitterSeeking AlphaAmazon USD/CHF
The US dollar lost ground against all the major currencies, save sterling, over the past week, and also fell against most emerging market currencies. There is little from a technical or fundamental perspective, including next week’s FOMC meeting, that suggests a reversal is at hand. Investors accept that the US economy rebounded in Q2 from another below average Q1 performance. They accept that the jobs market is still healthy. What they doubt is that the Federal Reserve will raise interest rates in the face of price pressures that have moderated. The fiscal course of the Trump Administration is also doubted. Not to put too fine a point on it, but the mess over health care, has left investors with a bad taste of what the legislative meal will look like.
At the same time the trajectory of the US policy mix moves away from the very supportive tighter monetary/looser fiscal policy, negative considerations for Europe have been lifted or substantially reduced. Looking at the charts, the turn came in late April when it became clear the National Front challenge in was going to be repulsed. The political threat in Europe dissipated. The regional economy is enjoying the broadest and strongest expansion in a decade. Given the improvement in the balance of risk, the ECB began adjusting its communication to help prepare the markets for an adjustment in the accommodation. This spurred rise in market rates. |
US Dollar/Swiss Franc FX Spot Rate, July 22(see more posts on USD/CHF, ) Source: markets.ft.com - Click to enlarge |
US Dollar IndexThe Dollar Index fell for a second consecutive week. It has fallen in six of the past seven sessions. The week’s 1.25% decline took it blow 94.00, its lowest level since June 2016. This area is important from a technical perspective, and a convincing break could open the door to another 3-5% decline. Daily and weekly technical indicators are over-extended as one would imagine, but only the Slow Stochastics have stopped falling. Given the pace and extent of the Dollar Index slide, and the positioning, we want to be sensitive to any reversal pattern in the coming sessions, but our point is that there is not much nearby chart-based support. |
US Dollar Currency Index, July 22(see more posts on U.S. Dollar Index, )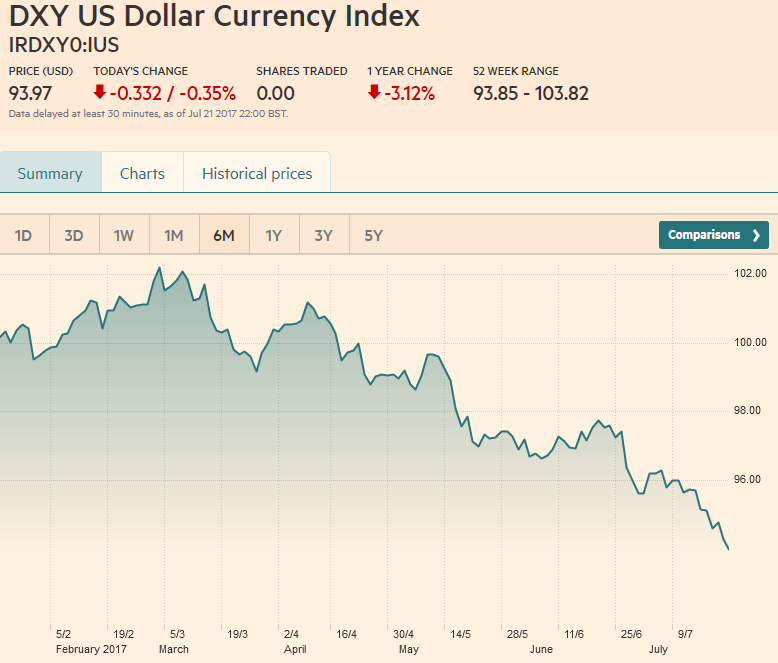 Source: markets.ft.com - Click to enlarge |
EUR/USDPullbacks in the euro are brief and shallow. Sentiment can drive it higher. Draghi’s acknowledgement of the euro’s appreciation was hardly a protest. A weaker dollar is unlikely to find objections in Washington, where the American First agenda is focused on reducing the trade deficit. Nor will the Fed be concerned about a weaker dollar, which might help them find the missing inflation. The path of least resistance is taking the euro higher. Last August’s $1.1715 high is the next interim target, which we are reminded, roughly corresponds to the 38.2% retracement of the euro’s depreciation since 2014 (~$1.1735). However, given the momentum, this hurdle will be overcome. Talking to various market participants, the euro could be on its way toward $1.20-$1.22.
The close before the weekend was strong, perhaps too strong; above the upper Bollinger Band (~$1.1640), but the seemingly one-way market means that buyers emerge on small setbacks.
|
EUR/USD with Technical Indicators, July 22(see more posts on Bollinger Bands, EUR/USD, MACDs Moving Average, RSI Relative Strength, Stochastics, )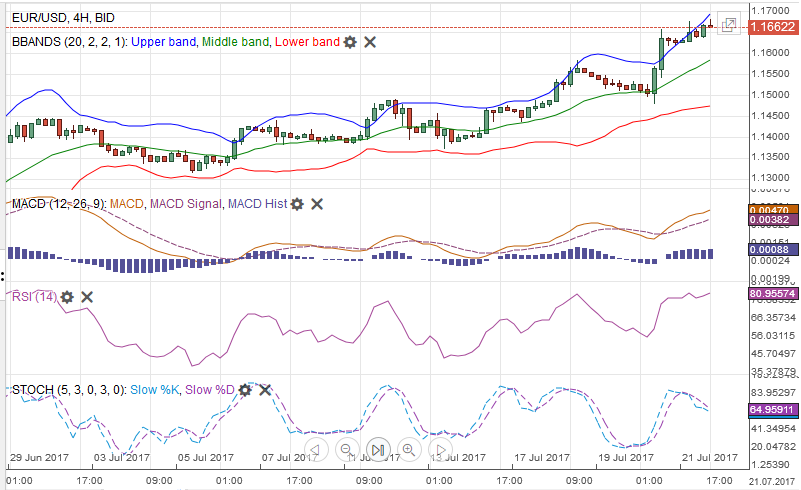 EUR/USD Week Ending July 22 with Technical Indicators - Click to enlarge |
USD/JPYThe drop in US and European yields, coupled with the broad dollar weakness, seemed to reanimate the yen. The dollar fell to JPY111.00, which is the 61.8% retracement objective of the rally from below JPY109 following the Fed’s mid-June rate hike. The close at the end of last week was poor, and below the lower Bollinger Band (~JPY111.20) to boot. In the middle of last week two sets of moving averages crossed over in a dollar-bearish direction. The five day moving average crossed below the 20-day average and the 50-day average fell below the 200-day average (also known as the Golden Cross or Dead Man’s Cross). The JPY110 area is important psychologically, but given that the move is about the dollar or euro rather than the yen, and the Trump Administration focus on trade and Japan’s strong export performance, Japanese officials may be loath to express concern about a strengthening yen.
|
USD/JPY with Technical Indicators, July 22(see more posts on Bollinger Bands, MACDs Moving Average, RSI Relative Strength, Stochastics, USD/JPY, )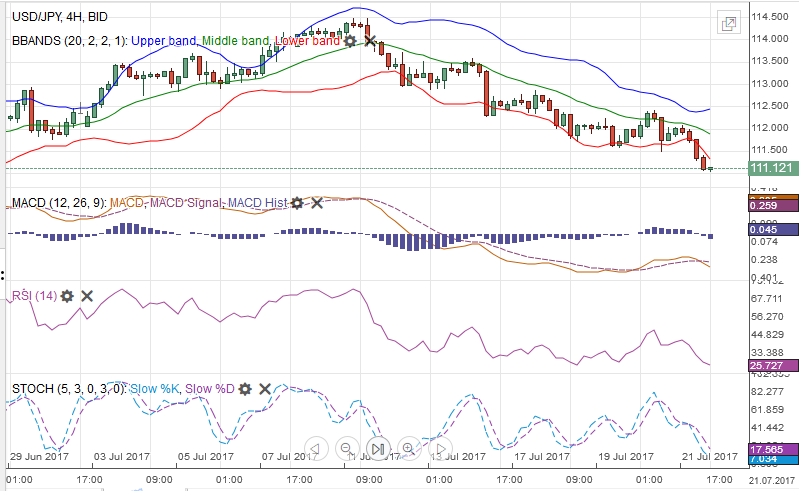 USD/JPY Week Ending July 22 with Technical Indicators - Click to enlarge |
GBP/USDSterling’s technical tone may not be as soft as the nearly Sterling is the only major currency that fell against the dollar last week. The market could not shake off the softer than expected inflation readings. The better retail sales figures were discounted as one-off seasonal clothing shopping. The implied yield of the December short-sterling futures contract eased by seven basis points last week. The comparable contract in EMU slipped 1.5 bp, while the yield on the December Eurodollar contract rose a single basis point. 0.8% decline against the dollar might suggest. The technical indicators are mixed and sterling held support seen near the 20-day moving average (~$1.2945), though the band of support extends toward $1.2920 and houses a month-long trend line and a retracement objective of the advance since earlier this month. Initial resistance is seen near the old $1.3055 area (38.2% retracement of the decline since the $1.50 level seen last year’s referendum day), though the recent highs were near $1.3125. |
GBP/USD with Technical Indicators, July 22(see more posts on Bollinger Bands, GBP/USD, MACDs Moving Average, RSI Relative Strength, Stochastics, ) GBP/USD Week Ending July 22 with Technical Indicators - Click to enlarge |
AUD/USDThe Australian dollar was pushed lower ahead of the week as profit-taking was seen ahead of the $0.8000 target, encouraged by central bank comments trying to ensure the market did not read the RBA hawkish. The Aussie still managed to hold on to a 1% gain for the week. It has risen in nine of the past 11 sessions, and those two losing sessions provided the bookends for the week. Provided the $0.7860-$0.7875 area holds, a consolidative phase need not morph into an outright correction. |
AUD/USD with Technical Indicators, July 22(see more posts on Australian Dollar, Bollinger Bands, MACDs Moving Average, RSI Relative Strength, Stochastics, )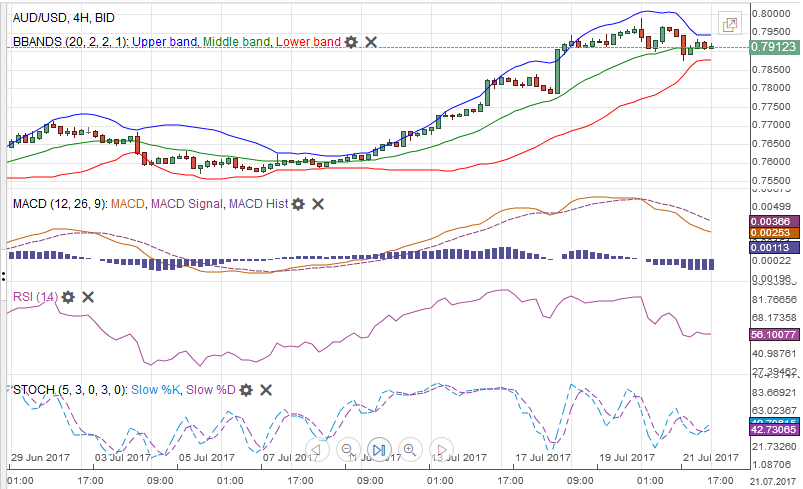 AUD/USD Week Ending July 22 with Technical Indicators - Click to enlarge |
USD/CADThe dollar-bloc is participating, even if not leading in the current move against the US dollar. The Canadian dollar finished the week with a four-session advancing streak. It has gained in seven of the last eight sessions and has risen against the US dollar for the fourth consecutive week. The US dollar is approaching the CAD1.25 objective. A convincing break signals potential toward CAD1.2150. With the recent rate hike, and the preparations for the NAFTA renegotiation’s, the risk of verbal complaints of the Canadian dollar’s appreciation is very low. |
USD/CAD with Technical Indicators, July 22(see more posts on Bollinger Bands, Canadian Dollar, MACDs Moving Average, RSI Relative Strength, Stochastics, )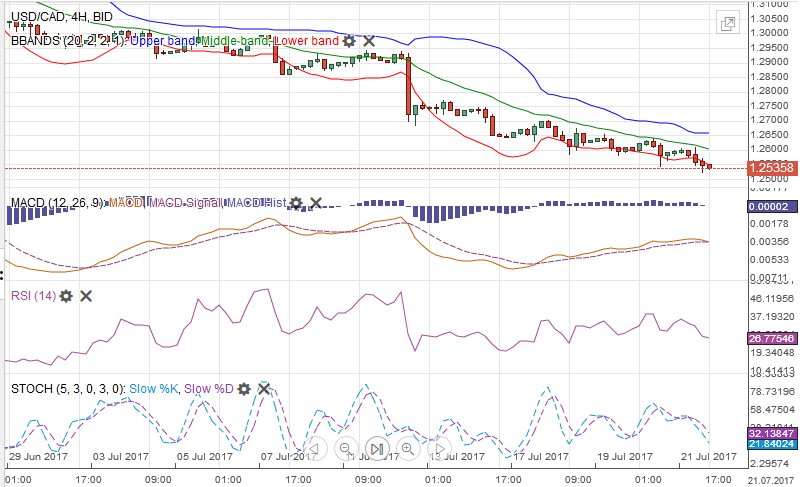 USD/CAD Week Ending July 22 with Technical Indicators - Click to enlarge |
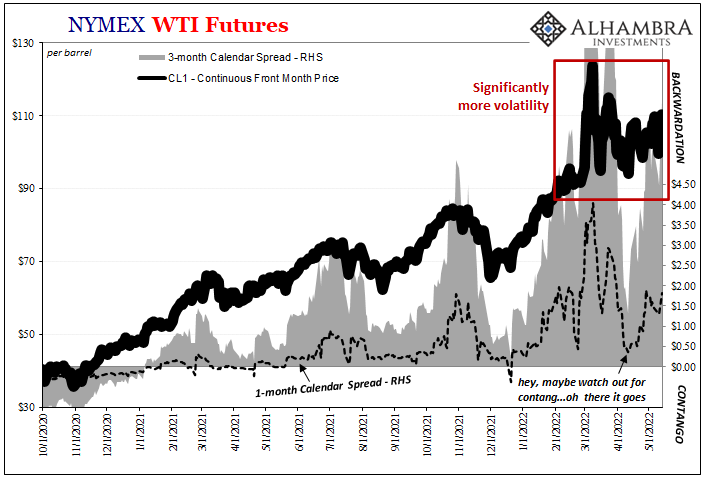
Crude OilThe nearly 2.6% drop in the price of the September light sweet crude oil futures contract ahead of the weekend ensured a weekly decline. The contract was turned back from the same area near $47 that capped it earlier this month. Private estimates suggest OPEC output hit the highs for the year this month. Investors are skeptical that the monitoring meeting on July 24 will generate caps for Libyan and Nigerian output. Several technical level converge in the $45.30-$45.60 band, that was entered before the weekend. Support there which stands in the way of a return to $44. |
Crude Oil, July 2016 - July 2017(see more posts on Crude Oil, )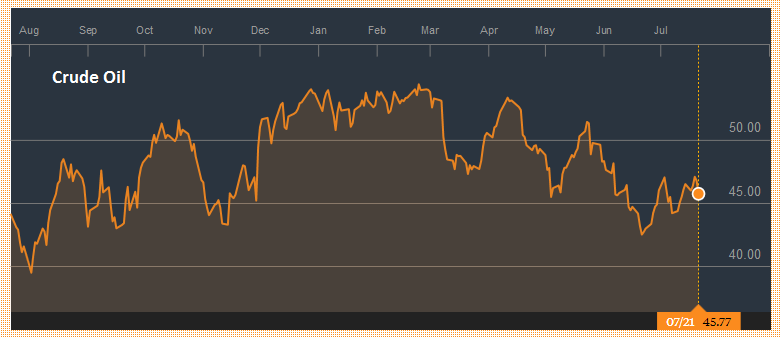 Source: bloomberg.com - Click to enlarge |
U.S. TreasuriesThe US 10-year yield fell nearly 10 basis points last week. That is the largest decline in three months, and it puts the yield at 2.23%, its lowest since late June. It finished the week on its lows, just below the midpoint of the 2.10%-2.40% range. The technical tone of the September note futures contract is favorable and a return to the contract high (127-08) from mid-June looks likely. Nearby support is just below 126-00. |
Yield US Treasuries 10 years, July 2016 - July 2017(see more posts on U.S. Treasuries, )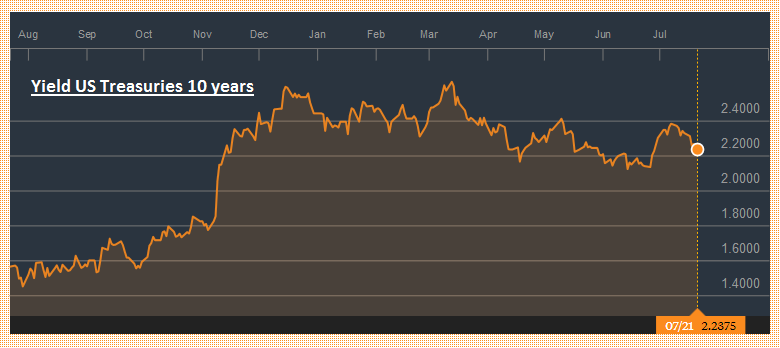 Source: bloomberg.com - Click to enlarge |
S&P 500 IndexUS equities continued their advance, though prices dipped before the weekend. The small loss in the NASDAQ at the end of the week sufficed to snap a ten-session winning streak. It was the third consecutive weekly advance. The S&P 500 also rose for the third week and has risen five of the past six sessions. The S&P 500 gapped higher on Wednesday July 20 like it did a week prior on July 13. Neither gap has been closed. Despite the minor loss ahead of the weekend the close was on the highs of the session that were recorded into the close. One fund manager we talk to described the recent price action as participants getting stopped into positions. The technical indicators warn of increasing risk of a near-term setback, but as we suggested with the euro, pullbacks have been short and shallow. |
S&P 500 Index, July 22(see more posts on S&P 500 Index, )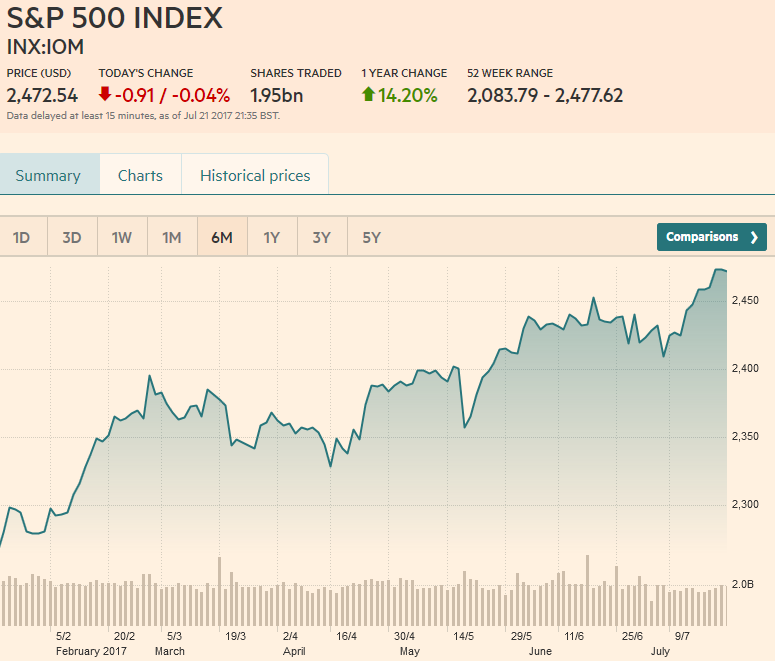 Source: markets.ft.com - Click to enlarge |
Are you the author?
Tags: Australian Dollar,Bollinger Bands,British Pound,Canadian Dollar,Crude Oil,EUR/CHF,EUR/USD,Euro,Euro Dollar,GBP/USD,Japanese yen,MACDs Moving Average,newslettersent,RSI Relative Strength,S&P 500 Index,Stochastics,Swiss Franc Index,U.S. Dollar Index,U.S. Treasuries,usd-jpy,USD/CHF,USD/JPY