George Dorgan
My articles My siteAbout meMy videosMy books
Follow on:LinkedINTwitterSeeking Alpha
CFA SocietyEconomicBlogs
Swiss Franc vs USD and EURThe Euro remained the strongest among EUR, CHF and USD during the last month. The Swiss lost against EUR 1.5%, while it gained versus the dollar 0.75%. |
EUR/CHF and USD/CHF, July 15(see more posts on EUR/CHF, USD/CHF, )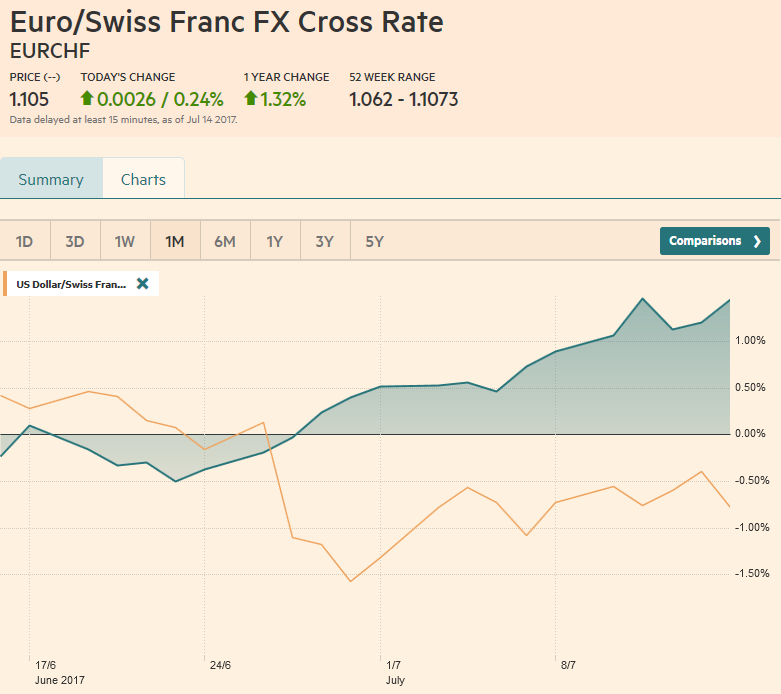 Source: markets.ft.com - Click to enlarge |
Swiss Franc Currency Index (3 years)The Swiss Franc index is the trade-weighted currency performance (see the currency basket)On a three years interval, the Swiss Franc had a weak performance. The dollar index was far stronger. The dollar makes up 33% of the SNB portfolio and 25% of Swiss exports (incl. countries like China or Arab countries that use the dollar for exchanges). Contrary to popular believe, the CHF index gained only 1.73% in 2015. It lost 9.52% in 2014, when the dollar (and yuan) strongly improved. |
Swiss Franc Currency Index (3 years), July 15(see more posts on Swiss Franc Index, )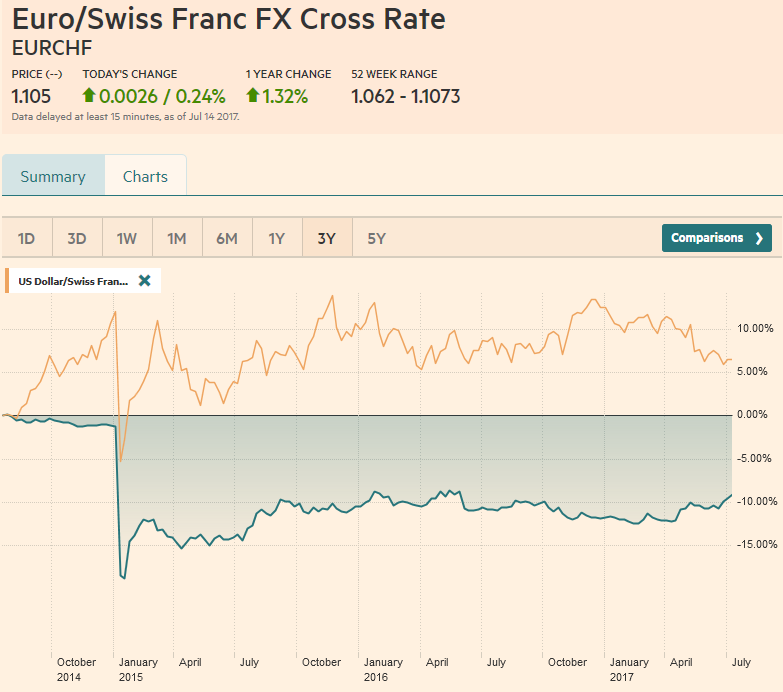 Source: markets.ft.com - Click to enlarge |
Marc Chandler My articles My offerMy siteAbout meMy videosMy books Follow on:LinkedINTwitterSeeking AlphaAmazon USD/CHFThere were some technical indicators that suggested there was an opportunity for the US dollar to stage a recovery. However, the poor retail sales data and lack of upside surprise on CPI closed that window of opportunity and left the dollar vulnerable to losses to start the new week. Although June inflation and consumption data are unlikely to have much weight in the Fed’s decision in September, the market’s reaction was to take US rates lower and reduced the perceived chances of another rate hike this year. The implied yield on the December Fed funds futures contract fell to its lowest level in nearly a month (1.225% vs. the current effective rate of 1.16%). The relatively light US economic calendar next week means that there may not be data of sufficient gravitas to negate the sense that the US economy is stuck in a low gear. |
US Dollar/Swiss Franc FX Spot Rate, July 15(see more posts on USD/CHF, )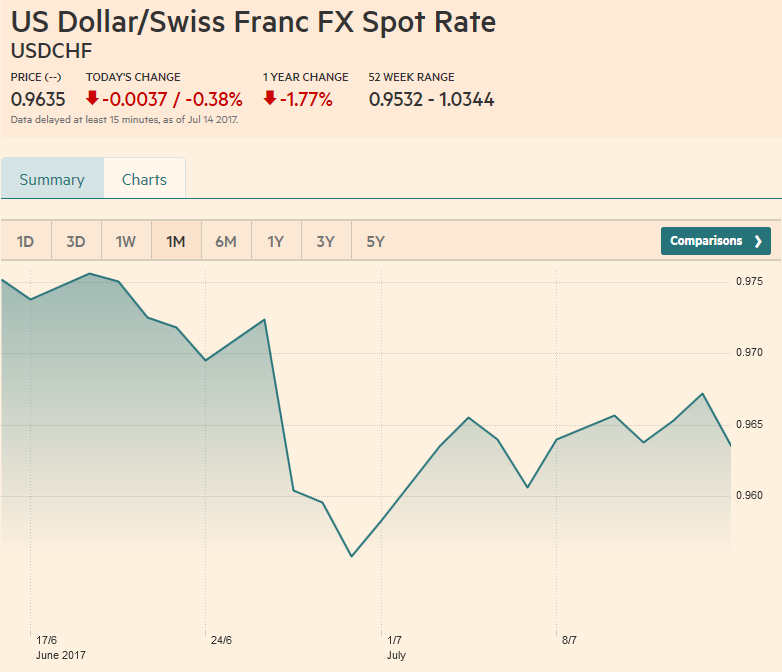 Source: markets.ft.com - Click to enlarge |
US Dollar IndexThe Dollar Index finished the week at its lowest level since last October. The possible double bottom pattern thathad appeared to be forming was dashed as it did not rise above the neckline before breaking down to new lows. Support near 95.00 is mild but is stronger closer to 94.00. The poor close warns of a gap lower opening in Asia on Monday. A move above 96.20 is needed to suggest a bottom is in place. The Dollar Index has been alternating between weekly gains and losses since the beginning of May. The pattern is at risk if it cannot advance next week. Given the light US economic calendar, its fate may be in the hands of ECB President Draghi who holds his customary press conference after the central bank meeting. |
US Dollar Currency Index, July 15(see more posts on U.S. Dollar Index, )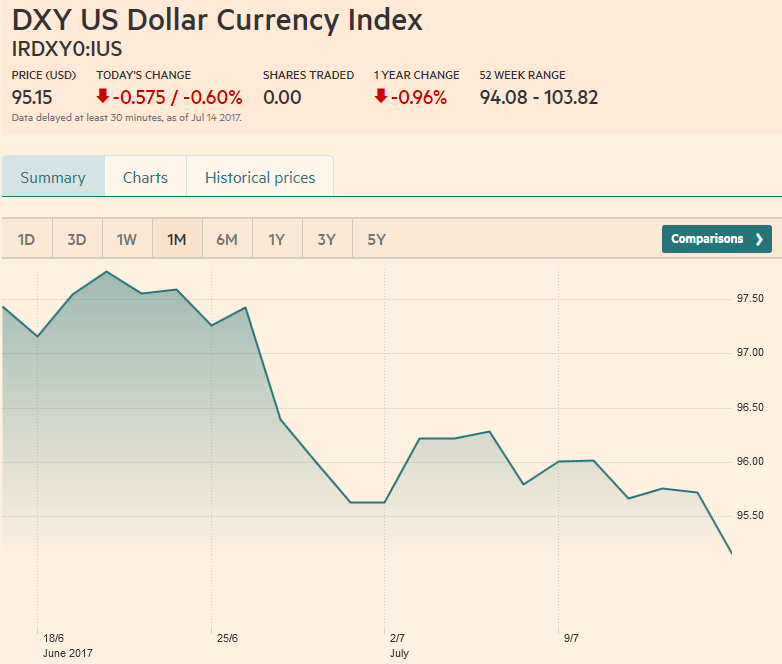 Source: markets.ft.com - Click to enlarge |
EUR/USDThe euro made the high for the year just below $1.1490 in the middle of last week. The technical indicators are mixed as the euro has been straddling the $1.1400 level for two weeks in mostly tight ranges. Last years high was set near $1.1615, and this represents the next target. The 2017 high was a cent higher. There is the talk of leveraged accounts buys $1.20 strikes. |
EUR/USD with Technical Indicators, July 15(see more posts on Bollinger Bands, EUR/USD, MACDs Moving Average, RSI Relative Strength, Stochastics, )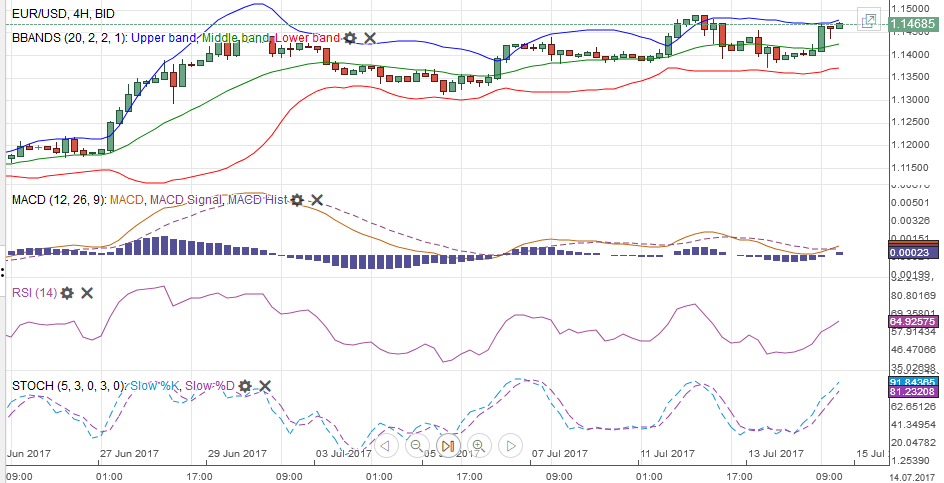 EUR/USD Week Ending July 15 with Technical Indicators - Click to enlarge |
USD/JPYThe pullback in US rates may have been the spur that snapped a four-week dollar advancing streak against the Japanese yen. The greenback’s slide in after reaching almost JPY114.50 on July 11, met the 38.2% retracement target (of the advance from the June 14 low near JPY108.85) that is found near JPY113.35. The 50% retracement comes in around JPY111.65. The technical indicators seem to be generating powerful signals warning that the downside may be greater. The euro reached almost JPY130.80 on July 11 and finished the week below JPY129. The technicals look poor too, and the initial target may be JPY127.50-JPY128.00. After testing $1.28 at midweek on the back of Deputy Governor Broadbent aligning more with Governor Carney who is reluctant to raise rates now than the dissenting hawks, sterling finished the week at new highs for the year. It surpassed the 38.2% retracement of the losses suffered since the $1.50 level was seen last year on the day of the referendum. The 50% retracement is $1.3430. Sterling recorded an outside up week. We see initial potential toward $1.3250 next week. |
USD/JPY with Technical Indicators, July 15(see more posts on Bollinger Bands, MACDs Moving Average, RSI Relative Strength, Stochastics, USD/JPY, )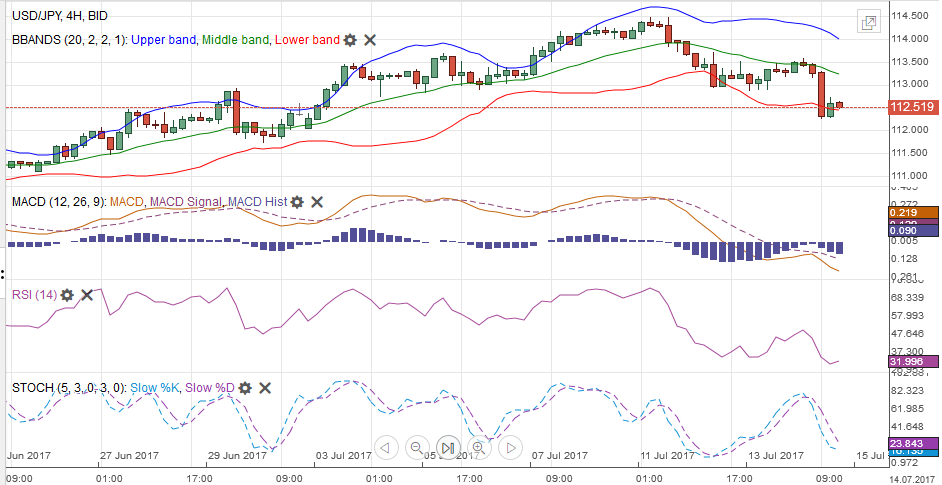 USD/JPY Week Ending July 15 with Technical Indicators - Click to enlarge |
GBP/USDWe had seen sterling strength as largely a function of the weaker US dollar, but recognize that it has recovered smartly against the euro since the middle of last week. The euro approached GBP0.8950, but then reversed course and finished the week near GBP0.8760. We have suggested a break of GBP0.8750 would signal a test on GBP0.8700. A more serious test for euro is last month’s low near GBP0.8650, which corresponds to a 50% retracement of the euro’s rally since the May 10 low below GBP0.8400. |
GBP/USD with Technical Indicators, July 15(see more posts on Bollinger Bands, GBP/USD, MACDs Moving Average, RSI Relative Strength, Stochastics, )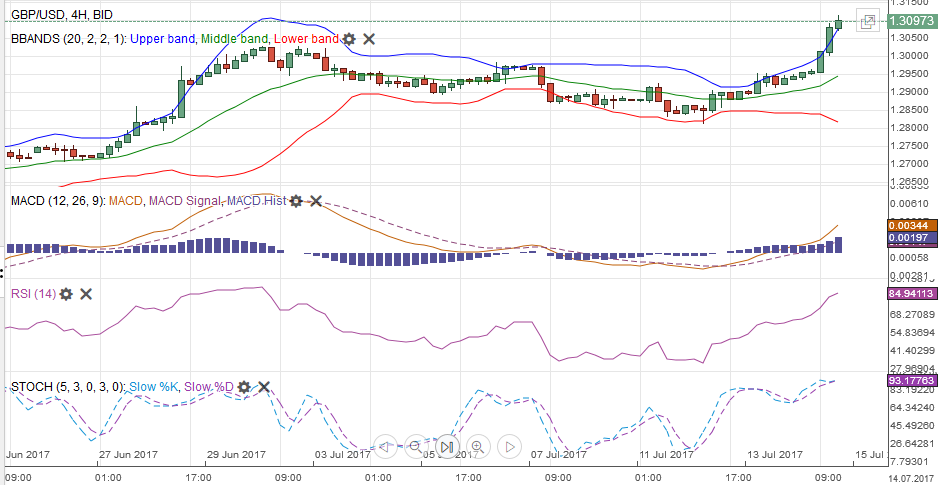 GBP/USD Week Ending July 15 with Technical Indicators - Click to enlarge |
AUD/USDThe Australian dollar appreciated every day week and gained 2.8% against the US dollar. The rally carried the Aussie to its best level since April 2016. A move now above $0.7850 would encourage participants to set their sights on the $0.8000 and possibly the 2015 high near $0.8165. The rally in recent days has been strong, and the closes have been near session highs. The technical indicators warn against fading the powerful momentum. In a previous note, we pointed out a bottoming pattern in the Australian dollar against the New Zealand dollar. The pattern appears to have been confirmed, and the initial target is near NZD1.0750. Given the position of the technical indicators, this initial target, which corresponds with a 61.8% retracement of the decline since mid-March, can be overshot and a move toward NZD1.0800-NZD1.0850 may be reasonable. |
AUD/USD with Technical Indicators, July 15(see more posts on Australian Dollar, Bollinger Bands, MACDs Moving Average, RSI Relative Strength, Stochastics, )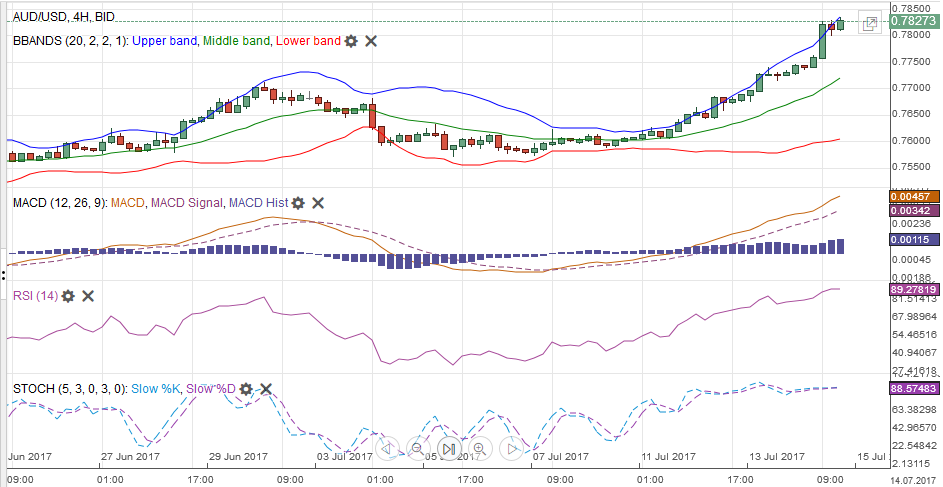 AUD/USD Week Ending July 15 with Technical Indicators - Click to enlarge |
USD/CADThe Canadian dollar performed well last week, gaining 1.6% against the US dollar. It was the third consecutive weekly loss for the dollar and the fifth decline in the past six weeks. The Canadian dollar was helped by the rate hike, softer US rates, and higher oil prices. Technical indicators are getting stretched, but only the Slow Stochastics look set to cross higher. Canada reports June CPI figures next week, and the base effect warns of reduced price pressures. However, the US dollar does not see support until closer to CAD1.25. |
USD/CAD with Technical Indicators, July 15(see more posts on Bollinger Bands, Canadian Dollar, MACDs Moving Average, RSI Relative Strength, Stochastics, )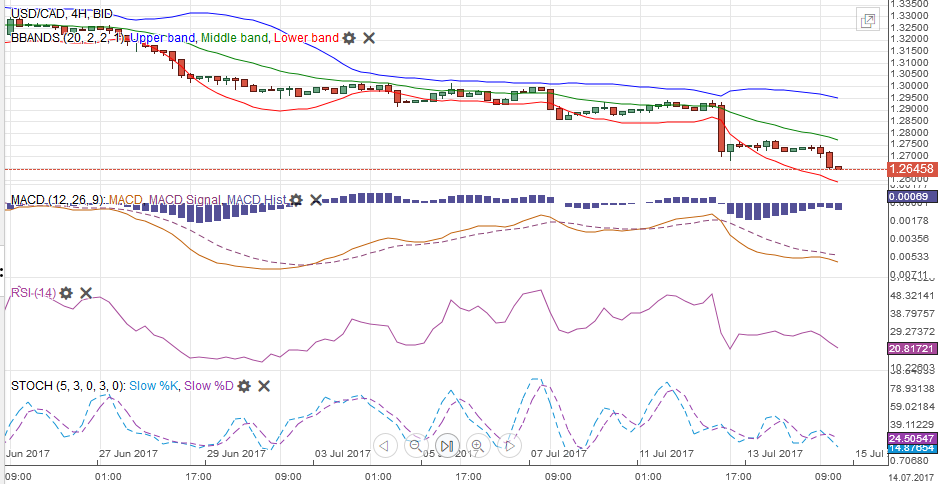 USD/CAD Week Ending July 15 with Technical Indicators - Click to enlarge |
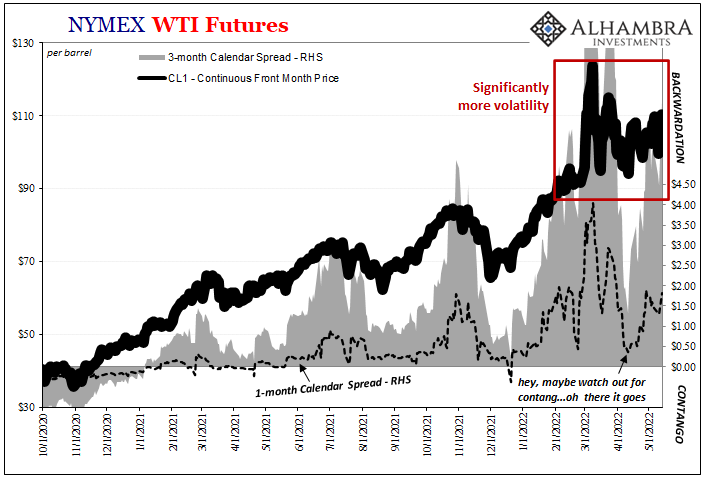
Crude OilThe August light sweet crude oil futures contract rallied every day last week. The near-term technical outlook is constructive, and we see scope toward $47.30-$48.50. OPEC’s monitoring committee meets on July 24 and pressure is mounting for Libya and Nigeria to participate in some output restraint going forward given the levels of output reached in Q2. On the downside, initial support is seen in the $44.50-$45.00. |
Crude Oil, July 2016 - July 2017(see more posts on Crude Oil, )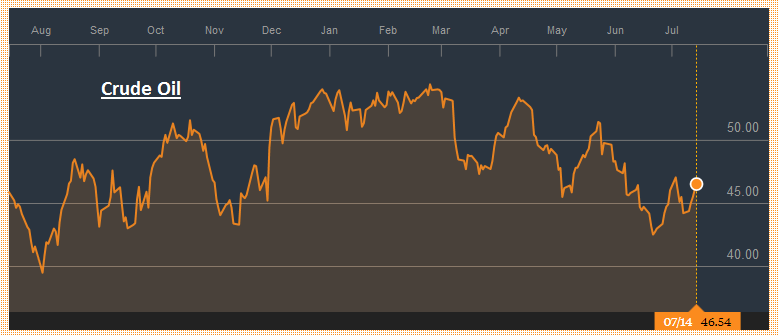 Source: bloomber.com - Click to enlarge |
U.S. TreasuriesThe 2.40% level proved to be formidable a cap on the US 10-year yield, and even before the soft retail sales and as-expected CPI, the interest rate was slipping. A break of the 2.20%-2.25% band would be seen as a likely signal a return toward the low from late June near 2.12%. The September note futures contract rallied before the weekend and met to the tick the 50% retracement of the decline from the June 14 high (127-08). The 61.8% retracement is at 126-10, which is the next immediate target. The technical indicators are aligned and favor the upside. |
Yield US Treasuries 10 years, July 2016 - July 2017(see more posts on U.S. Treasuries, )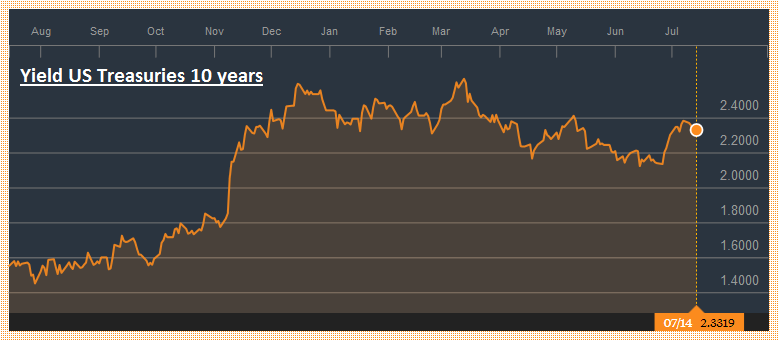 Source: bloomberg.com - Click to enlarge |
S&P 500 IndexThe S&P 500 gapped higher in the middle of the week and set a new record high before the weekend. The gap has not been entered, let alone closed, and is found between 2429.3 to 2435.75. While the gap may be a force to attract prices, the momentum indicators are strong and favor additional near-term gains. The earnings season has already begun but picks up in the week ahead. There was disappointment over the bank earnings reports, and ahead of the weekend, and financials were the only sector to lost ground (~0.5%). For the first time in a month, both the Russell Value and Russell Growth Indices advanced last week (0.75% and 2.1% respectively). |
S&P 500 Index, July 15(see more posts on S&P 500 Index, )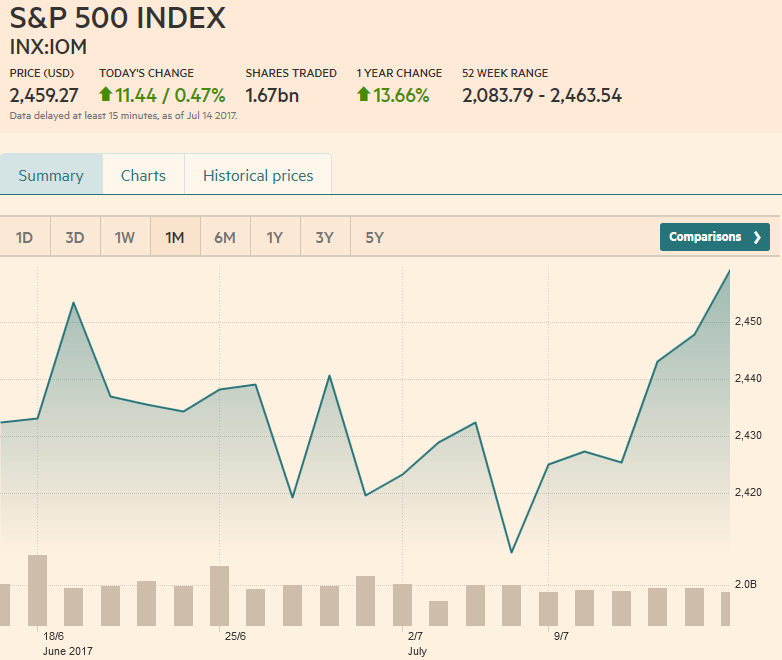 Source: markets.ft.com - Click to enlarge |
Are you the author?
Tags: Australian Dollar,Bollinger Bands,British Pound,Canadian Dollar,Crude Oil,EUR/CHF,EUR/USD,Euro,Euro Dollar,GBP/USD,Japanese yen,MACDs Moving Average,newslettersent,RSI Relative Strength,S&P 500 Index,Stochastics,Swiss Franc Index,U.S. Dollar Index,U.S. Treasuries,usd-jpy,USD/CHF,USD/JPY