Marc Chandler
My articles My offerMy siteAbout meMy videosMy books
Follow on:LinkedINTwitterSeeking AlphaAmazon
George Dorgan
My articles My siteAbout meMy videosMy books
Follow on:LinkedINTwitterSeeking Alpha
CFA SocietyEconomicBlogs
Summary:
- Australian dollar has advanced for three days.
- Technicals are constructive.
- Aussie looks particularly attractive vs. New Zealand dollar.
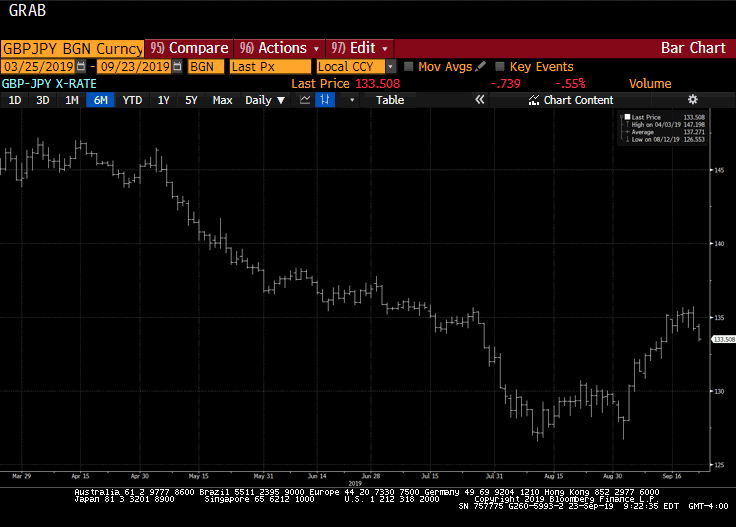
| This Great Graphic, made on Bloomberg, depicts the Australian dollar since April 2016. We drew in the trendline from that April high, through the November high and the March 2017 high. It nearly catches last month’s high as well. It comes in now near $0.7725.
The technical tone is favorable with the RSI turning up, and the MACDs appear poised to cross higher, though not from oversold territory. The Slow Stochastics have turned down. On the daily bar charts, the Australian dollar broke out of a small triangle pattern to the upside. The triangle pattern is most often thought of as a continuation pattern, but this breakout was in the opposite direction. In fairness triangles sometimes have false breaks, but this one looks real. Unlike the Bank of Canada, which is widely expected to raise rates tomorrow, the Reserve Bank of Australia is not signaling a rate hike any time soon, and there are still many who think the next move can still be a cut. Although Australia reports consumer confidence and credit card use tomorrow, Thursday’s consumer inflation expectations for July may be more important. Inflation expectations began the year at 4.3%, the highest since May 2014. However, by June it had fallen to 3.6%, which is near last year’s average expectation. A further fall could weigh on the Australian dollar. The Aussie also looks attractive from a technical vantage point against the New Zealand dollar. It appears to be breaking out of a head and shoulders bottoming pattern and the technical indicators are showing bullish divergences with prices. A move above NZD1.06 can see NZD1.0750 (retracement objective and measuring objective of head and shoulders pattern). |
Australian Dollar, April 2016 - July 2017(see more posts on Australian Dollar, )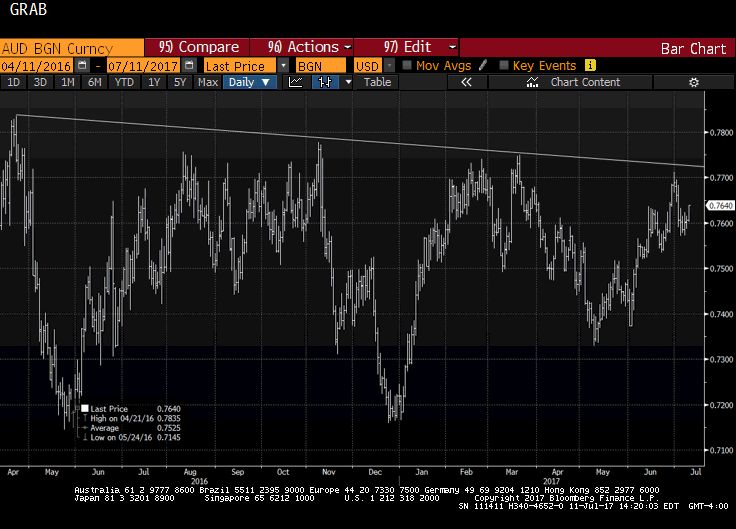 - Click to enlarge |
Full story here Are you the author?
Tags: $AUD,Australian Dollar,Great Graphic,newslettersent,NZD