


George Dorgan
My articles My siteAbout meMy videosMy books
Follow on:LinkedINTwitterSeeking Alpha
CFA SocietyEconomicBlogs
Swiss Franc vs USD and EURWhile the Euro traded in the range between 1.08 and 1.09, the dollar declined by nearly 3%. |
EUR/CHF and USD/CHF, June 03(see more posts on EUR/CHF, USD/CHF, )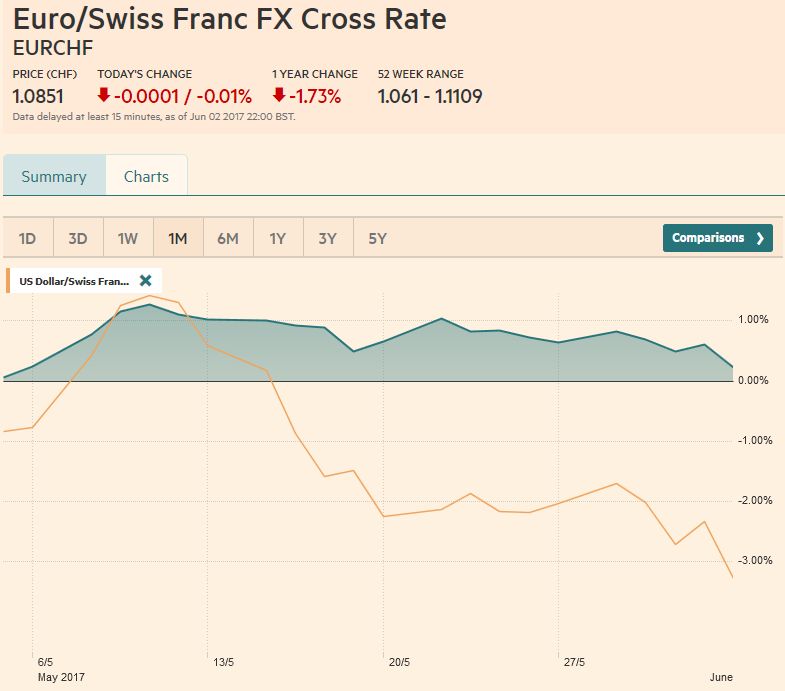 The picture shows that FX traders went long EUR against CHF. Source: markets.ft.com - Click to enlarge |
Swiss Franc Currency Index (3 years)The Swiss Franc index is the trade-weighted currency performance (see the currency basket)On a three years interval, the Swiss Franc had a weak performance. The dollar index was far stronger. The dollar makes up 33% of the SNB portfolio and 25% of Swiss exports (incl. countries like China or Arab countries that use the dollar for exchanges). Contrary to popular believe, the CHF index gained only 1.73% in 2015. It lost 9.52% in 2014, when the dollar (and yuan) strongly improved. |
Swiss Franc Currency Index (3 years), June 03(see more posts on Swiss Franc Index, ) Source: markets.ft.com - Click to enlarge |
Marc Chandler My articles My offerMy siteAbout meMy videosMy books Follow on:LinkedINTwitterSeeking AlphaAmazon USD/CHFThe technical indicators warn that the US dollar is stretched, but the combination of disappointing auto sales and jobs report may deny it the interest rate support needed to facilitate a resumption of the bull market. While there are many observers talking about the abdication of the US from its global leadership role given the decision to pull out of the Paris Accord and the TPP, we think the dollar’s performance can be explained by changing perceptions about the pace of US economic activity, the direction of inflation, and prospects for significant tax reform and infrastructure spending.
There is a light US economic calendar in the week ahead, and the quiet period ahead of the June 13-14 FOMC meeting means that investors are unlikely to get much guidance from officials. The focus will be squarely on Europe with the ECB meeting and the UK election.
|
US Dollar/Swiss Franc FX Spot Rate, June 03(see more posts on USD/CHF, )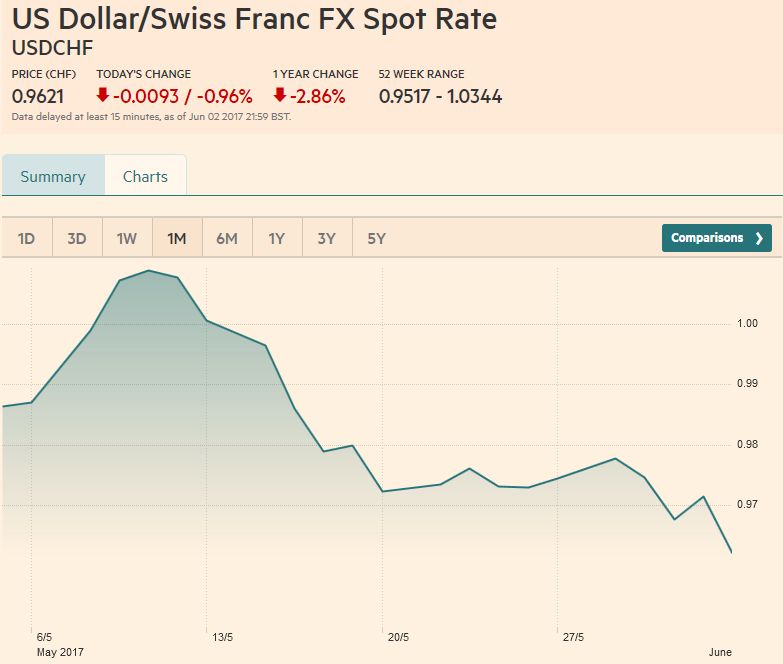 Source: markets.ft.com - Click to enlarge |
US Dollar Index
The Dollar Index finished the week at new lows for the year, and just above the 61.8% retracement objective of the rally from the lows seen in May last year (96.45). A convincing break brings two technical levels into view. The first is around 95.20. It is a measuring objective of the old head and shoulder pattern that had been formed between December 2016 and March 2017. The second is near 94.20. It is the 38.2% retracement objective of the Dollar Index’s 2012-2014 lows near 78.60.
|
US Dollar Currency Index, June 03(see more posts on US Dollar Index, ) Source: markets.ft.com - Click to enlarge |
EUR/USDThe euro appreciated for the sixth week of the past eight. Nearly three-quarters of the 0.7% gain on the week were scored on the back of the disappointing US jobs report. Before the weekend, it posted its highest close since last September, as works its way closer to the spike high last November ($1.13). The strength of the close warns of risk of a gap higher opening in Asia on June 5. Given the proximity of $1.1300, current volatility, and momentum, an upside break cannot be ruled out. A break of $1.1300 could signal a move to $1.1400-$1.1425.
|
EUR/USD with Technical Indicators, June 03(see more posts on Bollinger Bands, EUR/USD, MACDs Moving Average, RSI Relative Strength, Stochastics, )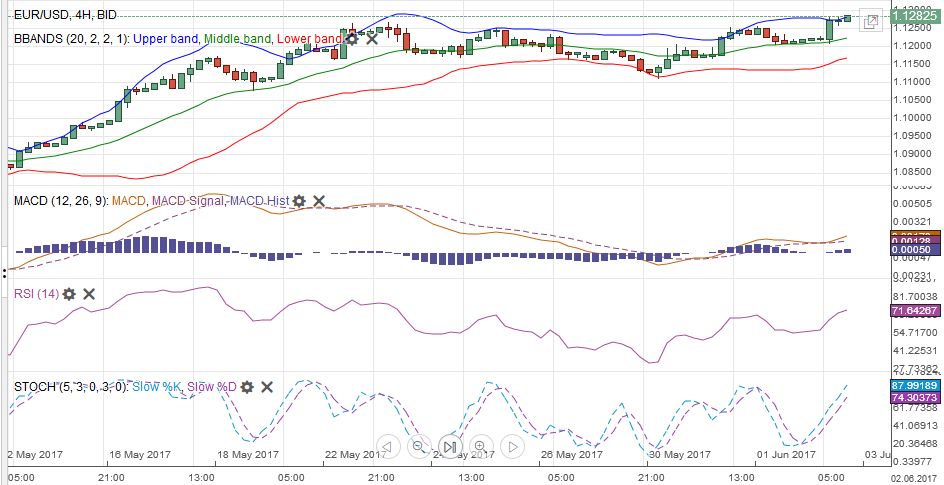 EUR/USD Week Ending June 03 with Technical Indicators - Click to enlarge |
USD/JPYThe dollar has fallen against the yen for five of the last six sessions. Before the weekend, it was trading on either side of the previous day’s range (outside day) and closed below the previous day’s low. Indeed, the early in the session it made a new high for the week. Then in response to the jobs’ disappointment, it made a new low for the week. Support is expected in front of JPY110, and a break could see JPY109.40-JPY109.60. However, if US yields do not find better traction, a return to the JPY108 area seen in mid-April is possible. |
USD/JPY with Technical Indicators, June 03(see more posts on Bollinger Bands, MACDs Moving Average, RSI Relative Strength, Stochastics, USD/JPY, )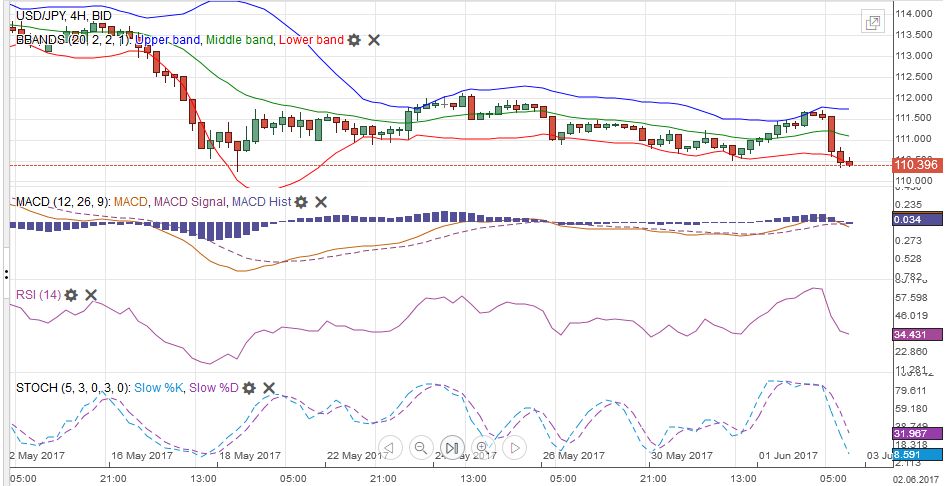 USD/JPY Week Ending June 03 with Technical Indicators - Click to enlarge |
GBP/USDSterling was range-bound last week (~$1.2770 to $1.2920). The outside up day posted in the middle of the week did not see follow-through buying, but rather back-to-back inside days. The technical indicators look constructive, but that may be a reflection of a heavy dollar. Sterling continues to trade heavily against the euro. It fell on the cross for the sixth consecutive week. The euro look to be headed into the GBP0.8800-GBP0.8850 area that marked the highs in mid-January and mid-March. Against the dollar, the $1.3000-$1.3055 needs to be overcome to be anything technically significant.
|
GBP/USD with Technical Indicators, June 03(see more posts on Bollinger Bands, GBP/USD, MACDs Moving Average, RSI Relative Strength, Stochastics, )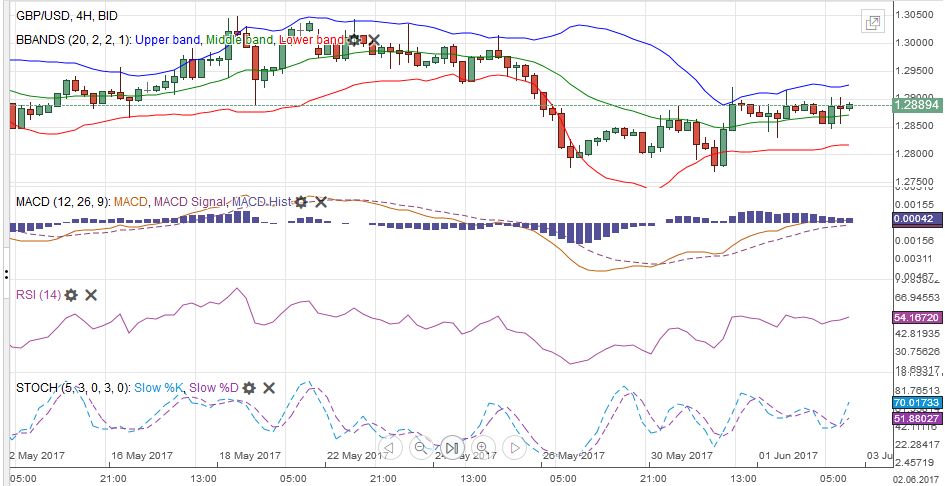 GBP/USD Week Ending June 03 with Technical Indicators - Click to enlarge |
AUD/USDA good part of the technical damage inflicted on the Australian dollar as it declined in five of six sessions was repaired on before the weekend with its nearly 1% advance. It recovered off the $0.7375 area on the back of the poor US jobs report, recouped half of what it lost over those five sessions (~$0.7445). A weaker US dollar environment and soft US rates can help lift the Aussie back into the $0.7500-$0.7700 area. Near-term potential extends toward $0.7525 and then $0.7600.
|
AUD/USD with Technical Indicators, June 03(see more posts on Australian Dollar, Bollinger Bands, MACDs Moving Average, RSI Relative Strength, Stochastics, )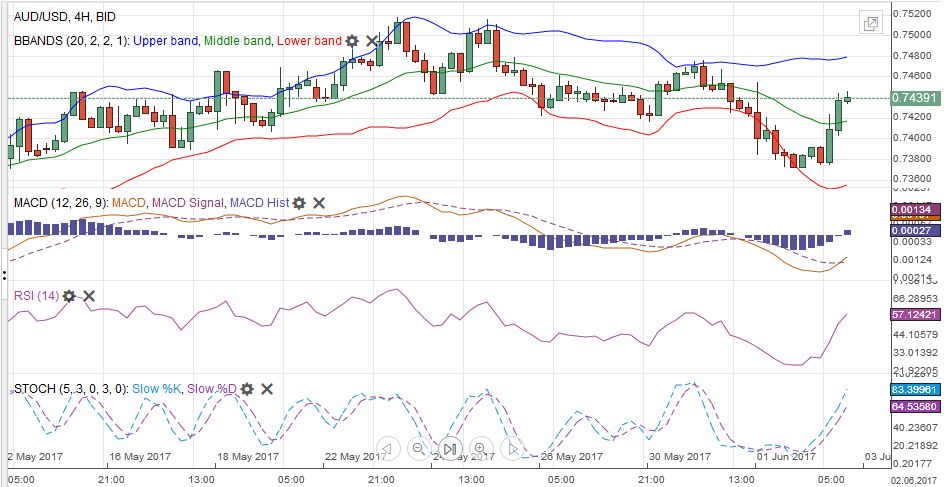 AUD/USD Week Ending June 03 with Technical Indicators - Click to enlarge |
USD/CADThe US dollar snapped a two-week decline against the Canadian dollar and rose 0.4% on the week. The Slow Stochastics have turned higher, and the MACDs are about to, but the price action itself is more worrisome. After reaching its best level since May 19, which corresponded with a 38.2% retracement of the US dollar’s fall since the May 5 key reversal, the greenback sold off before the weekend and settled on its lows. Initial support is seen in the CAD1.3450-CAD1.3480 area, but the potential is to re-test the May 25 low below CAD1.3400.
|
USD/CAD with Technical Indicators, June 03(see more posts on Bollinger Bands, Canadian Dollar, MACDs Moving Average, RSI Relative Strength, Stochastics, ) USD/CAD Week Ending June 03 with Technical Indicators - Click to enlarge |
Crude OilFrom the May 25 high through the pre-weekend low, the July light sweet crude oil futures contract fell more than 10%. The contract briefly dipped below $47 before recovering, leaving a possible bullish hammer candlestick in its wake. A move above $52 is needed to be of technical significance. The technical indicators point to continued risk on the downside. There is little support below $46 until $44, where prices had spiked on May 5. The price of oil has fallen for four of the five months this year. After falling 9.4% in Q1, it is off another 6% in the first two months of Q2. |
Crude Oil, May 2016 - May 2017(see more posts on Crude Oil, ) Source: bloomberg.com - Click to enlarge |
U.S. TreasuriesThe US 10-year yield fell nine basis points. It was the second time in three weeks that a decline of that magnitude was recorded. A new low yield print was recorded (~2.14%) since last November. With falling core PCE deflator, disappointing jobs and auto sales, and doubts over the legislation of the economic agenda, there does not seem much in the way of a further decline toward 2.0%. Though stretched, the technical indicators for the 10-year Treasury note futures do not suggest a top is imminent. The 127-04 area corresponds to a 50% retracement of the sell-off since last November. The 61.8% retracement is 128-03.
|
Yield US Treasuries 10 years, May 2016 - May 2017(see more posts on U.S. Treasuries, ) Source: bloomberg.com - Click to enlarge |
S&P 500 IndexNeither weak macro data nor valuation concerns have held back the S&P 500. It is participating in what is a global rally. Although conventional wisdom was that European equities would rally more than US shares, so far this year, the S&P 500 has held its own. It is up 8.8%, just nosing ahead of the Dow Jones Stoxx 600 (~8.6%). The Nikkei 400, which the BOJ buys ETFs on, is up almost 5.7% year-to-date. The technical indicators are not particularly stretched. The note of caution comes from bumping against the upper Bollinger Band. Last week began by breaking a seven-day advance, but the week finished on a firmer note with new record highs.
|
S&P 500 Index, June 03(see more posts on S&P 500 Index, )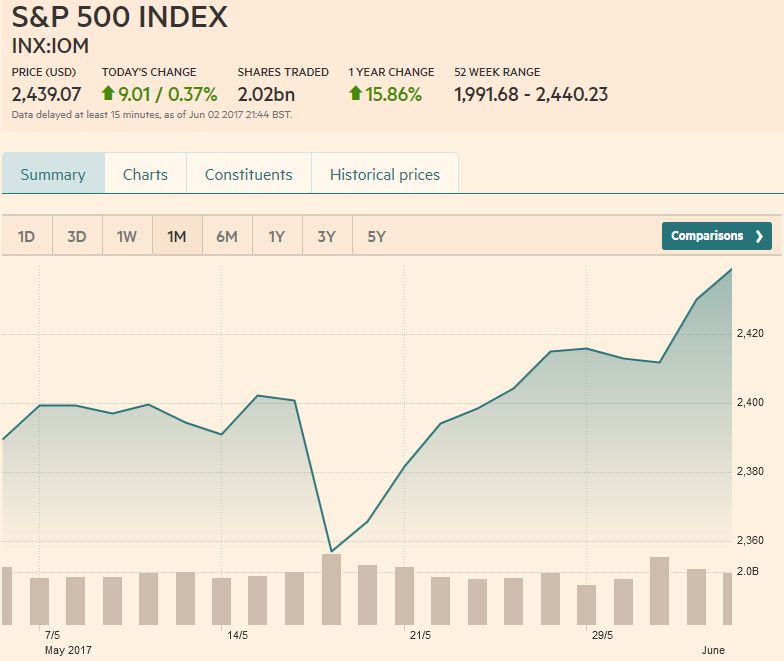 Source: markets.ft.com - Click to enlarge |
Are you the author?
Tags: Australian Dollar,Bollinger Bands,British Pound,Canadian Dollar,Crude Oil,EUR/CHF,EUR/USD,Euro,Euro Dollar,GBP/USD,Japanese yen,MACDs Moving Average,newslettersent,RSI Relative Strength,S&P 500 Index,Stochastics,Swiss Franc Index,U.S. Dollar Index,U.S. Treasuries,US Dollar Index,usd-jpy,USD/CHF,USD/JPY


