


George Dorgan
My articles My siteAbout meMy videosMy books
Follow on:LinkedINTwitterSeeking Alpha
CFA SocietyEconomicBlogs
Swiss Franc vs USD and EURThe Swiss Franc recovered a lot of the losses that came with the French elections. That political event was mostly driven by speculators that will close their positions. We expected the EUR to trade around 1.07 to 1.0750 CHF in some time. What exactly is this “some time” remains open, but is at the latest in early 2018. Many, like Thomas Flury, currency strategist at UBS, think that the Swissie will weaken. This is mostly based on the assumption that higher inflation will force the ECB to reduce their bond purchases. We do not agree; on the contrary we reckon that Euro zone inflation will fall to under 1% in the beginning of next year. See more in our weekly SNB interventions update.
|
EUR/CHF and USD/CHF, May 20(see more posts on EUR/CHF, USD/CHF, )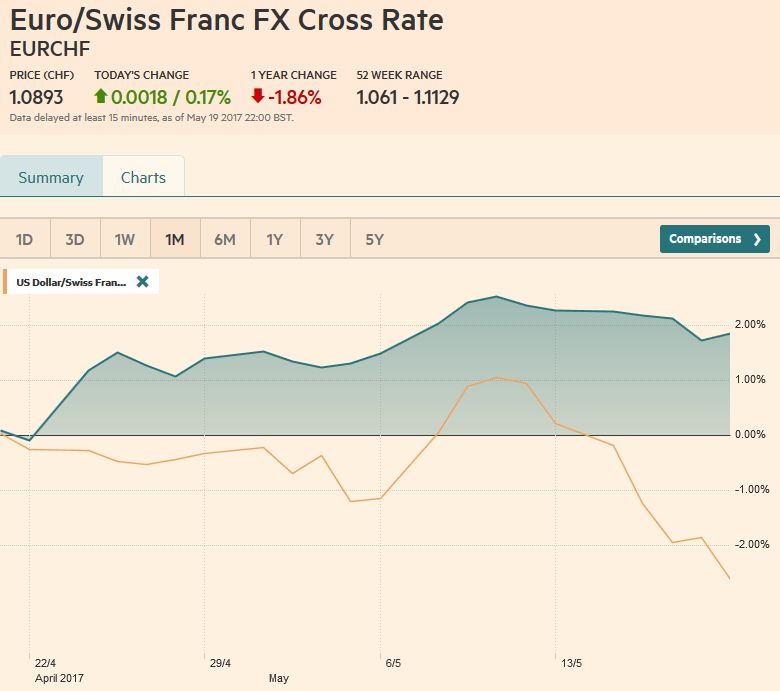 The picture shows that FX traders went long EUR against CHF. Source: markets.ft.com - Click to enlarge |
Swiss Franc Currency Index (3 years)The Swiss Franc index is the trade-weighted currency performance (see the currency basket)On a three years interval, the Swiss Franc had a weak performance. The dollar index was far stronger. The dollar makes up 33% of the SNB portfolio and 25% of Swiss exports (incl. countries like China or Arab countries that use the dollar for exchanges). Contrary to popular believe, the CHF index gained only 1.73% in 2015. It lost 9.52% in 2014, when the dollar (and yuan) strongly improved. |
Swiss Franc Currency Index (3 years), May 20(see more posts on Swiss Franc Index, )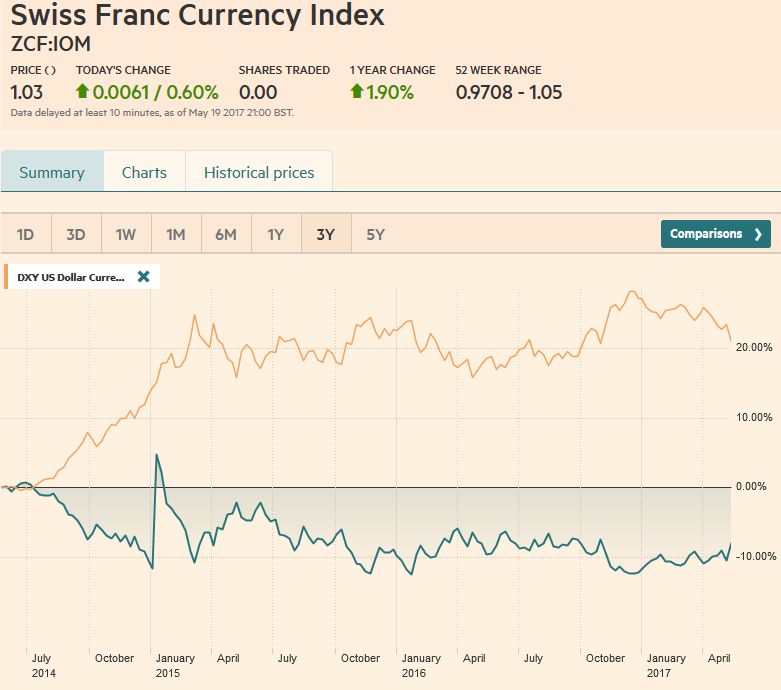 Source: markets.ft.com - Click to enlarge |
Marc Chandler My articles My offerMy siteAbout meMy videosMy books Follow on:LinkedINTwitterSeeking AlphaAmazon USD/CHFThe US dollar was hammered last week, and there is little from a technical or fundamental perspective to suggest near-term movement in the direction of our longer-term forecasts. The escalation of the investigation into Russia’s involvement in the recent US election threatens to take resources, time, and attention away from the economic agenda, which had already begun meeting some skepticism. At the same time that expectations are mounting for a shift in ECB’s stance in a few weeks, and Japan’s economy surprised on the upside in Q1.
The Trump Administration’s inexperience in the legislative process will be again evident next week after the CBO provides its estimates on the House health care reform. Some legislators admitted to not reading the entire bill before voting on it, but this may not be as unusual at is sounds. More telling was that the chamber voted on the measure without learning the CBO scoring (on the deficit). When it is provided, another vote may be necessary to prepare the groundwork for the eventual reconciliation process, which means Democrats support may be unnecessary.
The decline in US interest rates has removed a leg that had been propping up the dollar. The two-year premium over German has fallen three consecutive weeks and five of the past six weeks. It has returned to January levels. The 10-year premium has been reduced to its least in six months. The US 10-year premium over Japan is also near its lows since last November. That said, expectations for a Fed hike next month continue to run higher. Bloomberg calculations estimate at a 97.5% chance has been discounted, while the CME (like our own calculation) is somewhat less but still elevated at more than a 70% probability.
|
US Dollar/Swiss Franc FX Spot Rate, May 20(see more posts on USD/CHF, )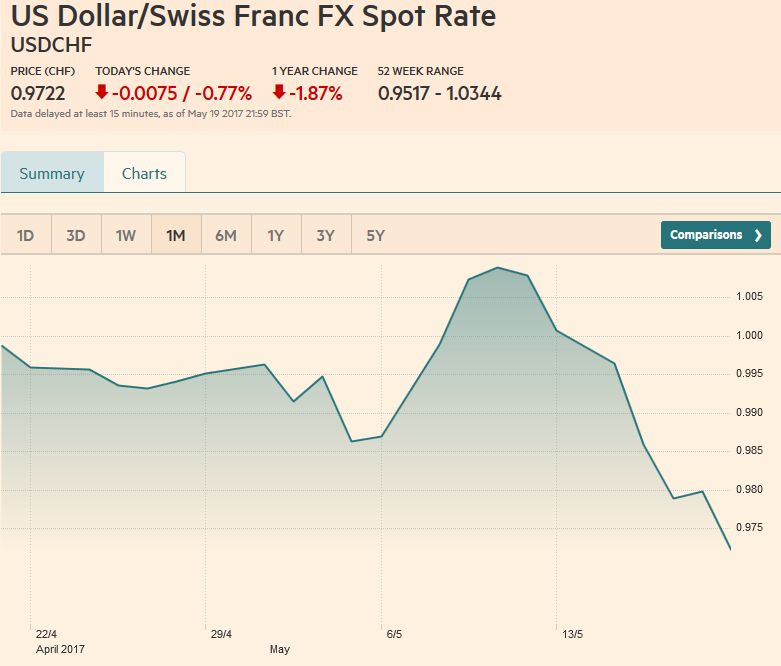 Source: markets.ft.com - Click to enlarge |
US Dollar IndexThe Dollar Index finished last week at its lowest level since the US election. The next target is near 96.45 and then the November 9 low a little below 95.90. Beyond, that some will look for a return to last year’s low set in early May just below 92.00. On the upside, a move above 97.40-97.80 offers initial resistance, while a move through 98.15-98.30 would help stabilize the tone.
|
US Dollar Currency Index, May 13(see more posts on US Dollar Index, )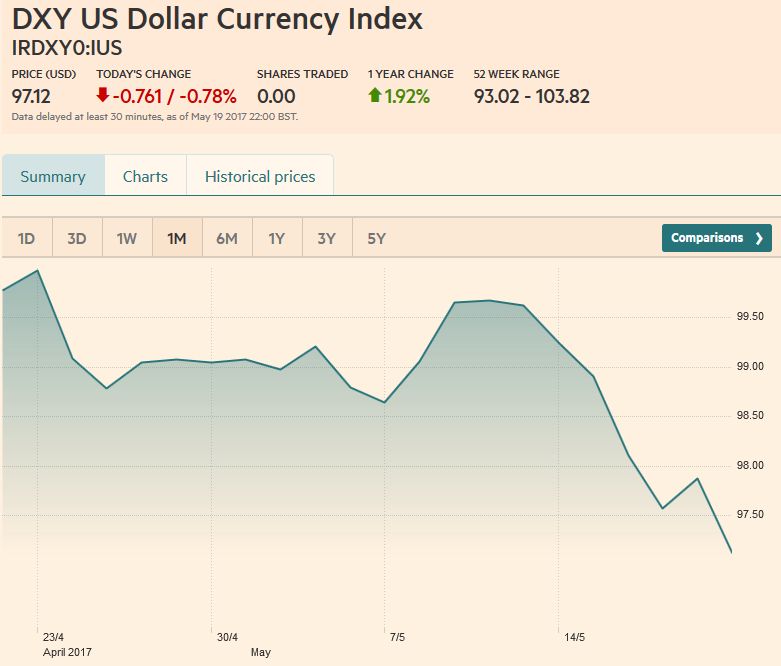 Source: markets.ft.com - Click to enlarge |
EUR/USDInvestors and policy makers are growing increasingly confident that Europe has turned the corner. Draghi himself confirmed last week that the crisis was over and the recovery was broadening and becoming more resilient. Interestingly, the signal is not being sent by leaks or comments from the creditor countries as it was previously. There is widespread expectations that this will be expressed by the ECB at next month’s meeting.
A decision to taper and extend the asset purchases into next year is expected later this year, and possibly at the September meeting (with staff forecast updates), which takes place prior to the German election. And that is the other point. Political risk in Europe has diminished at the same time US political risk has increased. The populist-nationalist threat has diminished in Europe, and it appears that Merkel will succeed in her quest to be reelected Chancellor for a fourth time. Austria’s election has been set for mid-October, but it is prominent on investor’s radar screens. We, like other, are concerned about Italy’s election, but that is a 2018 story.
The euro’s weekly close above $1.1130 is a bullish development that opens the door to the initial high in response to the US election near $1.1315. A band of congestion extends toward $1.1360, above where last year’s high, roughly $1.1615, would come into view. The technical indicators are in agreement that the upside is the path of least resistance. Only a break of the $1.1080 area would undermine the bullish technical view.
|
EUR/USD with Technical Indicators, May 20(see more posts on Bollinger Bands, EUR/USD, MACDs Moving Average, RSI Relative Strength, Stochastics, )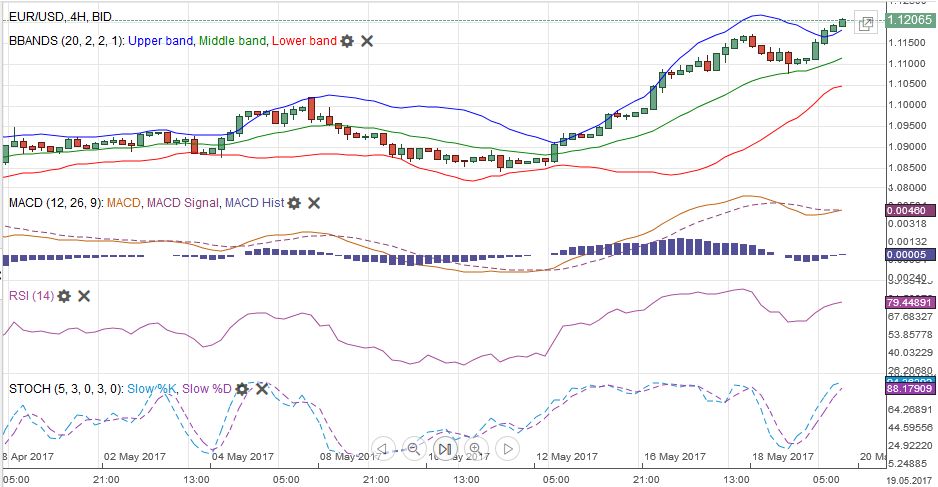 EUR/USD Week Ending May 20 with Technical Indicators - Click to enlarge |
USD/JPYIn terms of the dollar-yen rate, the key question is whether the JPY110.25 low on May 18 is significant. The dollar’s initial bounce fizzled as it approached the lower end of a band of resistance found between JPY111.80 and JPY112.30. The technical indicators have not turned higher and warn that the downside may not have been exhausted. A convincing move through JPY110.25 could signal another yen decline for the dollar. |
USD/JPY with Technical Indicators, May 20(see more posts on Bollinger Bands, MACDs Moving Average, RSI Relative Strength, Stochastics, USD/JPY, )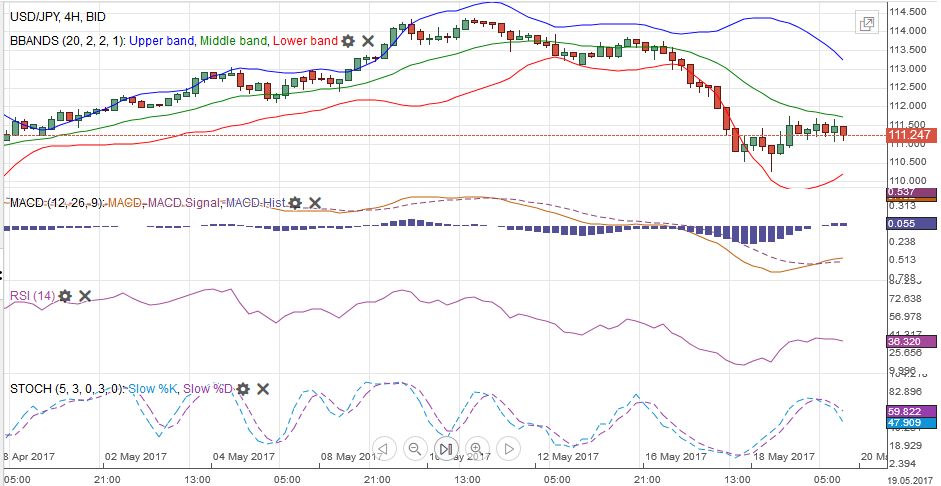 USD/JPY Week Ending May 20 with Technical Indicators - Click to enlarge |
GBP/USDSterling’s strength may be exaggerated by the dollar’s weakness. It gained a little more than 1% against the sagging greenback, but lost 1.4% against the euro, 1.7% against the Swiss franc, and lost 0.5% against the Japanese yen. Sterling fulfilled the 38.2% retracement objective of the Brexit losses ($1.3055). The 50% retracement is found at $1.3430, though before getting there, congestion and the technical considerations suggest the $1.3250-$1.3300 may offer formidable resistance. |
GBP/USD with Technical Indicators, May 20(see more posts on Bollinger Bands, GBP/USD, MACDs Moving Average, RSI Relative Strength, Stochastics, )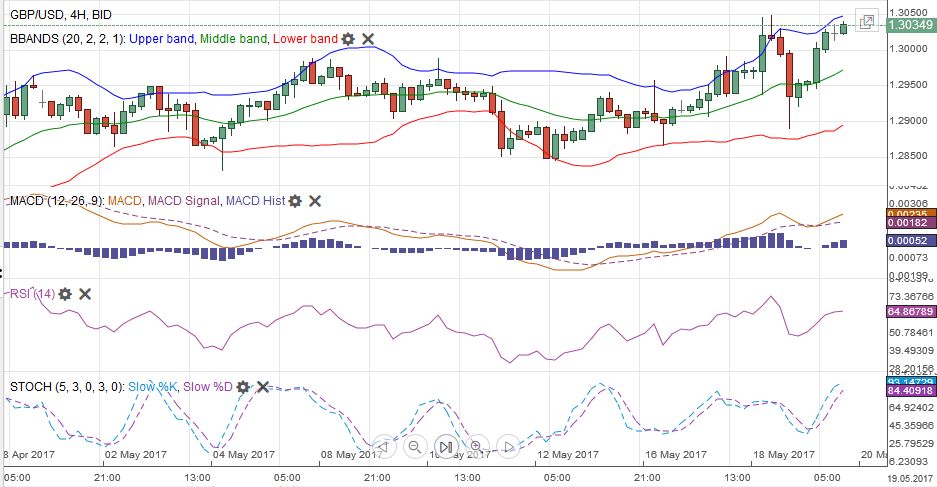 GBP/USD Week Ending May 20 with Technical Indicators - Click to enlarge |
AUD/USDUnlike the euro and sterling, which are trading through their upper Bollinger Band, or the Canadian dollar, where the Bollinger Band has been approached, the Australian dollar’s technicals are constructive and the upper Bollinger Band is not close. A strong labor report reduces the downside risks to the cash rate. The Australian dollar is our favorite currency next week and we look for a move through $0.7500 toward $0.7550 in the coming days. Before this past week, the Aussie fell in five of the six weeks since the start of April. |
AUD/USD with Technical Indicators, May 20(see more posts on Australian Dollar, Bollinger Bands, MACDs Moving Average, RSI Relative Strength, Stochastics, )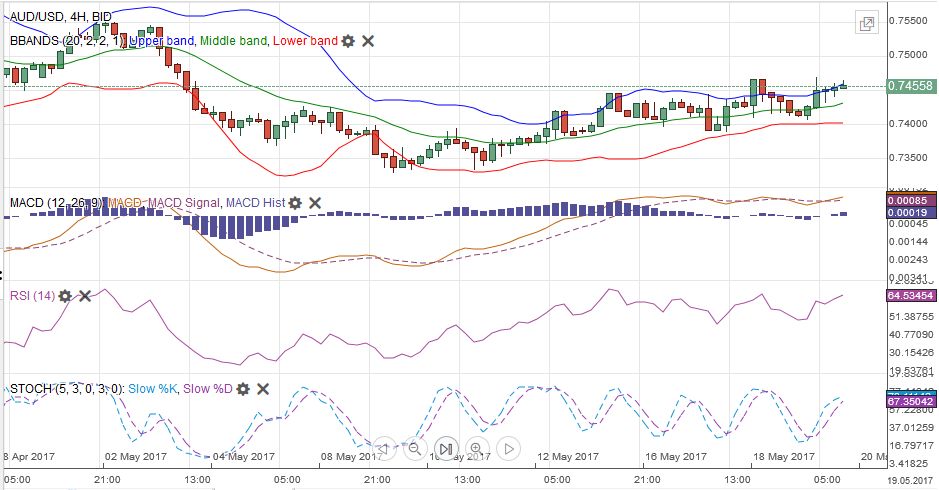 AUD/USD Week Ending May 20 with Technical Indicators - Click to enlarge |
USD/CADDisappointing retail sales and a softer than expected CPI failed to deter a further recovery in the Canadian dollar. The US dollar was sold through the CAD1.3575 area and toward almost CAD1.3500, and a band of support extends to CAD1.3480. However, the risk is for steeper losses as what was a record short position in the futures market is adjusted. A move to CAD1.3380-CAD1.3400 is not unreasonable. Note though, that the US two-year premium over Canada remains elevated (~60 bp). We expect resistance to be encountered in front of CAD1.3600.
|
USD/CAD with Technical Indicators, May 20(see more posts on Bollinger Bands, Canadian Dollar, MACDs Moving Average, RSI Relative Strength, Stochastics, )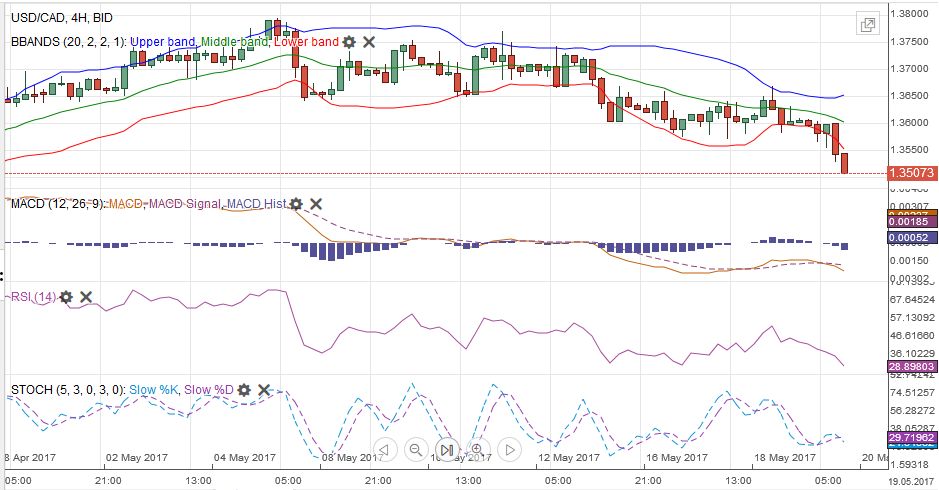 USD/CAD Week Ending May 20 with Technical Indicators - Click to enlarge |
Crude OilThe July light sweet crude oil futures continued to rally. The 5.25% rally last week after the nearly 3.4% advance the week before carried the futures contract to its best level in a month. The move above $50.50 fulfilled the 61.8% retracement objective of the drop since April 12. However, the risk is that the market is retracing the this year’s decline that began from the early January high of $58.15. The 50% retracement is $51.15. The 61.8% retracement is almost $52.80. The technical indicators favor additional near-term gains. On the downside, the $49.50 area should hold if the bull move is under way. |
Crude Oil, May 2016 - May 2017(see more posts on Crude Oil, )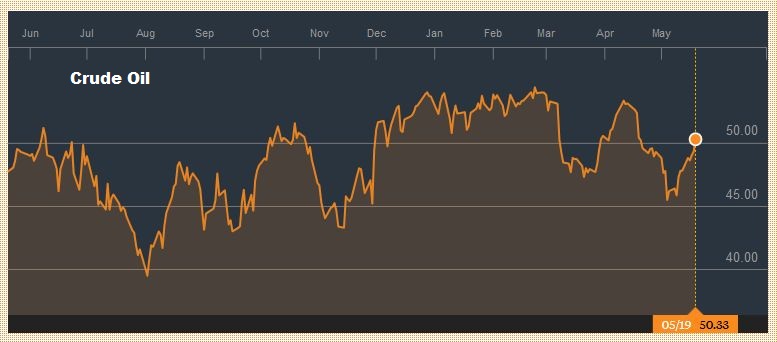 Source: bloomberg.com - Click to enlarge |
U.S. TreasuriesThe US 10-year yield spiked down to 2.18% on May 18, but quickly snapped back. The 2.30% area, which had been the floor earlier this year now blocks the upside, and it could not sustain a move 2.25% ahead of the weekend, despite the gains in the equity market. The June note futures rallied strongly to fill the gap April 24 created by Macron’s finish in the first round of the election process, and briefly took out last month’s high, before moving lower. This leaves a potential double top in the its wake. The technical indicators are generating a mixed signal. June contract found a bid near in front of 126-00. A break of the 125-16 may be need to give the bulls second thoughts.
|
Yield US Treasuries 10 years, May 2016 - May 2017(see more posts on U.S. Treasuries, )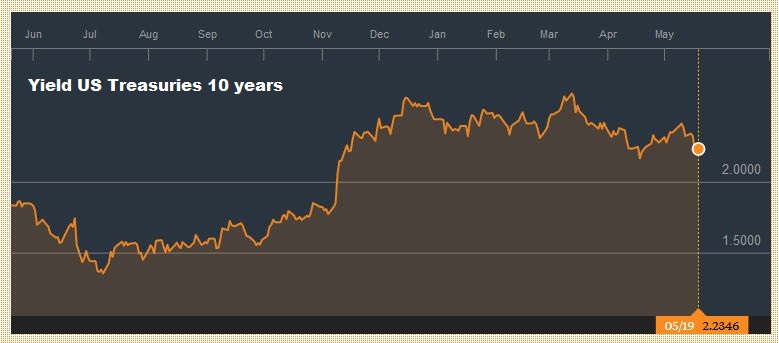 Source: bloomberg.com - Click to enlarge |
S&P 500 IndexThe S&P 500 gapped lower on May 17. The subsequent sell-off managed to fill the earlier gaps created following Macon’s victory in the first round. This relieved a downside draw that had been a concern. The S&P 500 bounced off 2350 area on May 18 and saw a further recovery ahead of the weekend. The May 19 high (~2389) was above the May 17 high, which means the gap was entered. It was not closed and extends to the May 17 low of a little above 2396. The RSI and MACDs appear supportive, while the Slow Stochastics are moving lower. Leaving aside measures of intrinsic valuation, either the Trump economic agenda is implemented and it works, which is arguably good for equities, or it is not implemented doesn’t boost the US economy, and that may make equities look attractive because interest rates will remain low for longer.
|
S&P 500 Index, May 20(see more posts on S&P 500 Index, )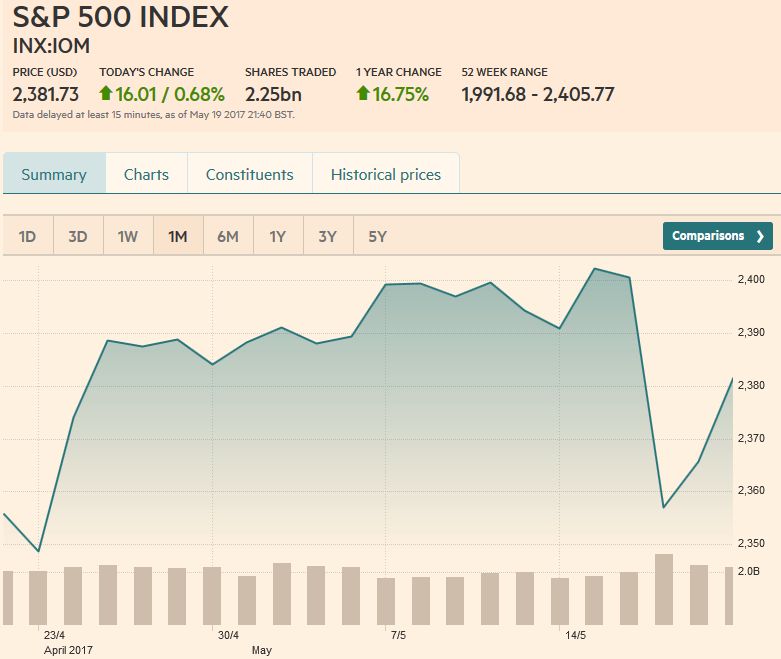 Source: markets.ft.com - Click to enlarge |
Are you the author?
Tags: Australian Dollar,Bollinger Bands,British Pound,Canadian Dollar,Crude Oil,EUR/CHF,EUR/USD,Euro,Euro Dollar,GBP/USD,Japanese yen,MACDs Moving Average,newslettersent,RSI Relative Strength,S&P 500 Index,Stochastics,Swiss Franc Index,U.S. Dollar Index,U.S. Treasuries,US Dollar Index,usd-jpy,USD/CHF,USD/JPY


