Jeffrey P. Snider
My articles My offerMy siteAbout meMy videosMy books
Follow on:LinkedINTwitterSeeking Alpha
As we move further into 2017, economic statistics will be subject to their annual benchmark revisions. High frequency data such as any accounts published on or about a single month is estimated using incomplete data. It’s just the nature of the process. Over time, more comprehensive survey results as well as upgrades to statistical processes make it necessary for these kinds of revisions.
There is, obviously, great value in having even incomplete data estimates published in as close to real time as can be possible right now. Most of the time there aren’t major revisions to a data set because by and large growth is to some degree predictable. That is the essence of trend-cycle subjectivity, as government statisticians in the past had been able to more easily determine the trajectory for whatever economic data and use it to further construct the trend-line for measured monthly variation.
The problem, equally obvious, is for any period where the assumed trend becomes obsolete. In the past, that had typically meant recession, for any statistical series always has difficulty with inflection due to the basic premise of using the recent past to try to measure the near future. Such a short-term discrepancy was something we could all live with, because if whatever piece of information didn’t exactly tell us when the inflection was reached we would anyway soon enough be able to easily infer it by common sense at least.
This “recovery” period was at first modeled by trend-cycle analysis as a recovery. That was evident across a range of statistics but to the most visible extreme with Industrial Production. The Fed’s subjective assumptions about the state of US industry produced self-reinforcing guidance about that agency’s forward assumptions of the state of the economy (IP was growing steadily, therefore QE must be working). The data issue, then, is revealed where recovery, at least one consistent with past recoveries, doesn’t occur. If that was to be the case, then even the most robust statistics like IP with its almost 100 years of data would encounter serious and significant problems accurately depicting what was really going on – meaning that the data series reflected more subjectivity than actual results.
The first half of 2015 displayed just these kinds of confusing signals. On the plus side, there was the unemployment rate that was rapidly falling. Under more normal conditions, such an outcome would never be challenged as anything but positive and comforting. In this era, however, the participation problem immediately questioned its veracity by the state of the ratio’s own denominator.
On the other side were financial markets (bonds/eurodollar futures) and prices (oil, especially) increasingly pessimistic just as the unemployment rate entered its steeper decline. That left all the other major economic accounts to try to settle the ledger one way or the other. Clearly, in the first few months of 2015 the US and global economy decelerated with the oil crash, leaving questions more about the implications of that condition. The view from the unemployment rate as well as other key BLS statistics was that it was a “transitory” aberration soon to be fixed.
| In terms of industrial production, an important statistic not just because of its history but more so due to where weakness at that moment was manifesting in industry, particularly manufacturing, the seasonally-adjusted trend had picked up on that weakness dating back to the middle of the year before. But in the spring of 2015 IP had seemed to shake off those growing doldrums so that the idea of “transitory” seemed plausible – and all the excuses employed then to try to dismiss the possible downturn as some benign quirk.
From July 2015 and an article published by USA Today reporting the first estimate for June 2015 IP:
|
US Industrial Production, Jan 2006 - 2017(see more posts on U.S. Industrial Production, )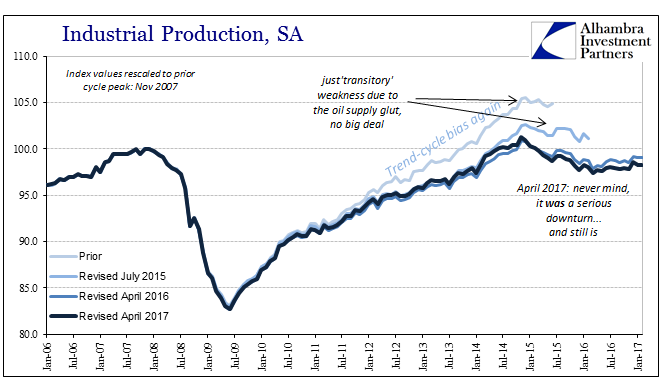 - Click to enlarge |
| That was one of the chief comforts provided by IP as well as others; though it was slowing it remained positive in terms of annual growth, meaning that (like early 2007) economists could continue to dismiss it so as to focus on the more pleasing labor stats.
After several benchmark revisions, however, including the latest set released today, IP for June 2015 now shows instead a 1.4% decline year-over-year. In fact, the new data set figures that the contraction in US industrial production began far earlier than first thought and was significantly deeper at its trough. |
US Industrial Production, Jan 2010 - 2017(see more posts on U.S. Industrial Production, )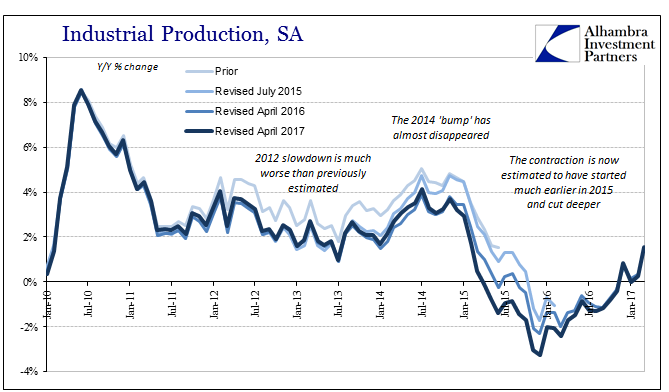 - Click to enlarge |
| How might the events of August 2015 and after been differently characterized had this particular statistic been much more accurate? The mainstream treated the CNY “devaluation” as a Chinese anomaly of “overseas” turmoil unrelated to the US economy that was by the Fed’s decree at far greater risk of “overheating” than continuing to wane. A sudden liquidation in all global markets makes much more sense where Industrial Production here is already contracting than at the time when the media was also kept in the dark. Given the standing of IP in even the orthodox predictive process, a contraction, which was a rare event associated before 2015 exclusively with recession, might better have informed at least the public about the competence of economists, monetary officials and their view of money most especially.
Instead of wondering what was going on ill-informed by the media adhering rigidly to outdated editorial standards that relied (and still rely) on credentials alone, the public could have been presented with the more immediate factual case that Janet Yellen had no idea what she was talking about, no matter how impressive her pedigree. That might have extended to views about the dollar which, as the quote above amply represented, was a mainstream topic, allowing some actual facts about it to replace outdated conjecture that still somehow treats QE as “money printing.” |
Curve Gone Flat, Mar 2009 - 2017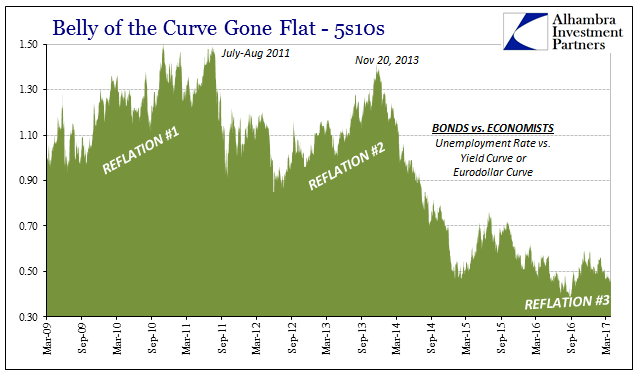 - Click to enlarge |
| That is both the reason as well as the excuse for the statistical problems uncovered by benchmark revisions over the past few years. It has unfortunately taken these delayed updates to more fully reveal the lack of success of monetary policy and the complete extent to which the bond market was right (at the expense of the unemployment rate). Common sense told us that “something” was very wrong at least by the end of 2014, if not before, but because economic data is constructed in a way that is married to a past that long ago stopped being applicable, the issue was far more in doubt than it should have been.
Like 2008, 2015-16 became a wasted opportunity for real understanding and therefore the slimmest chance of actual monetary reform by which to escape this lost decade, all due to unnecessary and harmful confusion over what should have been a more obvious (common sense) assessment – one that applied to much more than just the individual months of that time, linked in an unbroken trend of malaise and stagnation that had completely replaced the recovery years before. It’s yet another reason for how we got here; a perpetual state of muddied economic accounts that take far too long to get sorted out and end up just confirming common sense anyway. |
US Real GDP, Jan 2005 - 2019(see more posts on U.S. Gross Domestic Product, ) - Click to enlarge |
Tags: currencies,depression,economy,Federal Reserve/Monetary Policy,industrial production,industry,Janet Yellen,manufacturing,Markets,newslettersent,QE,recession,U.S. Gross Domestic Product,U.S. Industrial Production