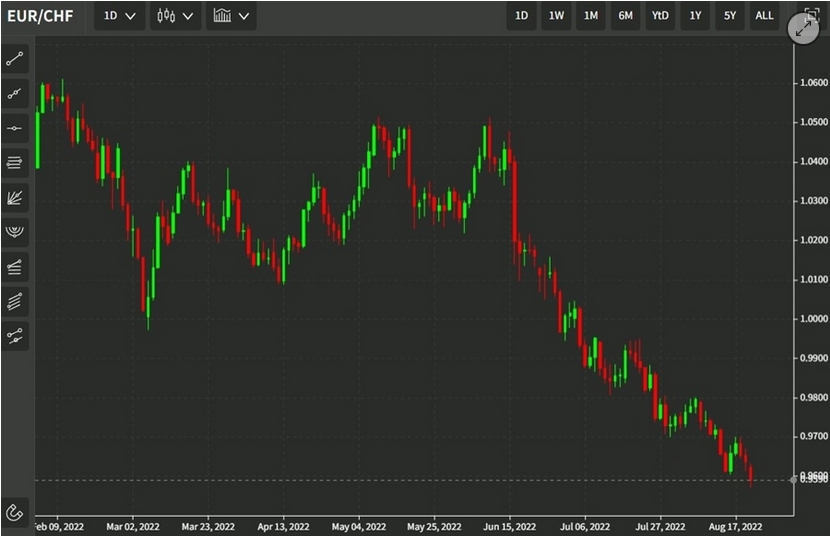
Swiss Franc Currency IndexWeak inflation figures in the euro zone let the common currency fall against both the dollar and the Swiss franc. Still last week, the Swiss Franc index had some losses against the US dollar index. |
Trade-weighted index Swiss Franc, April 01(see more posts on Swiss Franc Index, )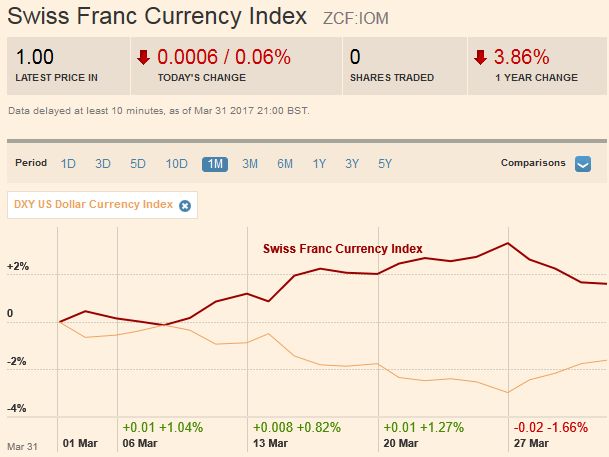 Source: markets.ft.com - Click to enlarge |
Swiss Franc Currency Index (3 years)The Swiss Franc index is the trade-weighted currency performance (see the currency basket)On a three years interval, the Swiss Franc had a weak performance. The dollar index was far stronger. The dollar makes up 33% of the SNB portfolio and 25% of Swiss exports (incl. countries like China or Arab countries that use the dollar for exchanges). Contrary to popular believe, the CHF index gained only 1.73% in 2015. It lost 9.52% in 2014, when the dollar (and yuan) strongly improved. |
Swiss Franc Currency Index (3 years), April 01(see more posts on Swiss Franc Index, ) Source: markets.ft.com - Click to enlarge |
USD/CHFThe US dollar rose against most of the major currencies in the last week of March, except the Australian and Canadian dollars, and the British pound. The greenback’s recovery from the losses suffered amid questions about the Trump Administration’s ability to enact its economic program despite the Republican Party having a majority in both houses of the legislature, and the executive branch has helped improve the technical tone. |
US Dollar/Swiss Franc FX Spot Rate, April 01(see more posts on USD/CHF, )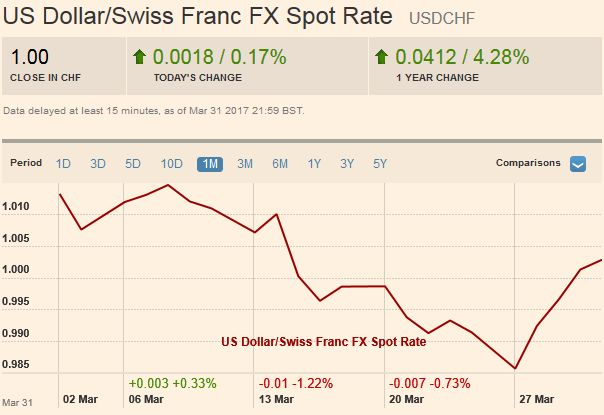 Source: markets.ft.com - Click to enlarge |
US Dollar IndexThe Dollar Index snapped a three-week downdraft by rising nearly 0.75%. It was its biggest gain in seven weeks. It finished the week above the psychologically important 100 level. Last week’s gains managed to retrace 50% of the decline since March 9. That retracement is found near 100.55.
The 20-day average, which the Dollar Index has not closed above since the day before the Fed hiked on March 15 is found a few ticks above the retracement objective. The 61.8% retracement is just below 101.
The MACD and Slow Stochastics have turned higher, while the RSI is lagging a bit. Some technicians suggest that with the March low a little below the February low some kind of three-legged downside correction from the cyclical high recorded on January 3 is completed. A downtrend line connecting the early January and March highs comes in near 101.60 at the end of next week (April 7). A move above it would lend credence to ideas that the greenback’s uptrend is resuming.
|
US Dollar Currency Index, April 01(see more posts on U.S. Dollar Index, ) Source: markets.ft.com - Click to enlarge |
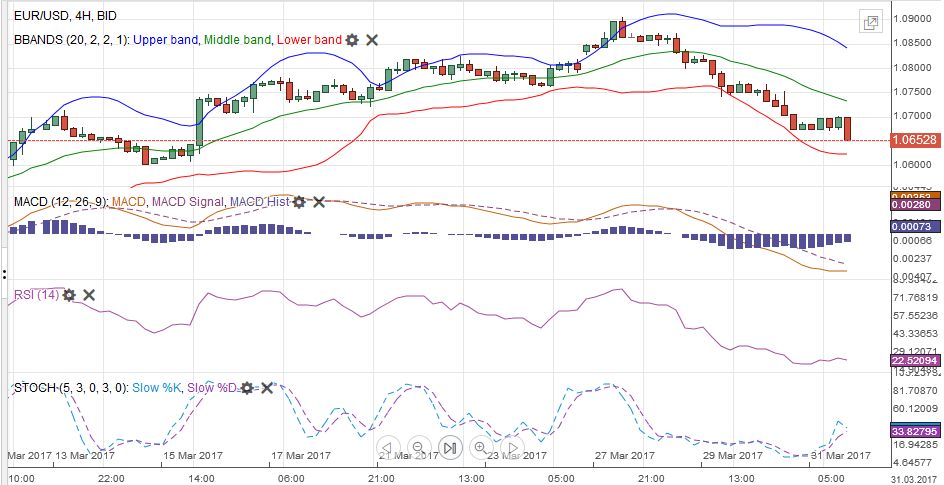
EUR/USDThe euro lost 1.35% last week and finished on its lows. It peaked a little above $1.09 at the start of last week and finished a little above $1.0650. Somewhat better news from the US, while eurozone inflation plummeted, with the core rate falling nearly back to its trough took its toll. The MACD and Slow Stochastics have turned down. The euro closed below its 20-day moving average for the first time since March 3. The five-day average may push below the 20-day average in the week ahead. By the end of last week, the euro retraced 61.8% of its gains since March 2 dip below $1.05. It was found near $1.0650. Below there, and we would target the $1.0560-$1.0575. Resistance, we would peg near $1.07. |
EUR/USD with Technical Indicators, March 27 - April 01(see more posts on Bollinger Bands, EUR/USD, MACDs Moving Average, RSI Relative Strength, Stochastics, ) |
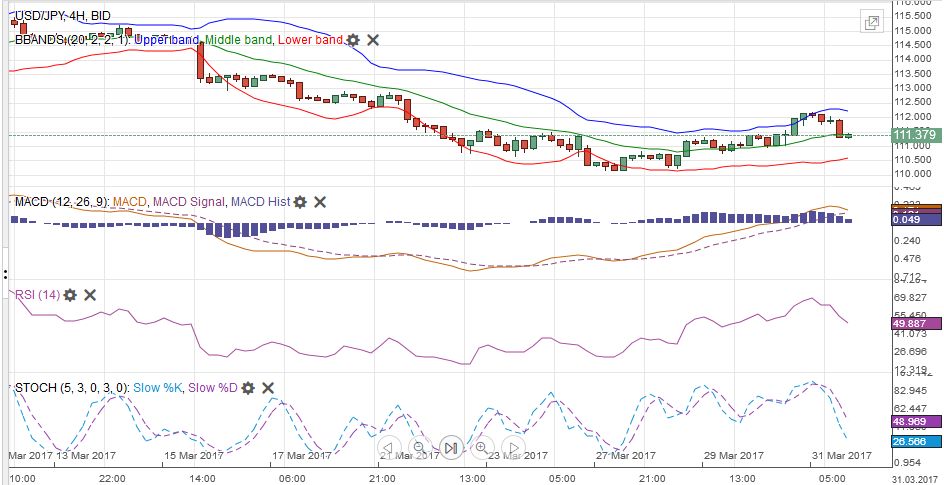
USD/JPYThe dollar was practically flat against the yen last week. The greenback had recovered smartly from the start of the week’s test on JPY110 and reached JPY112.20 before the weekend. However, the dollar sold off after reaching the high in Asia and finished the week on the session lows around JPY111.40. The Slow Stochastics have turned up for the dollar, and the MACDs appear set to cross in the coming days. Not coincidentally, the US 10-year yield slipped back below 2.40% before the weekend. We suspect dollar buyers will emerge on any further weakness at the start of April. The JPY112.20 is the first objective, while a move above JPY112.75 would lift the tone considerably. |
USD/JPY with Technical Indicators, March 27 - April 01(see more posts on Bollinger Bands, MACDs Moving Average, RSI Relative Strength, Stochastics, USD/JPY, ) |
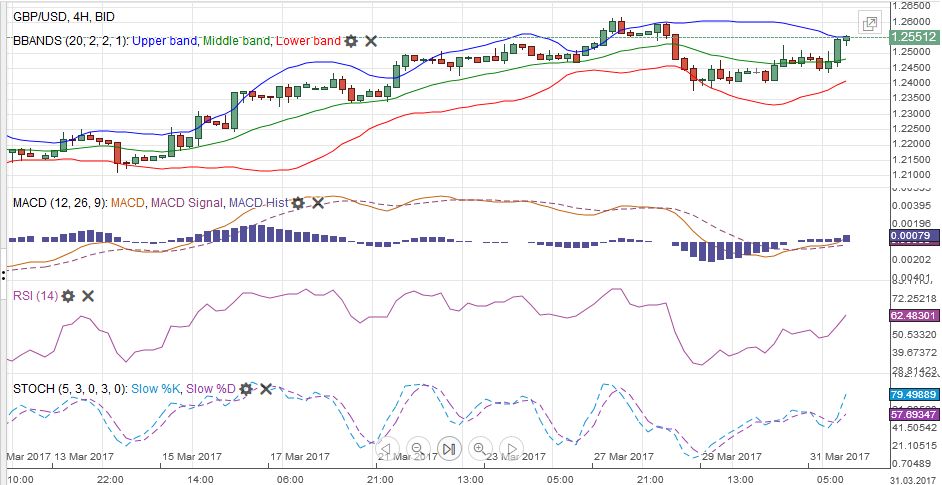
GBP/USDSterling closed higher for the third consecutive week. The close was strong, on session highs. It looks poised to re-challenge the recent high near $1.2615 (March high) However, the Slow Stochastics have already turned lower, and the MACDs look close to turning. We suspect that follow through buying at the start of the week ahead will be sold, and the February high a little above $1.27 may go untested. Since last October sterling has been in a broad trading range: $1.20-$1.27. We look for the range to remain intact until a new impetus emerges, which could be greater confidence in a June Fed move or UK economic developments. |
GBP/USD with Technical Indicators, March 27 - April01(see more posts on Bollinger Bands, GBP/USD, MACDs Moving Average, RSI Relative Strength, Stochastics, ) |
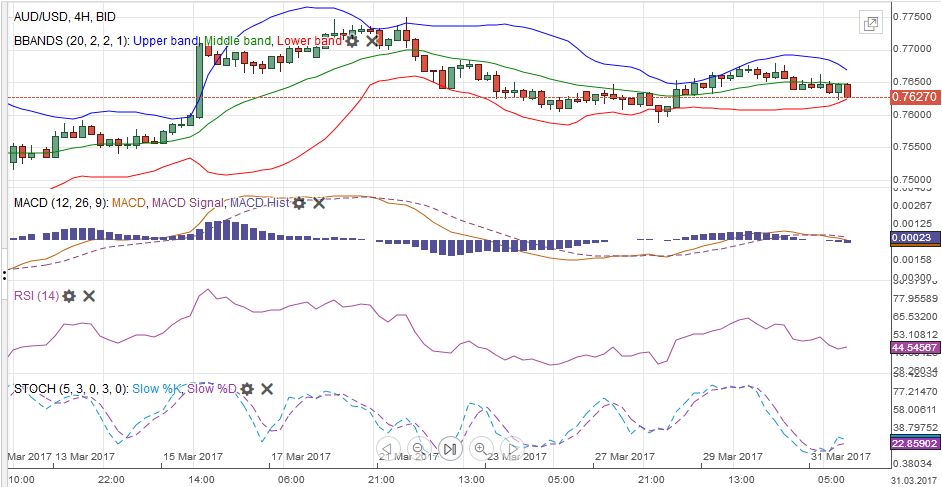
AUD/USDThe technical indicators for the Canadian and Australian dollars do not appear to be generating strong signals. The price action has been choppy. The Australian dollar still appears to be confined to a $0.7600-$0.7700 range. Rather than play the breakout, many short-term participants seem to be fading range extensions. |
AUD/USD with Technical Indicators, March 27 - April 01(see more posts on Australian Dollar, Bollinger Bands, MACDs Moving Average, RSI Relative Strength, Stochastics, ) |
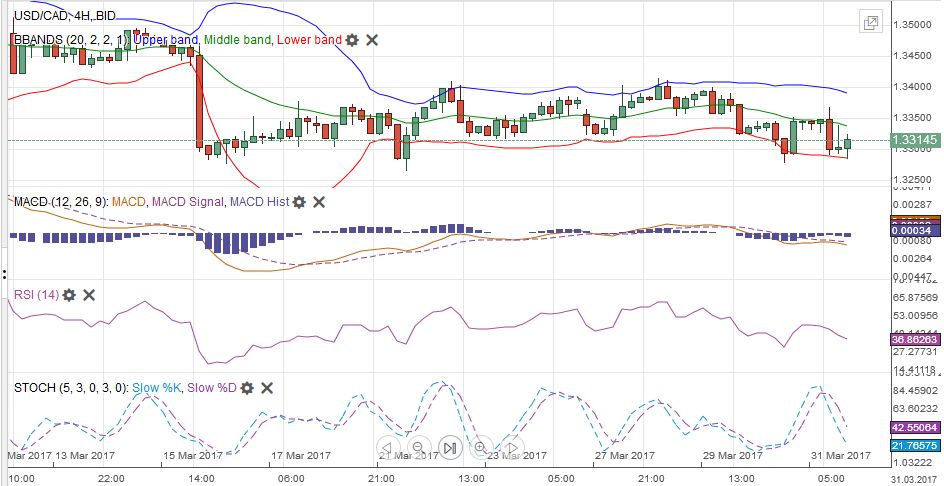
USD/CADThe US dollar has been finding bids below CAD1.33, while it has been stymied a little above CAD1.34. |
USD/CAD with Technical Indicators, March 27 - April 01(see more posts on Bollinger Bands, Canadian Dollar, MACDs Moving Average, RSI Relative Strength, Stochastics, ) |
Crude OilLight sweet crude oil had a strong week. The 5.5% gain is the best weekly performance since the first reaction to OPEC’s agreement to cut output. Last week and the previous week, the May contract tested the $47 a barrel level, and it held. The move back above $50 met the minimum objective of the double bottom pattern. The technical indicators are favorable, and the $51.00-$51.20 area is the next objective, but near-term potential extends toward $52.00-$52.25. |
Crude Oil, March 2016 - March 2017(see more posts on Crude Oil, )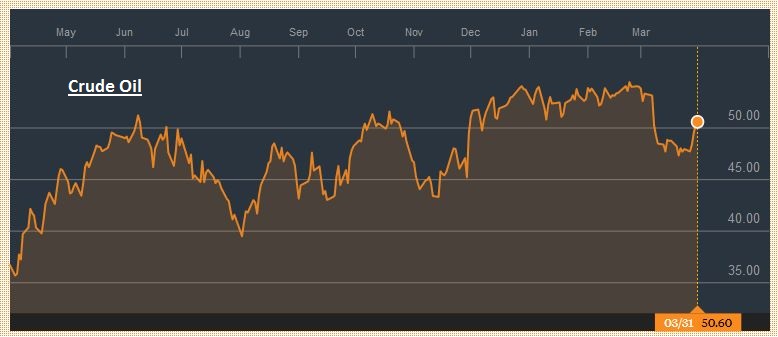 Source: bloomberg.com - Click to enlarge |
U.S. TreasuriesThe US 10-year yield recovered smartly after falling to 2.35%. However, it ran out of steam shy of 2.43% which was repeatedly tested in the second half of last week. On the week, the yield fell 2.5 bp. It was the third consecutive weekly decline. The yield bottomed closer to 2.30% in January and February. Some are calling a more even lower, though there has been a dramatic position adjustment in the futures markets, where the net short position has fallen by more than 80% from its record at the start of March. The Slow Stochastics have turned lower for the June note futures contract. The MACDs seem poised to cross shortly. The strong pre-weekend close suggest there may be one more push higher that may offer a low-risk sale opportunity. |
Yield US Treasuries 10 years, Mar 2016 - Mar 2017(see more posts on U.S. Treasuries, )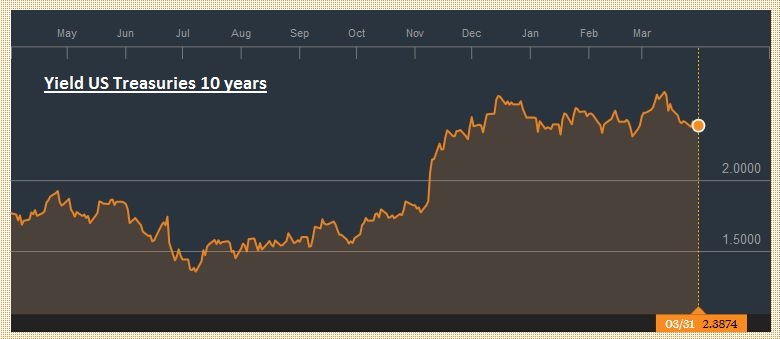 Source: bloomberg.com - Click to enlarge |
S&P 500 IndexThe S&P 500 had a poor close before the weekend. The rally from 2322 to 2370 seems exhausted the buying. Although the benchmark finished 0.8% higher on the week, it closed on its lows. The technical indicators appear supportive, but upside momentum needs to be reestablished. If not, the S&P 500 may slip back into the 2340-2350 area, ahead of the US jobs data at the end of the week. |
S&P 500 Index, April 01(see more posts on S&P 500 Index, )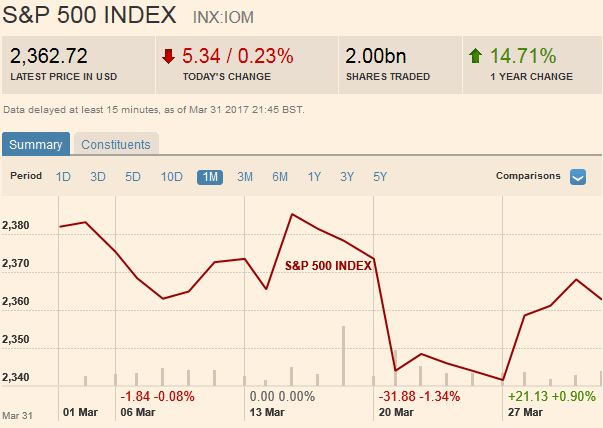 Source: markets.ft.com - Click to enlarge |
Are you the author? Previous post See more for Next post
Tags: Australian Dollar,Bollinger Bands,British Pound,Canadian Dollar,Crude Oil,EUR/CHF,EUR/USD,Euro,Euro Dollar,Japanese yen,MACDs Moving Average,Mario Draghi,newslettersent,RSI Relative Strength,S&P 500 Index,Stochastics,Swiss Franc Index,U.S. Dollar Index,U.S. Treasuries,usd-jpy,USD/CHF,USD/JPY


