


George Dorgan
My articles My siteAbout meMy videosMy books
Follow on:LinkedINTwitterSeeking Alpha
CFA SocietyEconomicBlogs
|
Swiss Franc Currency IndexThe Swiss Franc index recovered this week against the dollar index. The franc improved against both dollar and euro, given that the SNB was not dovish enough, |
Trade-weighted index Swiss Franc, March 18(see more posts on Swiss Franc Index, ) Source: markets.ft.com - Click to enlarge |
Swiss Franc Currency Index (3 years)The Swiss Franc index is the trade-weighted currency performance (see the currency basket)On a three years interval, the Swiss Franc had a weak performance. The dollar index was far stronger. The dollar makes up 33% of the SNB portfolio and 25% of Swiss exports (incl. countries like China or Arab countries that use the dollar for exchanges). Contrary to popular believe, the CHF index gained only 1.73% in 2015. It lost 9.52% in 2014, when the dollar (and yuan) strongly improved. |
Swiss Franc Currency Index (3 years), March 18(see more posts on Swiss Franc Index, )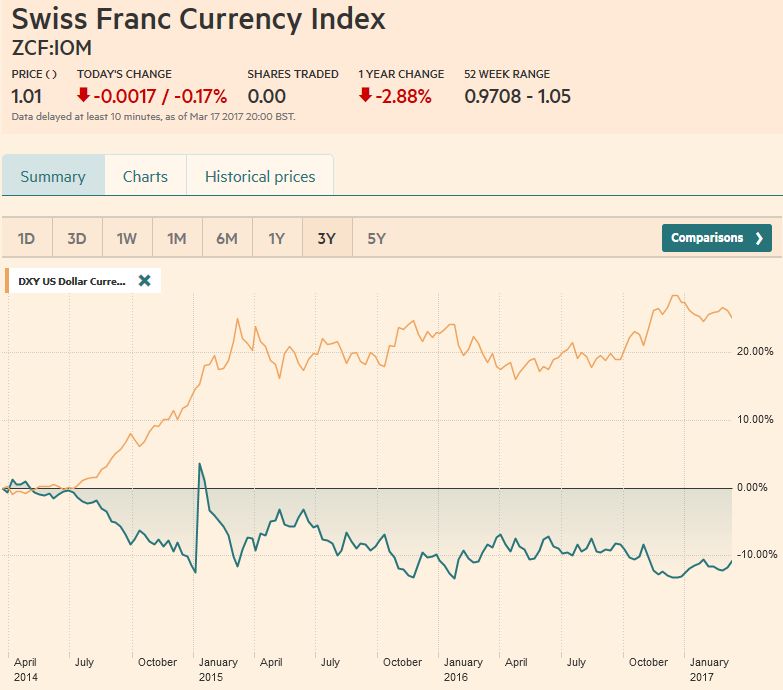 Source: markets.ft.com - Click to enlarge |
|
Marc Chandler My articles My offerMy siteAbout meMy videosMy books Follow on:LinkedINTwitterSeeking AlphaAmazon USD/CHFThe failure of the Fed to signal an increased pace of normalization and the prospects of other central banks raising rates spurred dollar losses, which deteriorated its technical outlook.
|
US Dollar/Swiss Franc FX Spot Rate, March 18(see more posts on USD/CHF, )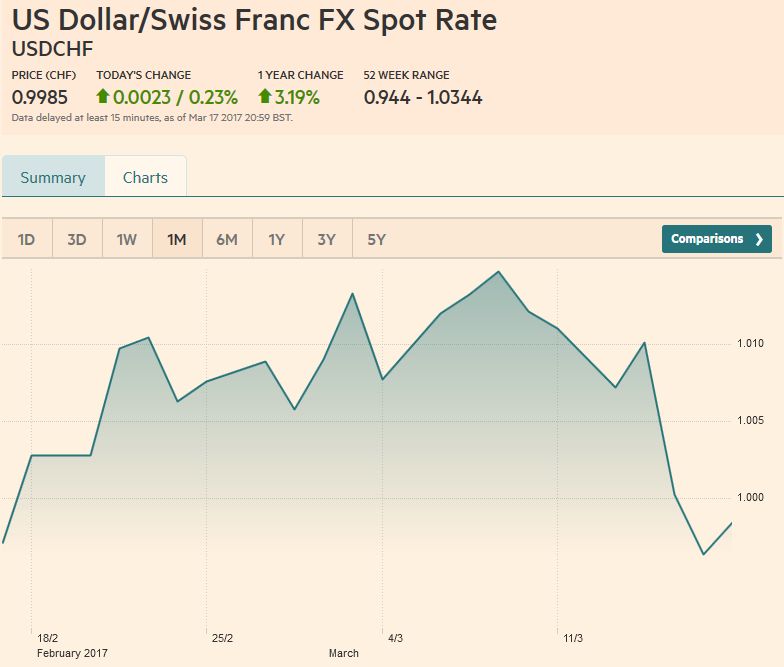 Source: markets.ft.com - Click to enlarge |
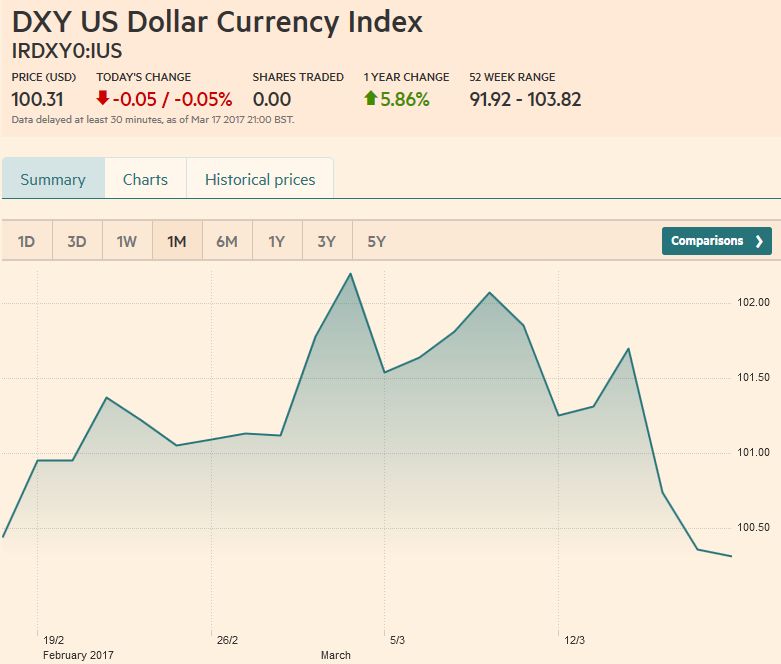
US Dollar IndexThe Dollar Index has been sold through the 61.8% retracement (~100.40) of the rally since February 2 low near 99.25. If the 100-level is breached now, a return to the early February low, looks more likely.
That 99.25 area is very important from a technical perspective. It corresponds to a 38.2% retracement of the rally since last May’s low and it is also a neckline of the old head and shoulders pattern. The measuring objective of the head and shoulders pattern is near 94.75, which is just above the 61.8% retracement of the rally since last May’s low. The five-day moving average is below the 20-day average for the first time in a month. Technical indicators are also aligned favoring the downside.
|
 |
EUR/USDThe euro appears set to test the early February high near $1.0830, which also corresponds to the 50% retracement of the losses since the US election (~$1.0820). The spike from the December ECB meeting was near $1.0875. The 61.8% retracement of losses since the US election is roughly $1.0935. Technical indicators favor additional gains, though the proximity of the upper Bollinger Band (~$1.0750) may deter new aggressive buying before a pullback. The euro’s five- and 20-day moving averages crossed after the US jobs data, but the dollar’s moving averages against the yen are only now set to cross. As often is the case, the dollar-yen rate is in a range. The JPY115 area marks the upper end of the two-month trading range. The lower end is near JPY111.60. The technical indicators are consistent with a test on the lower end of the range. If that fails to hold, the next target would be JPY110. |
EUR/USD with Technical Indicators, March 11 - 18(see more posts on Bollinger Bands, EUR/USD, MACDs Moving Average, RSI Relative Strength, Stochastics, )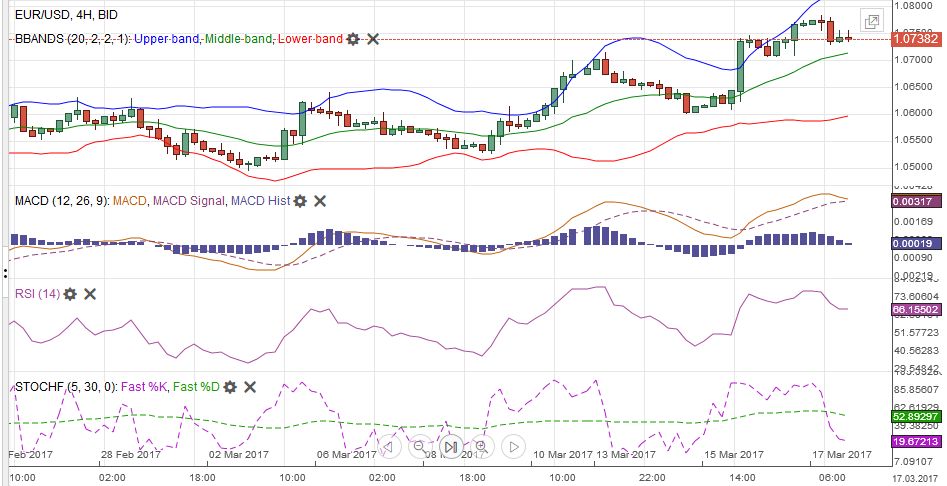 EUR/USD Week Ending March 18 with Technical Indicators - Click to enlarge |
USD/JPY |
USD/JPY with Technical Indicators, March 13 - 18(see more posts on Bollinger Bands, MACDs Moving Average, RSI Relative Strength, Stochastics, USD/JPY, )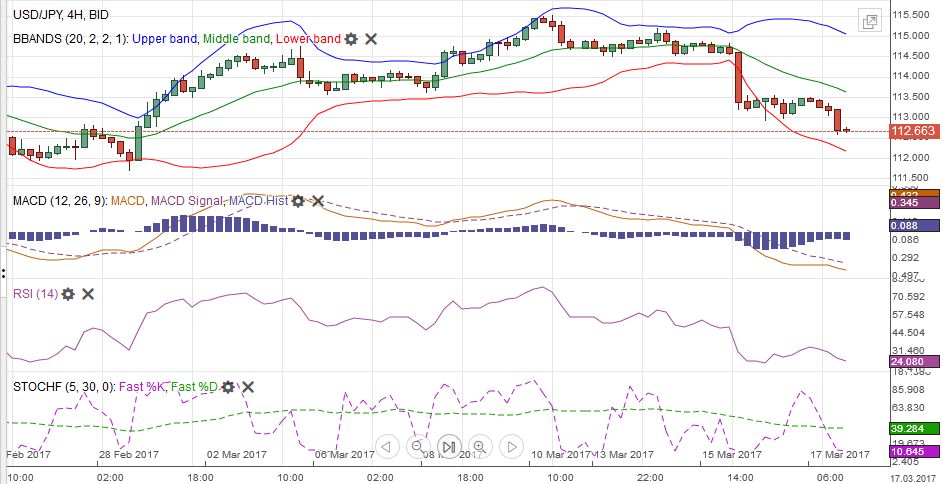 USD/JPY Week Ending March 18 with Technical Indicators - Click to enlarge |
GBP/USDSterling recovered smartly off the $1.21 area tested at the start of the week and finished the week near $1.24, which is the 50% retracement of its decline since February 2. A move above there would test the down trendline drawn off that February high and the high late in the month (~$1.2570). It begins the new week around $1.2430. The 61.8% retracement is near $1.2480. The five- and 20-day moving averages are set to cross in the coming days. The technical indicators warn against picking a top. |
GBP/USD with Technical Indicators, March 13 - 18(see more posts on Bollinger Bands, GBP/USD, MACDs Moving Average, RSI Relative Strength, Stochastics, )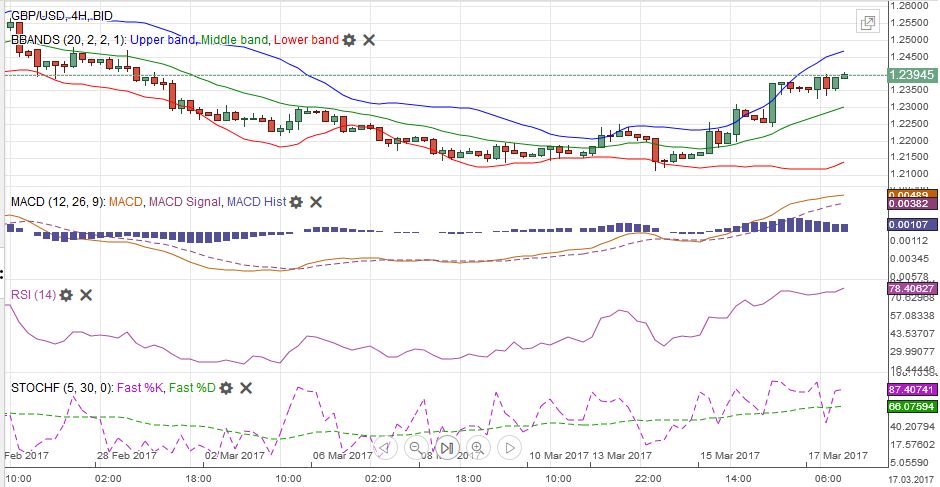 GBP/USD Week Ending March 18 with Technical Indicators - Click to enlarge |
AUD/USDThe Australian dollar has recovered from the brief dip below $0.7500 on March 9 to test the $0.7700 area. Although there were several violations of this ceiling last month, it remains an formidable barrier. The moving averages have crossed and the technical indicators suggest that it is too early to pick a top in the Aussie. The high from the US election was near $0.7780 and that may represent a good near-term target. |
AUD/USD with Technical Indicators, March 13 - 18(see more posts on Australian Dollar, Bollinger Bands, MACDs Moving Average, RSI Relative Strength, Stochastics, ) AUD/USD Week Ending March 18 with Technical Indicators - Click to enlarge |
USD/CADThe Canadian dollar’s technical tone is more mixed. The US dollar could rise toward CAD1.3440-CAD1.3480 within a consolidative phase. The MACDs and Slow Stochastics have turned against the US dollar but that seems to be the echo of the sharp drop spurred by the FOMC. The RSI is firmer which reflects the US dollar’s firmer tone in the past two sessions. The US dollar has risen against the Canadian dollar in all but four times in the past fifteen sessions. Support for the greenback is seen in the CAD1.3280-CAD1.3300 area. |
USD/CAD with Technical Indicators, March 13 - 18(see more posts on Bollinger Bands, Canadian Dollar, MACDs Moving Average, RSI Relative Strength, Stochastics, )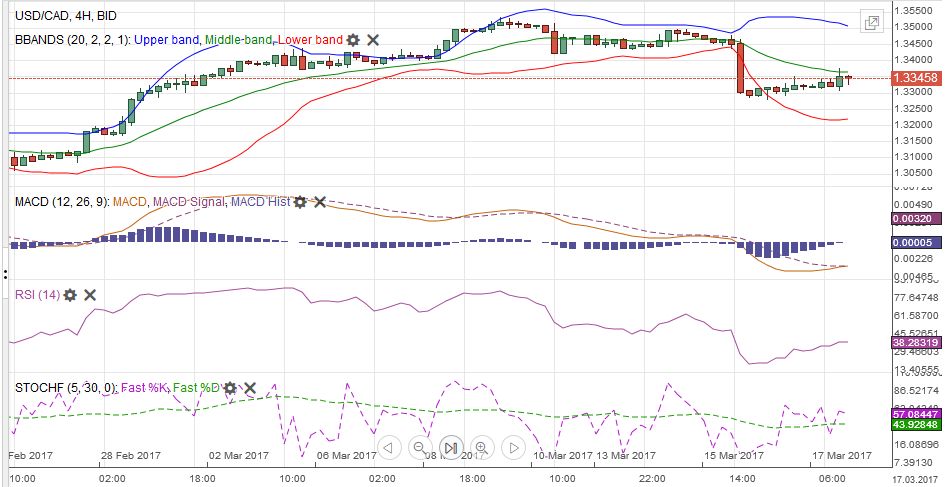 USD/CAD Week Ending March 18 with Technical Indicators - Click to enlarge |
Crude OilThe slide in oil prices from above $54 basis the May futures contract to below $48 in six sessions ended with the help of the first decrease in US inventories of the year. However, thus far the recovery is not impressive as it ran out of steam near $50. The technical indicators warn that while another push down is possible, corrective/consolidative phase has likely begun. |
Crude Oil, March 2016 - March 2017(see more posts on Crude Oil, ) Source: Bloomberg.com - Click to enlarge |
U.S. TreasuriesThe US 10-year yield stalled a little over 2.60%, and then was pushed through 2.50%. The 20-day moving average is 2.48%, and there is scope toward 2.43%. Speculators still have a large gross short position in the 10-year note futures, and that seems to be a significant consideration supporting prices. Stops are likely stacked above 124-06, which if triggered could see prices rise a little above 125-00. |
Yield US Treasuries 10 years, Mar 2016 - Mar 2017(see more posts on U.S. Treasuries, )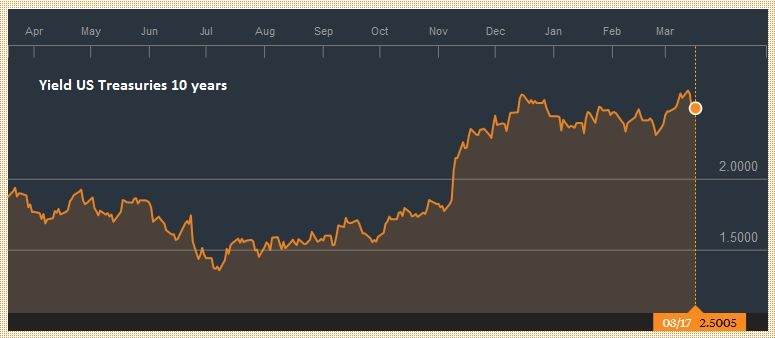 Source: Bloomberg.com - Click to enlarge |
S&P 500 IndexThere is a small gap in the S&P 500 from the higher opening on March 15. That gap is found between 2368.55 and 2368.94. The technical indicators are not generating robust signals, but for the past four months, a test on the 20-day moving average has been a buying opportunity. It is found a little below 2372. The record high was set on March 1 almost at 2401. A break of 2350 would likely sour the near-term tone and suggest that a correction of post-election rally is at hand. The first target is near 2317-2337. Below there is potential toward 2280-2300. |
S&P 500 Index, March 18(see more posts on S&P 500 Index, )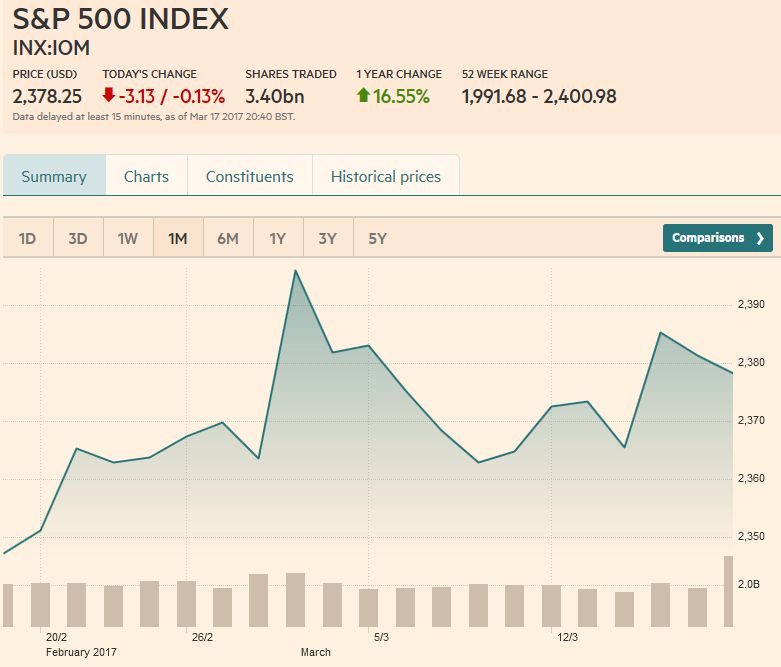 Source: markets.ft.com - Click to enlarge |
Are you the author?
Tags: Australian Dollar,Bollinger Bands,British Pound,Canadian Dollar,Crude Oil,Dollar Index,EUR/CHF,EUR/USD,Euro,Euro Dollar,Japanese yen,MACDs Moving Average,Mario Draghi,newslettersent,RSI Relative Strength,S&P 500 Index,Stochastics,Swiss Franc Index,U.S. Dollar Index,U.S. Treasuries,usd-jpy,USD/CHF,USD/JPY


