| There are actually two parts to examining the orthodox treatment of the output gap. The first is the review, looking backward to trace how we got to this state. The second is looking forward trying to figure what it means to be here. One final rearward assessment is required so as to frame how we view what comes next.
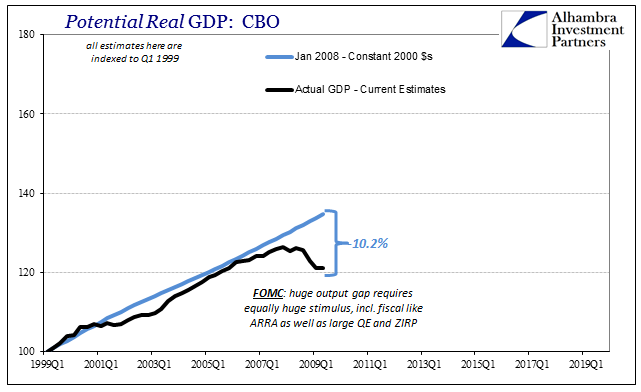
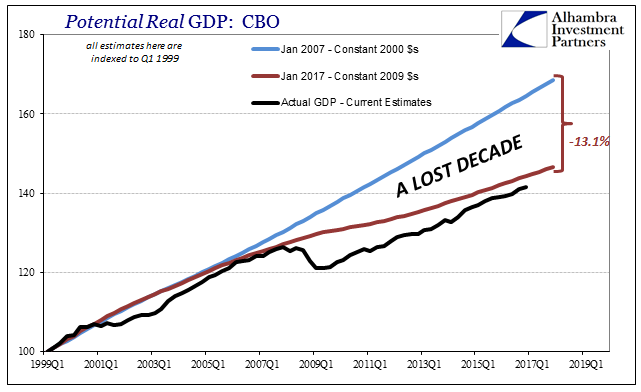
As I suggested earlier this week, the so-called output gap started at the trough of the Great “Recession” at around 10% of the CBO’s January 2008 calculation for potential. |
Potential Real GDP, 1999Q1 - 2009Q1 |
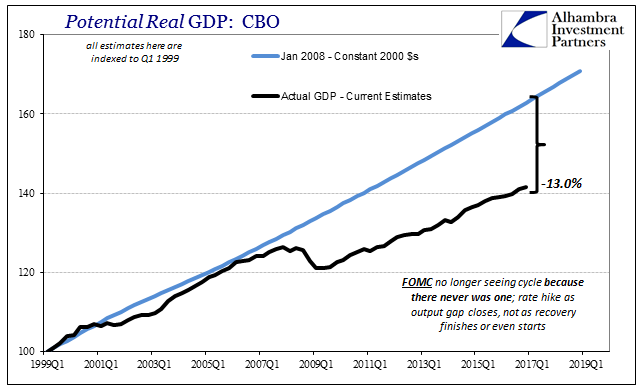
| Using that same standard of measure, by Q4 2016 the output gap had actually grown to nearly 13%.
This is an important point to establish, as it shows the problem with the economy was not merely the contraction from 2007 to 2009. In other words, it’s not as if the economy shrunk that one time and then resumed its prior growth if from a lower level. That would be a severe problem, too. The larger output gap shows clearly that the economy shrunk during the Great “Recession” and then continued to do so even though by traditional statistics it seems to be growing, or at least not further shrinking in absolute terms. There is relativity in economics (small “e”) that is a required parameter for analysis. It is in this comparison where we see how traditional economic accounts fall far short of telling the whole story; a story that absolutely needs to be told. Economists will, as they did just a few months ago, point to Q3 2016 GDP at 3.5% and claim that everything is fine, or at the very least fine enough. That positive number for real GDP growth is thus hugely misleading in two ways, the accounting backward and the projections forward. As to the former, the true measure of economy is not quarterly growth rates but rather this enlarging output gap (so to speak). Economists, especially policymakers, will no doubt claim this is an unfair and improper comparison. They will point to the latest CBO potential and state that the output did actually close and quite significantly. That, however, misses the whole point as these same economists before the Great “Recession” were sure it was a recession, and so the burden of proof is on them to show why they shouldn’t be held to that standard. After all, they claimed, as the public expected, full recovery and nearly ten years after should have been more than enough time to achieve it (not to mention all the “stimulus” along the way). This alternate view of the economy explains a lot about the state of the world; there’s does nothing of the sort. |
Potential Real GDP, 1999Q1 - 2017Q1 |
| Thus, the fallback on lazy and drug addicted American labor is a canard meant to distract from this comparison, one that I maintain fully is a proper one. The economy got worse, not better, and this is a good way to show it. Economists don’t really have answers for how the economy got this way, so they need still to answer for how the economy got this way.
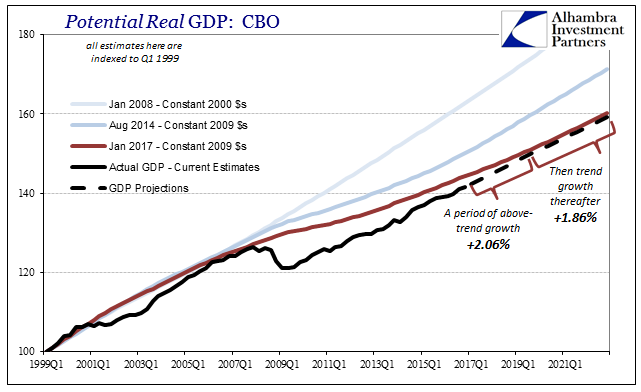
An enlarging output gap obliterates completely the whole idea of recovery, and thus recession. That mathematical view would match the experience and perception of a very large portion of Americans. The economy remains consistently their top concern because it remains a legitimate concern, if not disaster. And that leads to the second problem with Q3 GDP and the interpretations of it. If we go forward using the latest GDP assumptions on trend, real GDP is projected to grow at no more than 2.06% (on average) in order to fully close the rest of the remaining output gap by the end of 2019. From that point forward, being at trend, the growth rate is expected to be just 1.86%. Given where the economy is now, this doesn’t sound very appealing at all. Further, it shows what I have contended for years, especially in the middle of 2014, namely that “good” quarters in whatever economic account including GDP are the rarer exceptions. There is no expectation here for many future quarters to repeat what was by historical standard not really that good to begin with. Instead, the 1.9% in Q4 is more like the average growth rate environment we are staring right into. What used to be bad to the point of alarming, less than 2%, is now above our future baseline. |
Potential Real GDP, 1999Q1 - 2021Q1 |
| These are not my figures, either. They are calculated using the CBO data that is likely close to policy estimates. The Fed is raising rates, but that is not the same thing as a robust future; quite the contrary, as this is the part of the analysis they leave out of their public descriptions of “strong consumers.” Strong compared to what? The 2009 trough? By these benchmarks even that is a debatable proposition.
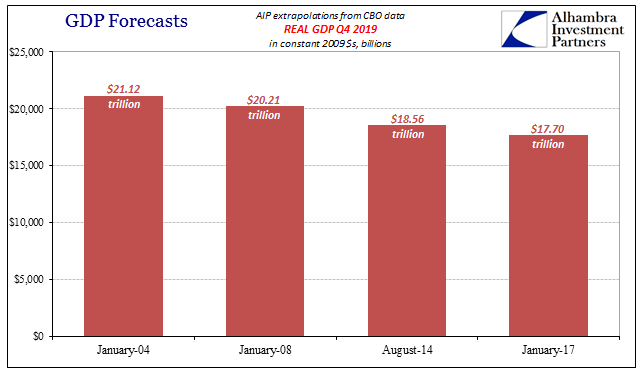
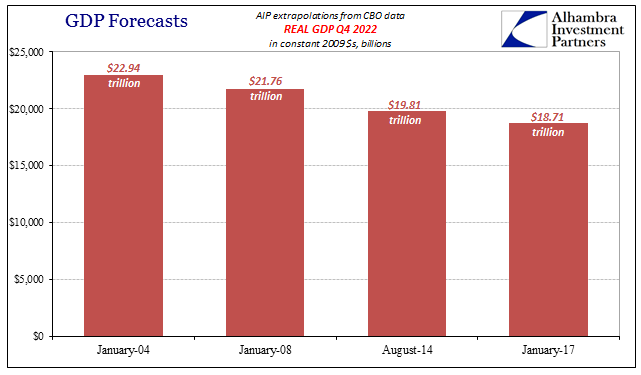
It offers more evidence to the appropriateness of the view of an enlarged and enlarging output gap. It explains how we could go from quarters that used to be highly abnormal to what is now perfectly normal. None of this is acceptable, but it will be so if economists are taken off the hook for how it got this way. Using these standards of economic measurement, we find that the economy isn’t growing but still shrinking. The costs, measured more appropriately in lost potential and thus lost opportunity, are getting bigger by the quarter. By the end of 2019, real GDP is projected to be around $17.7 trillion, about $900 billion less than it was projected to be even in August 2014 when supposedly everything looked so good. Compared to the January 2008 calculation of potential, it would be $2.5 trillion less. |
GDP Forecasts Jan 2004 - Jan 2017, Real GDP Q4 2019 |
| By the end of 2022, the deficits get larger; to the August 2014 baseline, $1.1 trillion; to the one from January 2008, $3.1 trillion. In other words, there remains the heavy lifting yet to be done even after ten years, the required measures to get ourselves out of this enlarging disaster before it goes too far. |
GDP Forecasts Jan 2004 - Jan 2017, Real GDP Q4 2022 |
| The problem with the Fed raising the federal funds target band is not that they are doing that instead of another QE or the next genius idea that would follow that failure, but what it says about their view of the shrinking economy – it is for them just the way it is and will be. With no other answers as to why or how, might as well be graying hair and drug addiction as anything more reasonable and inconvenient. Their output gap is closed, and I could not concur in more positive terms. As I wrote earlier for today: |
Potential Real GDP 1999Q1 - 2017Q1 |
|
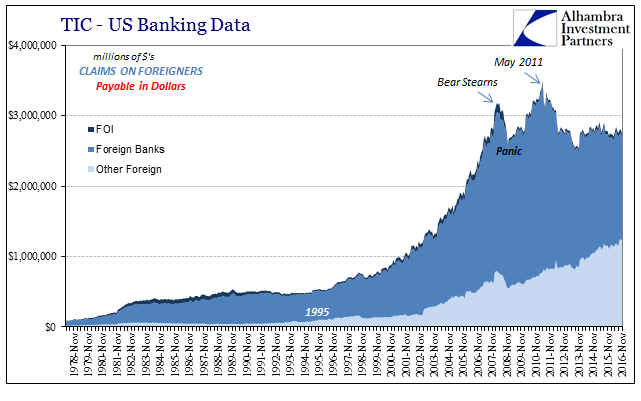
TIC - US Bank Data Claims On Foreigners in Dollars |
Tags: cbo,central-banks,currencies,depression,dollar,economy,EuroDollar,Federal Reserve,Federal Reserve/Monetary Policy,FOMC,Janet Yellen,Markets,Monetary Policy,Money Supply,newslettersent,Output Gap,QE,recession,ZIRP


