George Dorgan
My articles My siteAbout meMy videosMy books
Follow on:LinkedINTwitterSeeking Alpha
CFA SocietyEconomicBlogs
|
Swiss Franc Currency IndexAfter a certain recovery in the last month, the Swiss Franc index lost ground again in this month. It is down one percent for this month, while the dollar index is up one percent. |
Trade-weighted index Swiss Franc, February 25(see more posts on Swiss Franc Index, )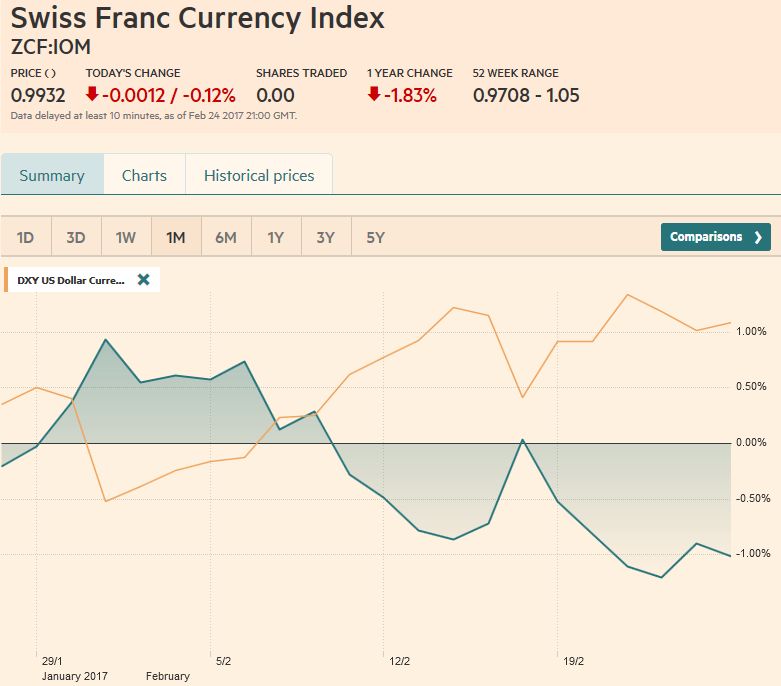 Source: markets.ft.com - Click to enlarge |
Swiss Franc Currency Index (3 years)The Swiss Franc index is the trade-weighted currency performance (see the currency basket)On a three years interval, the Swiss Franc had a weak performance. The dollar index was far stronger. The dollar makes up 33% of the SNB portfolio and 25% of Swiss exports (incl. countries like China or Arab countries that use the dollar for exchanges). Contrary to popular believe, the CHF index gained only 1.73% in 2015. It lost 9.52% in 2014, when the dollar (and yuan) strongly improved. |
Swiss Franc Currency Index (3 years), February 25(see more posts on Swiss Franc Index, )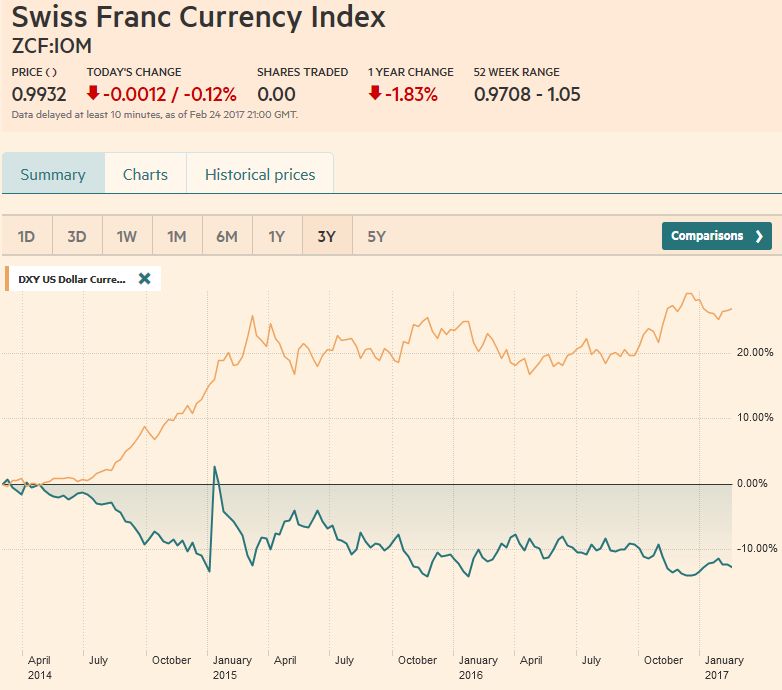 Source: markets.ft.com - Click to enlarge |
|
Marc Chandler My articles My offerMy siteAbout meMy videosMy books Follow on:LinkedINTwitterSeeking AlphaAmazon USD/CHFIt is difficult right now to talk about the foreign exchange market using the dollar as the numeraire. The dollar was stronger against most of the major currencies last week, but not the yen or sterling. The Dollar Index itself was little changed, rising less than 0.15%. When everything was said and done more was said than done. The FOMC minutes and official comments left March and June Fed fund futures contracts implying a half a basis point higher rares, which is essentially the spread between the bid and offer. To the extent there has been a shift, it is a recognition by many, including ourselves, that a move in May has much to recommend itself. The implied yield on the May contract rose two basis points last week. To the extent hat there was a US focus it was increasing recognition of the importance of new week’s address by President Trump to a joint session of Congress. However, we suggest that the main driver was in America but Europe. Over the past week, the US two-year yield slipped three basis points. The two-year yield in Germany eased more than nine basis points. Over the past month, the German two-year yield has fallen nearly 30 bp to a new record low nearing minus 100 bp. The comparable US yield was off nine basis points. The euro’s correlation with the two-year interest rate differential is at a robust 0.65 (on percentage change basis) over the past sixty sessions. |
US Dollar/Swiss Franc FX Spot Rate, February 25(see more posts on USD/CHF, )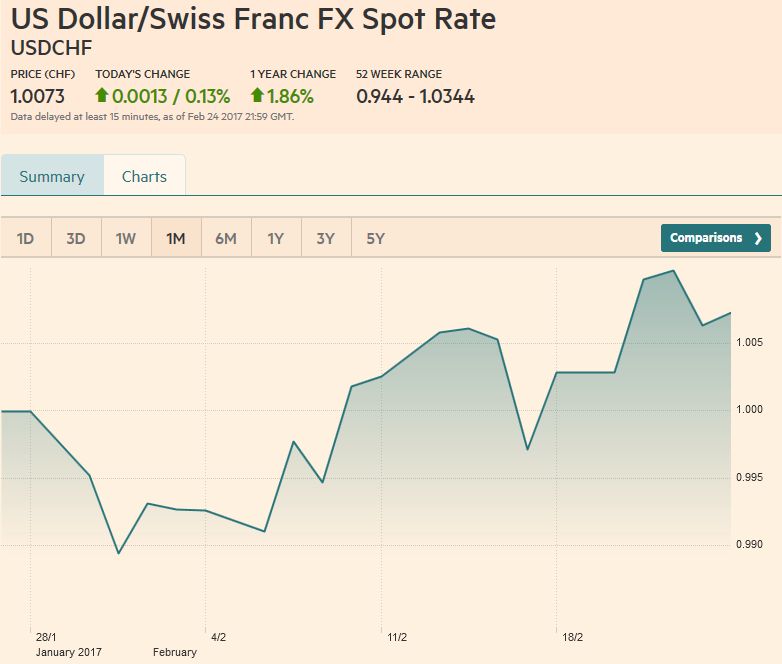 Source: markets.ft.com - Click to enlarge |
US Dollar IndexThe Dollar Index held important support before the weekend, allowing it to finish the week on a firm note with a potential hammer candle stick pattern. The 100.40 level is the neckline of a potential double top that within a possible right shoulder of a three-month head and shoulder pattern. It made a low near 100.65 before recovering, which is also just ahead of the 20-day moving average (~100.57). While initial resistance is seen near 101.75, the 102.00 area is key for the medium-term.
|
US Dollar Currency Index, February 25(see more posts on US Dollar Index, )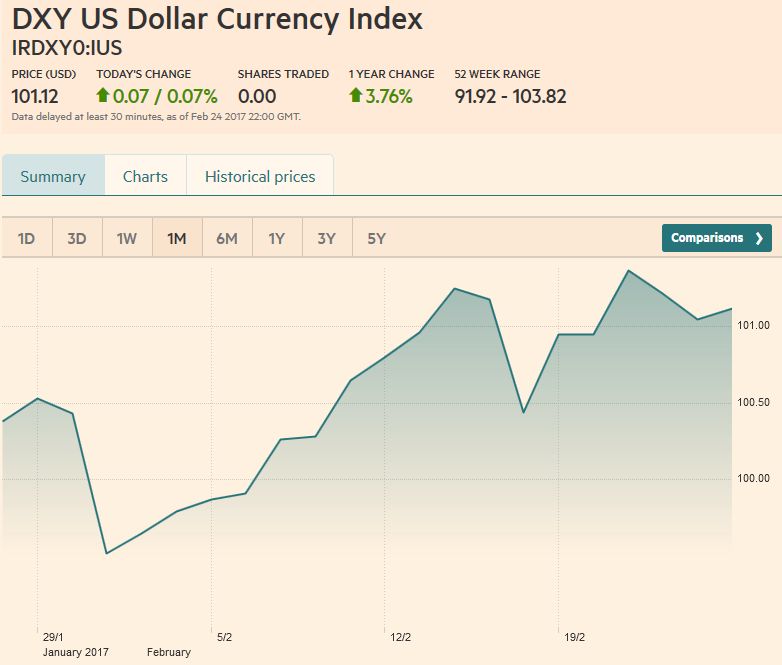 Source: markets.ft.com - Click to enlarge |
EUR/USDThe euro had a poor close before the weekend. After popping up to a four-day high just below $1.0620, it was slapped down to session lows near $1.0565, where it consolidated for the remainder of the session. The euro lost ground against the dollar for the third consecutive week and the fourth week in the past five. The euro appears to be in a $1.05-$1.07 range, and within it, a tighter range of $1.0540-$1.0620 dominates. |
EUR/USD with Technical Indicators, February 20-25(see more posts on Bollinger Bands, EUR/USD, MACDs Moving Average, RSI Relative Strength, Stochastics, ) EUR/USD Week Ending February 25 with Technical Indicators - Click to enlarge |
USD/JPYThe dollar finished last week with a three-day slide against the yen that took it to a two-week low a little below JPY112.00. |
USD/JPY with Technical Indicators, February 20 - 25(see more posts on Bollinger Bands, MACDs Moving Average, RSI Relative Strength, Stochastics, USD/JPY, ) USD/JPY Week Ending February 25 with Technical Indicators - Click to enlarge |
GBP/USDFor most of February, sterling has been confined to a $1.24-$1.26 trading range. Dips below $1.24 have taken place but it has tended to spur demand, and there has not been a close below it since January 20. The technical indicators we use are not generating strong signals, though, despite the poor pre-weekend price action, there may still be a residual upside bias. |
GBP/USD with Technical Indicators, February 20 - 25(see more posts on Bollinger Bands, GBP/USD, MACDs Moving Average, RSI Relative Strength, Stochastics, )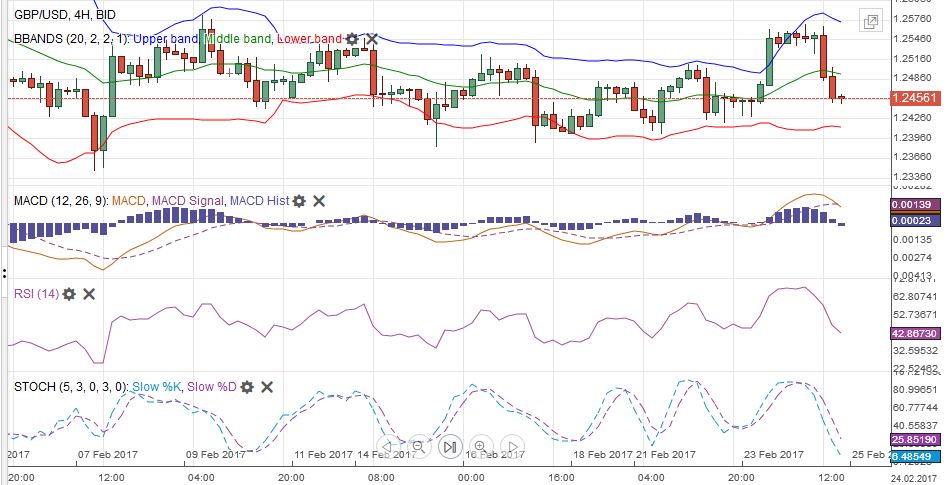 GBP/USD Week Ending February 25 with Technical Indicators - Click to enlarge |
AUD/USDThe Australian dollar made a new high for the year toward the end of last week near $0.7740, but the gains were quickly reversed, keeping the $0.7600-$0.7700 range intact, even if frayed. We continue to expect that the eventual break of the range will come to the downside, and note that the technical indicators did not confirm the new high. |
AUD/USD with Technical Indicators, February 20 - 25(see more posts on Australian Dollar, Bollinger Bands, MACDs Moving Average, RSI Relative Strength, Stochastics, )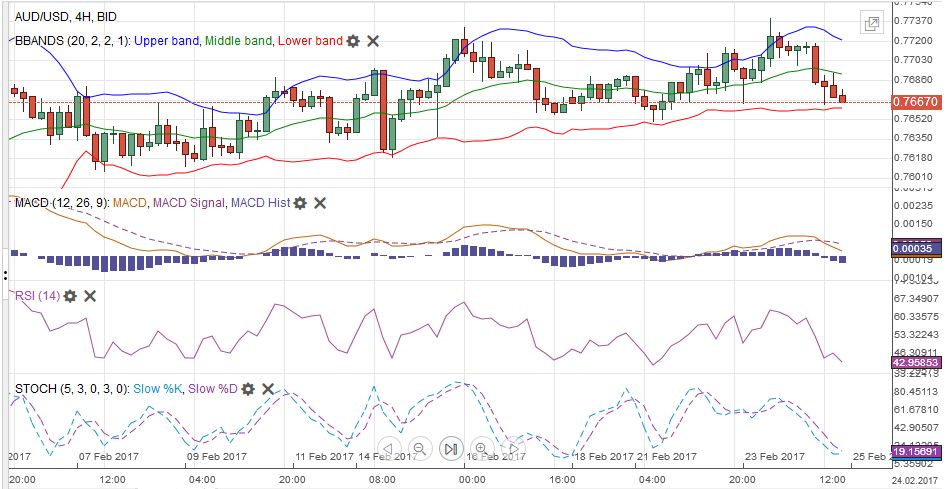 AUD/USD Week Ending February 25 with Technical Indicators - Click to enlarge |
USD/CADWithout much momentum to speak of, the US dollar drifted higher against the Canadian dollar for the third consecutive week. Here too a range affair has unfolded in recent weeks between CAD1.30 and CAD1.32. The Bank of Canada meets in the week ahead, and although the retail sales disappointed (-0.5%), it was old news (December), and January data looks more robust. Policy is on hold, and the central bank’s economic assessment is unlikely to have changed very much. |
USD/CAD with Technical Indicators, February 20 - 25(see more posts on Bollinger Bands, Canadian Dollar, MACDs Moving Average, RSI Relative Strength, Stochastics, )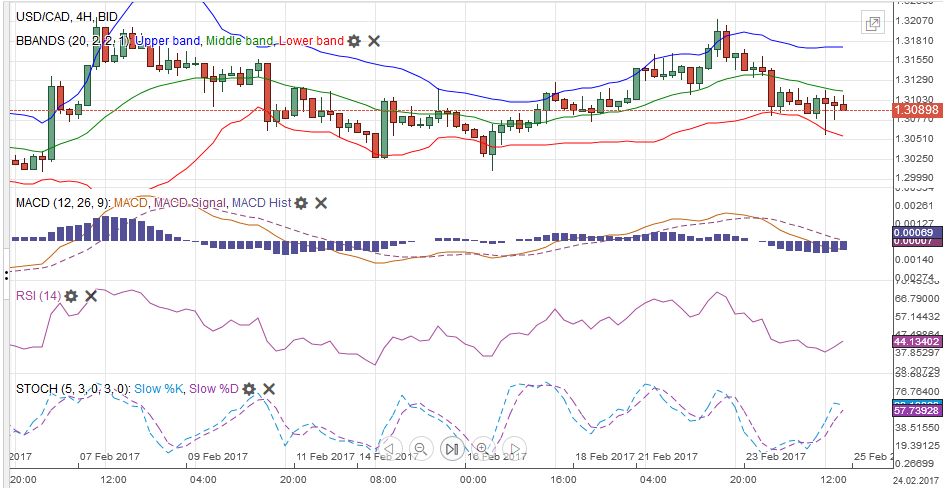 USD/CAD Week Ending February 25 with Technical Indicators - Click to enlarge |
Crude OilThe April light sweet crude oil futures contract straddled the $54 a barrel level most of the last week. The broader near-term range is $53-$55, and it is difficult to get enthusiastic inside this range. While OPEC has a high compliance rate, non-OPEC has less, and US output and exports have increased. At the same time, the recent advanced PMI reports point to strong Q1 for world growth, which means demand.
|
Crude Oil, Mar 2016 - Feb 2017(see more posts on Crude Oil, )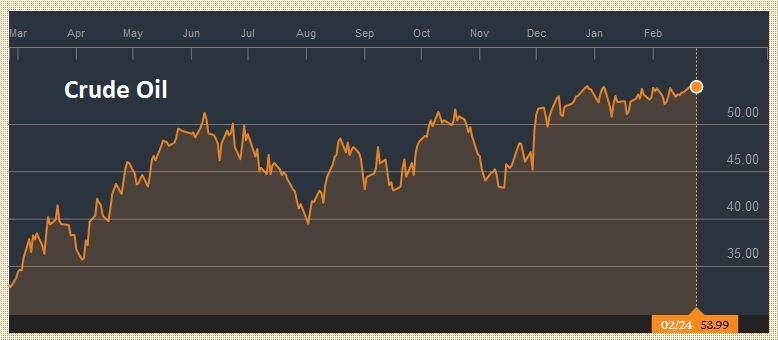 Source: Bloomberg.com - Click to enlarge |
U.S. TreasuriesThe US 10-year yield has slipped back to the lows of the year near 2.30%. The downward drift comes despite a strong batch of data has the NY Fed’s GDP tracker looking for 3.1% growth this quarter. It comes despite the tick up in inflation and the expected uptick in the preferred core PCE deflator in the week ahead. While chins wagged over recent data that showed China and Japan continued to divest US Treasuries, the market appears to have easily absorbed the actual sales and news. A break of 2.30% could see 2.20%. Then March note futures contract finished at its best level since mid-November. Signals by the Administration officials make it seem as if the much-awaited infrastructure program is a 2018 story, not 2017. The 125-16 area that held in January and earlier this month is the 38.2% retracement of the sell-off since the US election was surpassed before the weekend. Technical indicators appear consistent with additional gains, but not necessarily to the 50% retracement target near 126-14. |
Yield US Treasuries 10 years, Mar 2016 - Feb 2017(see more posts on U.S. Treasuries, ) Source: Bloomberg.com - Click to enlarge |
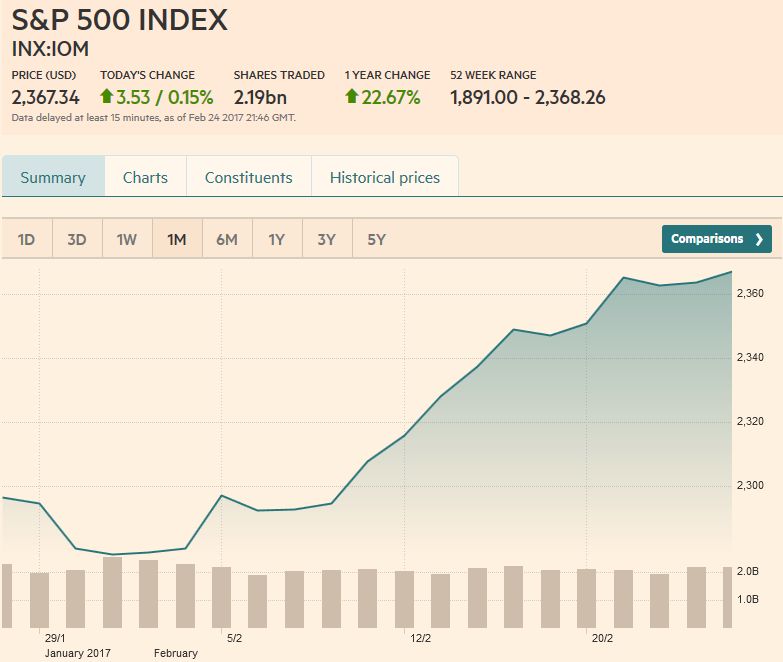
S&P 500 IndexThe S&P 500 eked out a fifth week of gains. It is up 5.7% this year and leads the G7 equity benchmarks. It is up twice the DAX’s 2.8% gain which puts it in second place. Technical indicators look stretched and set poised to turn down, but the tone remains resilient, as the pre-weekend recovery illustrates. While institutional investors may be cautious, retail appears to be providing new funds. Initial support is seen in near 2350 and then 2340. Recall the S&P 500 gapped higher on Tuesday after the Monday holiday. The gap was entered ahead of the weekend but was not completely filled. It is found roughly between 2351 and 2353.
|
 |
Are you the author?
Tags: Australian Dollar,Bollinger Bands,British Pound,Canadian Dollar,Crude Oil,Dollar Index,EUR/CHF,EUR/USD,Euro,Euro Dollar,Japanese yen,MACDs Moving Average,newslettersent,RSI Relative Strength,S&P 500 Index,Stochastics,Swiss Franc Index,U.S. Treasuries,US Dollar Index,usd-jpy,USD/CHF,USD/JPY